Earth Syst. Sci. Data, 4, 143–148, 2012 www.earth-syst-sci-data.net/4/143/2012/ doi:10.5194/essd-4-143-2012
©Author(s) 2012. CC Attribution 3.0 License.
History
of Geo- and SpaceSciences
Open
Access
Advances
inScience & Research
Open Access Proceedings
Open
Access
Earth System
Science
Data
OpenAccess
Earth System
Science
Data
D
iscussions
Drinking Water
Engineering and Science
Open Access
Drinking Water
Engineering and Science
Discussions
O
pen
Acc
es
s
Social
Geography
Open
Access
D
iscussions
Social
Geography
Open
Access
Future Flows Climate: an ensemble of 1-km climate
change projections for hydrological application in Great
Britain
C. Prudhomme1, S. Dadson2, D. Morris1, J. Williamson1, G. Goodsell1, S. Crooks1, L. Boelee1,
H. Davies1, G. Buys1,3, T. Lafon1, and G. Watts4
1Centre for Ecology and Hydrology, Maclean Building, Benson Lane, Crowmarsh Gifford, Wallingford, OXON, OX10 8BB, UK
2School of Geography and the Environment, University of Oxford, South Parks Road, Oxford, OX1 3QY, UK 3British Antarctic Survey, High Cross, Madingley Road, Cambridge, CB3 0ET, UK
4Evidence Directorate: Scientific and Evidence Services, Horizon House, Deanery Road, Bristol BS1 5AH, UK
Correspondence to: C. Prudhomme ([email protected])
Received: 6 June 2012 – Published in Earth Syst. Sci. Data Discuss.: 27 June 2012 Revised: 31 October 2012 – Accepted: 13 November 2012 – Published: 16 November 2012
Abstract. The dataset Future Flows Climate was developed as part of the project “Future Flows and Ground-water Levels” to provide a consistent set of climate change projections for the whole of Great Britain at both space and time resolutions appropriate for hydrological applications, and to enable climate change uncertainty and climate variability to be accounted for in the assessment of their possible impacts on the environment. Future Flows Climate is derived from the Hadley Centre’s ensemble projection HadRM3-PPE that is part of the basis of UKCP09 and includes projections in available precipitation (water available to hydrological processes after snow and ice storages have been accounted for) and potential evapotranspiration. It corresponds to an 11-member ensemble of transient projections from January 1950 to December 2098, each a single realisation from a different variant of HadRM3. Data are provided on a 1-km grid over the HadRM3 land areas at a daily (available precipitation) and monthly (PE) time step as netCDF files.
Because systematic biases in temperature and precipitation were found between HadRM3-PPE and gridded temperature and precipitation observations for the 1962–1991 period, a monthly bias correction procedure was undertaken, based on a linear correction for temperature and a quantile-mapping correction (using the gamma distribution) for precipitation followed by a spatial downscaling. Available precipitation was derived from the bias-corrected precipitation and temperature time series using a simple elevation-dependant snow-melt model. Potential evapotranspiration time series were calculated for each month using the FAO-56 Penman-Monteith equations and bias-corrected temperature, cloud cover, relative humidity and wind speed from HadRM3-PPE along with latitude of the grid and the day of the year.
Future Flows Climate is freely available for non-commercial use under certain licensing conditions. It is the dataset used to generate Future Flows Hydrology, an ensemble of transient projections of daily river flow and monthly groundwater time series for representative river basins and boreholes in Great Britain.
1 Background
Climate change may increase temperatures and change rain-fall across England, Wales and Scotland (Murphy et al., 2009). In turn, this may modify patterns of river flow and groundwater recharge, affecting the availability of water and changing the aquatic environment. There have been many studies of the impact of climate change on river flows in different parts of the UK (e.g. Charlton and Arnell, 2011; Diaz-Nieto and Wilby, 2005; Holman, 2006; Kay et al., 2009; Ledbetter et al., 2011; Limbrick et al., 2000; Lopez et al., 2009; Nawaz and Adeloye, 2006; Prudhomme and Davies, 2009; Prudhomme et al., 2010; Wilby and Harris, 2006; Kay and Jones, 2010), but coverage is uneven and methods vary. This means it is very difficult to compare different locations, complicating the identification of appropriate adaptation re-sponses.
The project “Future Flows and Groundwater Levels” was established to provide datasets and products facilitating the assessment of climate change impact on a range of water-related issues across Great Britain within a nationally con-sistent framework. Future Flows Climate is a concon-sistent set of climate change projections for the whole of Great Britain at both space and time resolutions appropriate for hydrolog-ical applications, and to enable climate change uncertainty and climate variability to be accounted for in the assessment of their possible impacts on the environment.
At the end of the project, the transient daily time series and the datasets necessary for their calculations were made accessible to the research community so that further impact analyses can be made on a range of specific areas such as fishery, freshwater ecology, water availability etc. The length (around 150 yr) and geographical spread (over Great Britain) of the time series will enable powerful spatio-temporal anal-ysis of the impact of climate change on UK rivers, possible for the first time at such a scale in the UK thanks to a strict methodological framework which ensures consistency, and hence comparability, of all generated data.
This paper gives an overview of the climate projections at the origin of Future Flows Climate (Sect. 2), then describes how temperature, precipitation and potential evapotranspira-tion time series were derived. It concludes by considering some of the limitations of Future Flows Climate and how to access the data.
2 Data: the ensemble of climate projections HadRM3-PPE
2.1 Description
Future Flows Climate is based on HadRM3-PPE-UK, a set of transient climate projections for the UK that were used as part of the derivation of the UKCP09 scenarios (Murphy et al., 2007). HadRM3-PPE-UK is an experiment designed to simulate the regional climate for the UK for the period
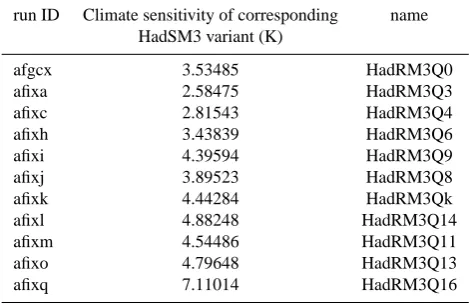
Table 1.HadRM3-PPE run ID, climate sensitivity and model vari-ant name. From http://badc.nerc.ac.uk.
run ID Climate sensitivity of corresponding name HadSM3 variant (K)
afgcx 3.53485 HadRM3Q0 afixa 2.58475 HadRM3Q3 afixc 2.81543 HadRM3Q4 afixh 3.43839 HadRM3Q6 afixi 4.39594 HadRM3Q9 afixj 3.89523 HadRM3Q8 afixk 4.44284 HadRM3Qk afixl 4.88248 HadRM3Q14 afixm 4.54486 HadRM3Q11 afixo 4.79648 HadRM3Q13 afixq 7.11014 HadRM3Q16
1950–2100 for historical and SRES A1B emissions scenar-ios; while it aims to represent parameter uncertainty through a parameter variant experiment, the ensemble undersamples the GCM uncertainty and excludes emissions scenario uncer-tainty. It contains the output of the Met Office Hadley Cen-tre’s Regional Climate Model HadRM3 used to dynamically downscale the global climate model HadGM3 results. It con-sists of an 11-member ensemble, each driven by the same historical and SRES A1B emissions, with one unperturbed member and 10 members with different perturbations to the atmospheric parametrisations (Murphy et al., 2009). The cli-mate sensitivities associated with each ensemble member along with their run ID and model name are given in Table 1. Detailed information on the model ensemble can be found at http://badc.nerc.ac.uk/data/hadrm3-ppe-uk/.
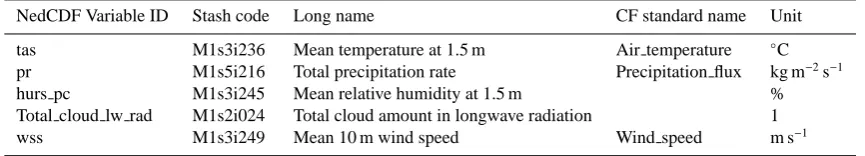
Table 2.HadRM3-PPE variables used to derive Future Flows Climate.
NedCDF Variable ID Stash code Long name CF standard name Unit tas M1s3i236 Mean temperature at 1.5 m Air temperature ◦
C pr M1s5i216 Total precipitation rate Precipitation flux kg m−2s−1
hurs pc M1s3i245 Mean relative humidity at 1.5 m % Total cloud lw rad M1s2i024 Total cloud amount in longwave radiation 1 wss M1s3i249 Mean 10 m wind speed Wind speed m s−1
2.2 Temperature
HadRM3-PPE daily temperature time series were spatially downscaled and bias-corrected based on the 5-km daily tem-perature time series UKCP09 gridded observation datasets (Perry et al., 2009). A linear additive transfer function (Le-ander and Buishand, 2007) was applied to the HadRM3-PPE temperature time series at the 5-km resolution of the obser-vation for each month. The parameters of the transfer func-tion were estimated so that, for each 5-km grid cell and over the period 1962–2000, mean monthly bias-corrected temper-ature matched the mean monthly observed tempertemper-ature over the same area. Each transfer function was calculated inde-pendently hence resulting in 11 sets of 12 transfer functions for each 5-km cell of UKCP09 temperature grid. The sets were then applied to each day of the 1950–2098 HadRM3-PPE temperature ensemble members.
Bias-corrected temperature is an intermediate product and not part of Future Flows Climate.
2.2.1 Future Flows Climate: available precipitation
With temperature rising, the partition of precipitation be-tween rainfall and snowfall in snow-influenced regions (such as for example Scotland and some parts of northern Eng-land and Wales) is likely to differ from that observed histor-ically. However, the role of precipitation in the hydrological processes and runoffgeneration differs greatly depending on whether it falls as rain or snow, because water contained in snow (and ice or snow-pack) is locked for a certain period and does not run-off immediately. With a warming of the climate, snow-driven delay is likely to play a smaller role, potentially modifying river flow seasonal pattern.
2.3 Spatial downscaling and bias correction
Spatial downscaling and bias correction were first performed on HadRM3-PPE precipitation time series. Similarly to Piani et al. (2010) precipitation and temperature bias-corrections were done independently. While this might introduce some physical discrepancies between both variables as it might modify their relationships, the introduced uncertainty is con-sidered small compared to the range of other uncertainty sources.
The procedure uses a 25-km average observed daily pre-cipitation matching the resolution of HadRM3-PPE aggre-gated from the 1-km daily observed precipitation time series (Keller et al., 2006) to establish a transfer function for each month and each 25-km grid of the averaged observational data. The transfer function follows the parametric quantile-mapping method described by Piani et al. (2010) based on the gamma distribution; it aims to minimise the difference between those observed and simulated daily pattern at that grid. When applied to the HadRM3-PPE daily time series (with total precipitation converted into mm for each day), this transfer function generates a new 25-km bias-corrected gridded daily time series where most of the statistical prop-erties (and in particular the first two statistical moments of daily rainfall) are similar to the observed for the same histori-cal period 1962–1991. Applying the bias correction to 25-km grid scale ensures that spatial dependency of rainfall time se-ries (important for hydrological modelling) within each grid square is maintained. This is not guaranteed from one grid to another, but the evaluation of the resulting time series at catchment scale suggests the method to be appropriate (not shown). The time series is then further downscaled at 1-km based on the observed annual precipitation variability within each grid, so that the sub-grid orographic effect can be in-cluded within the generated 1-km time series. Fuller descrip-tion of the method and its validadescrip-tion can be found in Newton et al. (2012).
2.4 Accounting for snow melt processes
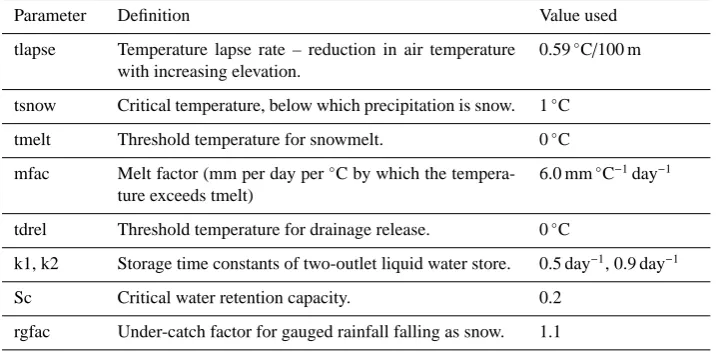
Snow-melt processes are accounted for by using a sim-ple elevation-dependent snow-melt model (Bell and Moore, 1999) to estimate when water is available for runoff. Each 1-km grid is subdivided into elevation bands of 50-m vertical extent using elevation data from the CEH Integrated Hydro-logical Digital Terrain Model (Morris and Flavin, 1990). For temperature calculation each band is treated as being at the elevation of its mid-range. A lapse rate (linear reduction of temperature with elevation) is used for converting the values from the 5-km temperature bias-corrected gridded time se-ries to values applicable in the 1-km grids. Table 3 lists the parameters and the values used. Note that no allowance has been made for the effects of lakes.
Table 3.Snowmelt model parameters.
Parameter Definition Value used tlapse Temperature lapse rate – reduction in air temperature
with increasing elevation.
0.59◦
C/100 m tsnow Critical temperature, below which precipitation is snow. 1◦
C tmelt Threshold temperature for snowmelt. 0◦
C mfac Melt factor (mm per day per◦
C by which the tempera-ture exceeds tmelt)
6.0 mm◦
C−1day−1
tdrel Threshold temperature for drainage release. 0◦
C
k1, k2 Storage time constants of two-outlet liquid water store. 0.5 day−1, 0.9 day−1
Sc Critical water retention capacity. 0.2 rgfac Under-catch factor for gauged rainfall falling as snow. 1.1
precipitation” (APr, in mm) 148-yr time series using this method, and using the bias-corrected temperature time se-ries.
2.5 Treatment of non-calendar year
The HadRM3-PPE generates precipitation and temperature time series according to an artificial year of 360 days grouped into twelve 30-day months. However, the requirement for the water available from precipitation time series was for Grego-rian years (365/6 days) for use in generating river flow times series that can readily be compared with observations. This was achieved by inserting five zero-rainfall days (six in a leap year) into each year of HadRM3-PPE data.
For each individual year, insertion dates were selected for the additional days according to the following criteria:
– The same set of dates must be used at all grid points in
GB in order to avoid any spatial discontinuities within rainfall events.
– The dates must be within ±20 days of days 36, 108, 180, 252 and 324 (30, 90, 150, 210, 270 and 330 for leap years).
– Within each of these ranges, the preferred date is the one
at which insertion of a zero-rainfall day will interrupt a two-day rainfall sequence (defined as two consecutive days with more than 5 mm of rainfall) at the smallest number of grid points in GB.
The temperature on the inserted zero-rainfall days was set to the average of that on the preceding and following day.
2.6 File format
Available precipitation time series from Future Flows Cli-mate are saved in different netCDF files to increase the speed
of downloading, copying, reading and manipulations. APr datasets (corresponding to the total daily available precip-itation expressed in mm) from each 11-ensemble member are saved separately and for 30-yr periods. File names con-tain the name of the ensemble member consistently with the Hadley Centre’s notations (run ID in Table 1) and the time period. A total of 11×5=55 files describe the entire APr dataset, of 18.5 Gb each. The entire time series period ranges from 1950 to 2098. More information on method and its val-idation is described in Morris (2012).
3 Potential evapotranspiration
Evapotranspiration is an important element of the hydrologi-cal processes as it represents the main loss of water from pre-cipitation to runoff. Evaporative and transpiration losses are complex processes depending on available water and energy (hence including feedbacks) and on plant demands. Poten-tial evapotranspiration is the simplified concept of losses that would occur if water were un-limited and did not depend on antecedent conditions. Potential evapotranspiration has been found to be a useful conceptualisation for detailed hydrolog-ical and hydrogeologhydrolog-ical modelling.
Potential evapotranspiration at 5-km resolution was gen-erated using HadRM3-PPE climate time series, based on the FAO-56 Penman-Monteith method (Allen et al., 1998). The 5-km downscaled and bias-corrected daily temperature time series were used as they are a more realistic representation of temperature than HadRM3-PPE tas. Vapour pressure was calculated from mean temperature and relative humidity; net radiation was derived from latitude, day of the year, cloud cover (with 1-Total cloud lw rad=f cloudiness factor) and
15th of the month using mean monthly averages from all relevant climate variables associated with the same climate projection ensemble member to produce a monthly time PE time series for 1950 to 2098 for that member.
File format
Because of the volume of data describing Future Flows Cli-mate PE, the time series were saved in different netCDF files to increase the speed of downloading, copying, reading and manipulations. For consistency with Future Flows Climate APr, Future Flows Climate PE is saved at 1-km grid. PE datasets (corresponding to the mean monthly PE expressed in mm day−1) from each 11-ensemble member are saved sep-arately as 30-yr period. File names contain the name of the ensemble member consistently with the Hadley Centre’s no-tations (run ID) and the time period. A total of 11×5=55 files describe the entire PE dataset, of 1.25 Gb each. The en-tire time series period ranges from 1950 to 2098.
4 Limitations of Future Flows Climate
Future Flows Climate is the ensemble gridded climate data of the Future Flow and Groundwater Level project; its acronym is FF-HadRM3-PPE. It covers England, Wales and Scotland. The dataset has been developed within the project using a consistent approach nationally, hence enabling comparison of results across a range of scales and geographical regions. Future Flows Climate is derived from the eleven members of HadRM3-PPE ensemble simulations of the climate, based on the SRES emission scenarios A1B. The downscaling and bias correction procedures applied to the HadRM3-PPE were considered necessary to provide a product that is appropriate for hydrological and groundwater level simulations. How-ever, the techniques used are not physically based, and Future Flows Climate will still contain some discrepancies com-pared to “real climate”.
Future Flows Climate time series range from 1950 to 2098 and are provided at a 1-km grid resolution, which is a resolution suitable for most hydrological applications. They consist of 11 different (equally likely) plausible reali-sations of the climate over this period under the A1B emis-sion scenario. This means that they are designed to capture the natural temporal and spatial variability expected in the climate as well as possible, but they do not reproduce his-torical weather sequences. In other words, none of the Fu-ture Flows Climate time series of precipitation or tempera-ture are expected to provide, for the period 1975–1976, the same weather sequence as observed in 1975–1976. How-ever, within the longer period of 1951–2000, it is expected the main day-to-day patterns characteristic of the climate of Great Britain resemble those observed at any point. This is showed by the error associated with FF-HadRM3-PPE as in-put of rainfall-runoffmodels being within acceptable mod-elling errors (Prudhomme et al., 2012).
5 Access
Future Flows Climate dataset is associated with a digi-tal object identifier doi:10.5285/ bad1514f-119e-44a4-8e1e-442735bb9797. This must be referenced fully for every use of the Future Flows Climate data as follows:
Prudhomme C., Dadson S., Morris D., Williamson J., Goodsell G., Crooks, S., Boelee L., Davies H., Buys G., and Lafon T.: “Future Flows Climate”, doi:10.5285/ bad1514f-119e-44a4-8e1e-442735bb9797, 2012.
All Future Flows Climate files (55 files for APr, 55 files for PE) are available through the CEH Environmental In-formatics Data Centre Gateway under special licensing con-ditions (https://gateway.ceh.ac.uk/or doi:10.5285/ bad1514f-119e-44a4-8e1e-442735bb9797).
6 Conditions of use
Future Flows Climate is available under licensing condition agreement. For non-commercial use, the product is available free of charge. For commercial use, the data might be made available conditioned to a fee to be agreed upon with CEH licensing team, owner of the IPR of the datasets and products.
Acknowledgements. Future Flows Climate has been generated under the partnership project “Future Flows and Groundwater Levels, SC090016” jointly funded by the Environment Agency for England and Wales, the UK Department for Environment, Food and Rural Affairs, the UK Water Industry Research, the Natural Environment Research Centre (CEH and BGS) and Wallingford HydroSolutions. They are all gratefully acknowledged.
Edited by: N. Verhoest
References
Allen, R. G., Pereira, L. S., Raes, D., and Smith, M.: FAO irrigation and drainage paper 56 – Crop evapotranspiration – Guidelines for computing crop water requirements, Food and Agriculture Organisation of the United Nations, Rome, 300 pp., 1998. Bell, V. A. and Moore, R. J.: An elevation-dependent snowmelt
model for upland Britain, Hydrol. Process., 13, 1887–1903, 1999.
Charlton, M. B. and Arnell, N. W.: Adapting to climate change im-pacts on water resources in England – An assessment of draft Water Resources Management Plans, Global Environ. Change, 21, 238–248, doi:10.1016/j.gloenvcha.2010.07.012, 2011. Diaz-Nieto, J. and Wilby, R. L.: A comparison of statistical
down-scaling and climate change factor methods: Impacts on low flows in the River Thames, United Kingdom, Clim. Change, 69, 245– 268, 2005.
Kay, A. L. and Jones, D. A.: Transient changes in flood frequency and timing in Britain under potential projections of climate change, Int. J. Climatol., 32, 489–502, doi:10.1002/joc.2288, 10.1002/joc.2288, 2010.
Kay, A. L., Davies, H. N., Bell, V. A., and Jones, R. G.: Comparison of uncertainty sources for climate change im-pacts: flood frequency in England, Clim. Change, 92, 41–63, doi:10.1007/s10584-008-9471-4, 2009.
Keller, V., Young, A. R., Morris, D., and Davies, H.: Continuous Estimation of River Flows (CERF) Technical Report: Estima-tion of PrecipitaEstima-tion Inputs, Centre for Ecology and Hydrology, Wallingford, 2006.
Leander, R. and Buishand, T. A.: Resampling of regional climate model output for the simulation of extreme river flows, J. Hy-drol., 332, 487–496, 2007.
Ledbetter, R., Prudhomme, C., and Arnell, N.: A method for incorporating climate variability in climate change impact assessments: Sensitivity of river flows in the Eden catch-ment to precipitation scenarios, Clim. Change, 113, 803–823, doi:10.1007/s10584-011-0386-0, 2011.
Limbrick, K. J., Whitehead, P. G., Butterfield, D., and Reynard, N.: Assessing the potential impacts of various climate change sce-narios on the hydrological regime of the River Kennet at Theale, Berkshire, south-central England, UK: an application and evalu-ation of the new semi-distributed model, INCA, Sci. Total Envi-ron., 251–252, 539–555, 2000.
Lopez, A., Fung, F., New, M., Watts, G., Weston, A., and Wilby, R. L.: From climate model ensembles to climate change impacts and adaptation: A case study of water resource management in the southwest of England, Water Resour. Res., 45, W08419, doi:10.1029/2008wr007499, 2009.
Morris, D.: Derivation of water available from precipitation, CEH, Wallingford, 17 pp., 2012.
Morris, D. G. and Flavin, R. W.: A digital terrain model for hy-drology, Proceedings 4th international symposium on spatial data handling, Zurich (CH), 250–262, 1990.
Murphy, J. M., Booth, B. B. B., Collins, M., Harris, G. R., Sex-ton, D. M. H., and Webb, M. J.: A methodology for proba-bilistic predictions of regional climate change from perturbed physics ensembles, Philos. T. R. Soc. A, 365, 1993–2028, doi:10.1098/rsta.2007.2077, 2007.
Murphy, J. M., Sexton, D. M. H., Jenkins, G. J., Booth, B. B. B., Brown, C. C., Clark, R. T., Collins, M., Harris, G. R., Kendon, E. J., Betts, R. A., Brown, S. J., Humphrey, K. A., McCarthy, M. P., McDonald, R. E., Stephens, A., Wallace, C., Warren, R., Wilby, R., and Wood, R. A.: UK Climate Projections Science Report: Climate Change Projections, Met Office Hadley Centre, Exeter, UK, 190 pp., 2009.
Nawaz, N. R. and Adeloye, A. J.: Monte Carlo Assessment of Sampling Uncertainty of Climate Change Impacts on Water Re-sources Yield in Yorkshire, England, Clim. Change, 78, 257–292, 2006.
Newton, G., Dadson, S. J., Lafon, T., and Prudhomme, C.: Scop-ing study for precipitation downscalScop-ing and bias-correction – Science report/Project Note SC090016/PN3, CEH Wallingford, Wallingford, 41 pp., 2012.
Perry, M., Hollis, D., and Elms, M.: The generation of daily gridded datasets of temperature and rainfall for the UK, National Climate Information Centre, Met Office, Exeter, 7 pp., 2009.
Piani, C., Haerter, J. O., and Coppola, E.: Statistical bias correction for daily precipitation in regional climate models over Europe, Theor. Appl. Climatol., 99, 187–192, 2010.
Prudhomme, C. and Davies, H.: Assessing uncertainties in climate change impact analyses on the river flow regimes in the UK. Part 2: future climate, Clim. Change, 93, 197–222, 2009.
Prudhomme, C., Wilby, L. R., Crooks, S. M., Kay, A. L., and Rey-nard, N. S.: Scenario-neutral approach to climate change impact studies: application to flood risk, J. Hydrol., 390, 198–209, 2010. Prudhomme, C., Crooks, S., Jackson C., Kelvin, J., and Young, A.: Final Technical Report. Science Report/Project Note – SC090016/PN9, CEH, BGS, WHS, EA, UKWIR, 116 pp., 2012. Shuttleworth, W. J.: Evaporation, in: Handbook of hydrology, edited
by: Maidment, D. R., McGraw-Hill, Inc, 4.1–4.53, 1993. Wilby, R. L. and Harris, I.: A framework for assessing