R E S E A R C H
Open Access
Integrated analysis of genome-wide DNA
methylation, gene expression and protein
expression profiles in molecular subtypes
of WHO II-IV gliomas
Zhi-Liang Wang
1†, Chuan-Bao Zhang
2†, Jin-Quan Cai
3, Qing-Bin Li
3, Zheng Wang
2and Tao Jiang
1,2,4,5*Abstract
Background:Glioma is the most common malignant primary brain tumor among adults, among which glioblastoma (GBM) exhibits the highest malignancy. Despite current standard chemoradiation, glioma is still invariably fatal. A further insight into the molecular background of glioma is required to improve patient outcomes.
Method:Previous studies evaluated molecular genetic differences through comparing different grades of glioma. Here, we integrated DNA methylation, RNA sequencing and protein expression data sets of WHO grade II to IV gliomas, to screen for dysregulated genes in subtypes during malignant progression of glioma.
Results:We propose a list of universal genes (UG) as novel glioma biomarkers: 977 up-regulated genes and 114 down-regulated genes, who involved in cell cycle, Wnt receptor signaling pathway and fatty acid metabolic process. Poorer survival was associated significantly with the high expression of 977 up-regulated genes and low expression of 114 down-regulated in UG (P<0.001).
Conclusion:To our knowledge, this was the first study that focused on subtypes to detect dysregulated genes that could contribute to malignant progression. Furthermore, the differentially expressed genes profile may lead to the identification of new therapeutic targets for glioma patients.
Keywords:Glioma, Subtype, Progression, Prognosis
Introduction
Glioma is the most common malignant primary brain tumor among adults [1, 2]. The tumors are graded on a WHO consensus-derived scale of I to IV according to their degree of malignancy, as judged by various histo-logical features [3, 4]. Astrocytic tumors, which are the most common group of human gliomas, have an inherent tendency for recurrence and malignant progression, and usually cannot be cured by neurosurgical resection, radio-therapy and/or chemoradio-therapy [5]. Regardless of treatment strategy, the majority of patients of low grade gliomas undergo recurrence or malignant transformation over
time, and most patients eventually succumb to the disease. The 5-year progression rate of low grade gliomas was between 50 and 70 %, and malignancy-free survival rate of low grade gliomas was between 30 and 70 % [6, 7]. Relative survival estimates for glioblastoma are quite low. Only 5.0 % of patients survived five years after diagnosis [8]. Despite recent advances in cancer diagnosis and treatment, these statistics have not changed significantly. GBM still remains one of the most challenging cancers in clinical oncology [9].
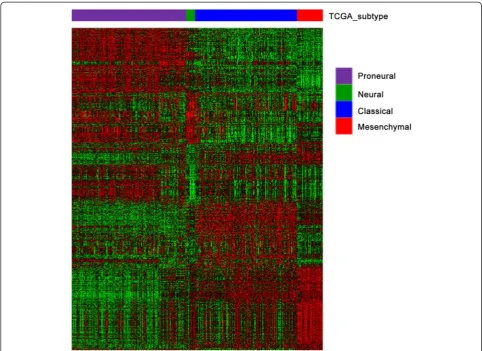
Therefore, it is essential to investigate the mechanism involved in the development and progression of glioma. The Cancer Genome Atlas (TCGA) described a robust gene expression-based molecular classification of GBM into Proneural, Neural, Classical and Mesenchymal sub-types [10]. After that, TCGA indicated the existence of a glioma-CpG island methylator phenotype (CIMP).
G-* Correspondence:[email protected] †Equal contributors
1Department of Neurosurgery, Beijing Tiantan Hospital, Capital Medical
University, No.6 TiantanXili, Dongcheng District, Beijing 100050, China
2Beijing Neurosurgical Institute, Capital Medical University, Beijing, China
Full list of author information is available at the end of the article
CIMP tumors, a subgroup of Proneural subtype, were more prevalent among lower-grade gliomas, displayed distinct copy-number alteration and were tightly associated with IDH1 somatic mutations [11]. IDH1 mutation, somatic mutation in isocitrate dehydrogenase 1 gene, occurs at high frequency in gliomas and seems to be a prognostic factor in glioblastoma patients [12–14]. Patients with G-CIMP tumors were younger at the time of diagnosis and had sig-nificantly improved outcome [15]. The GBM phenotype is ultimately a product of a set of processes, each prone to selective pressure and dysregulation in cancer. Selective pressure is accepted as a driving force behind cancer-associated remodelling of the genome, epigenome and proteome.
Previous studies evaluated molecular genetic differences through comparing different grades of glioma [16–18]. But the differences might be due to the different expres-sion subtype, whose composition varied among grades. Here, we integrated DNA methylation, RNA sequencing and protein expression data sets of WHO grade II to IV glioma, to screen for dysregulated genes in subtypes dur-ing malignant progression. We found genes that could act universally in all subtypes of gliomas. Such an integrative approach is crucial for the identification of promising targets and the correponding therapies.
Material & methods Patients and samples
High throughput data (DNA methylation, RNA sequencing and protein expression), molecular pathological data (IDH mutation) and clinical characteristics of astrocytic glioma patients (astrocytoma (A), anaplastic astrocytoma (AA) and glioblastoma multiforme (GBM)) were downloaded from The Cancer Genome Atlas (TCGA, http://cancergen-ome.nih.gov/). There were 195 samples in the methylation data; 340 samples in the RNAseq data and 149 samples in the protein expression data. The RNA sequencing data were log2 transformed before the following analysis.
TCGA subtype annotation
TCGA subtypes were classified according to the Proneural-Neural-Classical-Mesenchymal classes using the signatures published in Verhaak et al. and single sample Gene Set Enrichment Analysis algorithm (ssGSEA) Glioma-CpG island methylator phenotype (G-CIMP) tumors were defined as IDH mutated proneural ones. The gliomas were classified into five different subtypes: G-CIMP-positive (IDH-mutated) proneural, G-CIMP-negative (IDH-wild-type) proneural, classical, mesenchymal and neural tumors.
Differential analysis/Data mining
Significance analysis of microarrays (SAM) was applied to identify differentially methylated or expressed genes
between two groups [19]. Because of the limited gene count in protein expression, thettest was used to deter-mine differences in each two group comparison.
Functional annotation
Gene Ontology (GO) analysis of differentially expressed genes was performed in DAVID (http://david.abcc.n-cifcrf.gov/). Gene Set Enrichment Analysis (GSEA) was used to further validate the functional enrichment of those genes [20].
Statistical analysis
Kaplan–Meier survival analysis was used to estimate the survival distributions, and the log-rank test was used to assess the statistical significance between stratified survival groups.
Result
Subtype annotation
292 RNAseq data from TCGA samples (A, AA, GBM) were downloaded and were classified according to TCGA subtype signatures published by Verhaaket al. [21]. The proneural samples were futher classifed into G-CIMP-positive (IDH-mutated) proneural and G-CIMP-negative (IDH-wild-type) proneural accoding to IDH1/2 mutation status (Fig. 1). Because the limited number of neural and mesenchymal samples did not meet the threshold for statitical analysis, we focused on classical, IDH-mutated proneural and IDH-wild-type proneural subtypes in the following analysis. The sample size was listed in Table 1.
Genes universally contribute to malignant progression in three subtypes
We analyzed DNA methylation data and RNAseq data to find out differentially expressed genes that could universally contribute to malignant progression in three subtype. We used SAM to filter the high throughput data. Those genes were supposed to meet these following criteria: 1) dif-ferentially methylated and expressed between A and AA in three subtype (FDR < 0.05); 2) differentially methyl-ated and expressed between A and GBM in three subtype (FDR < 0.05); 3) there was a negative correlation between its methylation and expression (Pearson’s correlation p value <0.05,r< 0).
The 1091 differentially expressed genes, containing 977 up-regulated and 114 down-regulated, were called universal genes (UG). Of the 172 genes with protein expression data, 9 genes (BRAF, RAF1, PDK1, BAK1, CCNE2, FN1, GATA3, IGFBP2, CCNB1) were differently expressed in protein level.
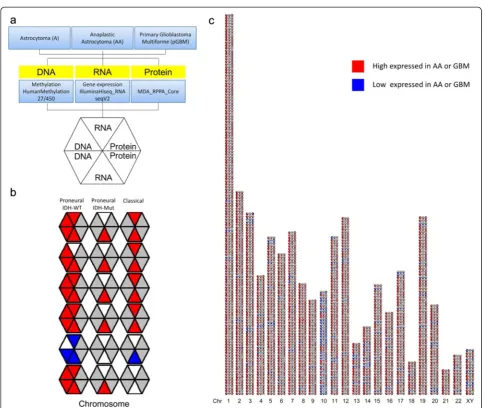
The data were incorporated into a symmetrically divided hexagon, with color-encoded values for AA in the top quadrants and with corresponding values for the GBM in the bottom sections, as depicted in Fig. 2a. By this
arrangement, the top and bottom halves of the hexagon represent mirror images of the DNA, RNA and protein measures for the AA and GBM, respectively.
In order to facilitate the recognition and visualization of genetically linked trends across tumours and grafts, an omic map was assembled in which 3273 hexagons (1091 genes × 3 subtypes) were assembled into an array by ordering horizontally according to 3 subtypes, and as a linear genetic map in the vertical direction (Fig. 2b and c).
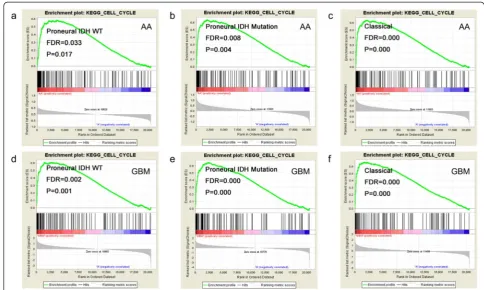
Gene Ontology analysis was performed by DAVID to infer the function of the differentially expressed genes. One hundred twenty-four up-regulated genes were enriched (P< 0.05 and FDR < 0.05) in cell cycle (Table 2). GSEA further validated the cell cycle association of the up-regulated genes in every subtype (Fig. 3). The down-regulated genes were enriched in Wnt receptor signaling pathway and fatty acid metabolic process.
Prognostic validation of universal genes in TCGA and external dataset
We examined prognostic value of UG on survival. The 1091 genes whose expression more strongly correlated with grade from TCGA database were used as markers to cluster 511 TCGA GBM samples for kmeans cluster-ing (k= 2) [22, 23]. The prognosis of patients in group2 (highly expressed in up-regulated UG) (median: 386 days) was poorer than those in group1 (highly expressed in down-regulated UG) patients (median: 447 days, p= 0.0095) (Fig. 5a).
Next, we employed 310 glioma samples from the Chinese Glioma Genome Atlas (CGGA, http:// www.cgga.org.cn/)
Table 1Molecular pathology features of DNA methylation, RNAseq and protein expression samples
Database DNA methylation RNAseq Protein expression
Histology A AA GBM A AA GBM A AA GBM
Total Number 20 35 112 48 96 151 22 47 58
Proneural IDH (+) 2 2 10 11 21 9 2 3 4
Proneural IDH (-) 13 12 16 23 35 16 13 24 10
Classical 3 18 86 8 36 89 4 18 44
Mesenchymal 0 3 0 1 4 30 0 1 0
Neural 2 0 0 3 2 7 3 1 0
to validate the association between universal genes and overall survival using Kaplan–Meier survival curve (Fig. 4).
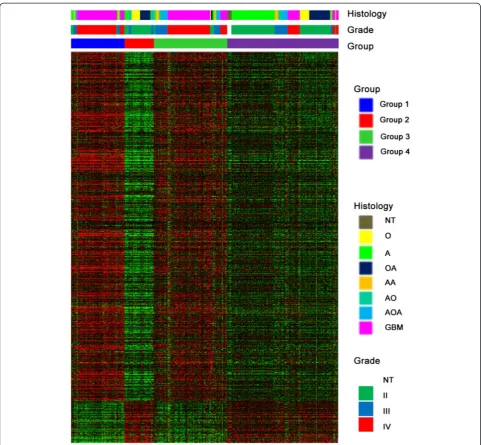
The up-regulated UG were highly expressed in group 1 and 3, while down-regulated UG were highly expressed in group 2 and 4. There was a significant difference among the four groups. The OS was short in group1 (median: 447 days) and group 3 (median follow-up: 439 days). The median OS was un-reached in group 2 and group 4. Patients with high expression up-regulated UG indicated a significantly poor survival than those with high expression down-regulated UG (p< 0.0001) (Fig. 5b). Up-regulated UG expressed higher in Group1 than group3, and down-regulated UG expressed higher
Fig. 2An integrated omic platform for the characterization of glioma patients in three subtypes.aA, AA and GBM were quantified for DNA methylation, RNAseq and protein expression. Data for each primary GBM and AA, relative to A, were color-encoded as indicated and integrated into six-sided polygons in a symmetrical manner, with AA data in the top three quadrants, and data from the GBM in the mirror-image bottom sections.bThe polygons were assembled as a linear genetic map in the vertical direction, which organized by chromosome and by three subtypes in the horizontal direction: IDH-wild-type (IDH-WT) Proneural, IDH-mutated (IDH-Mut) Proneural, Classical.cBy this approach 1091 data points were integrated into 3273 polygons. These reflected correlated changes in one or more of the linked genes across the set of individual AA and GBM. Red, high expression; Blue, low expression; White, not significant difference; Grey, data not available
Table 2Top four GO terms of the 43 genes
GO term Biological process Gene count p-value
GO:0007067 mitosis 34 1.44E-07
GO:0000280 nuclear division 34 1.44E-07
GO:0000087 M phase of mitotic cell cycle 34 2.21E-07
GO:0000279 M phase 43 3.11E-07
GOgene ontology
in group 2 than group 4 (Fig. 4). The results was concord-ant with the trend of survival curves, where the prognosis of these patients in group3 and group 2 were better than those in group1 and group4, respectively (Fig. 5b). How-ever, the differences did not reach statistical significance. GBM (WHO grade IV) patients were mainly enriched in group1 and group2, while group2 and group4 showed highly association with oligodendroglioma (WHO grade II) and astrocytoma (WHO grade II).
To further confirm the result, we clustered the GBM samples in CGGA database by differentially expressed genes. The GBM samples were separated into 2 groups. High expression down-regulated UG also showed a better prognosis in patients (p= 0.0365) (Fig. 5c).
Discussion
It is clear that GBM represents a heterogeneous type of neoplasm when considering its molecular and genetic features [24]. The integration of comprehensive data sets spanning the sequence to phenotype continuum DNA-RNA-protein-disease covered molecular signatures linking cancer progression and overall survival in glioma. Gliomas have been analyzed by several groups with the use of vari-ous types of large-scale methods. Low-grade astrocytomas (WHO grade 2), which account for approximately 35 % of
human astrocytic tumors, generally affect young people with a mean age of 39 years. The most common chromo-somal alteration seen in low-grade astrocytoma is the deletion of chromosome band 17p13.1 and mutations of the tumor suppressor gene p53 (TP53), which reside in this region [25]. Unlike low-grade astrocytomas, anaplastic astrocytomas are more cellular, have increased cellular atypia and have increased cellular proliferation [26]. The genetic changes associate with the transition from low-grade to anaplastic astrocytoma included allelic loss of chromosome arms 9p, 11p, 13q and 19q. Many of the alterations observe in anaplastic astrocytomas genes that regulate cell cycle progression. For example, alterations of the retinoblastoma (Rb) gene map to 13q14 occur in 40 % of anaplastic patients [18]. Glioblastomas are the most malignant astrocytic tumor. In addition to cellular atypia, increased mitotic index and infiltrative growth into adjacent normal brain, glioblastomas show intratumoral necrosis and vascular endothelial proliferation. Amplification of the EGFR locus is found in approximately 40 % of primary glioblastomas [27]. Mutations of the PTEN gene are found in 45 % of primary glioblastomas. Mutations of PTEN lead to constitutive activation of the phosphoti-dylinositol-3, 4, 5 triphosphate pathway; one member of this family is Akt. The mechanism of function and
the role of PTEN in gliomagenesis have been widely studied [28].
These molecular genetic studied of gliomas detected mo-lecular abnormalities through comparing different grades. However, we supposed that the molecular abnormalities distributed also associated significantly with subtypes. Here, we presented a particular study which focused on the same subtype in different grades to find out differen-tially expressed genes during malignant progression of glioma. Through this approach we discovered 1091 UG (977 up-regulated genes and 114 down-regulated genes) in DNA methylation and RNA sequencing data. The function of UG were mainly about cell cycle progression. Thus, that
might be a good explanation for why patients with high expressed UG had a poor prognosis.
Because of the limitation of protein expression database, we discovered the UG mainly by analyze DNA methylation and RNA sequencing. After combining genes in protein expression database, only 9 up-regulated UG were left: BRAF, RAF1, PDK1, BAK1, CCNE2, FN1, GATA3, IGFBP2, CCNB1. There were six genes exhibited same tendency in A to AA and A to pGBM. The BRAF, RAF1, PDK1 had a lower protein expression in AA and GBM while BAK1, CCNE2, GATA3 had a higher protein expression. These data indicate that generally protein abundance may not be a simple relationship of DNA and mRNA levels, may reflect
Fig. 4K-means clustering identified four groups of 310 CGGA samples by UG. K-means clustering identified of 310 CGGA samples by 1091 genes whose expression most strongly correlated with grade from TCGA database fork= 4
proteome remodelling in response to selective pressure for an aspect of the tumor phenotype that is manifest at the protein level.
We summarized 71 prognostic genes signature from previously papers [29–34]. The overlap of UG signature and previously genes signature were 19 genes. Most of the previously genes signature were based on high grade gliomas. In this paper, we integrated DNA methylation, RNA sequencing and protein expression data sets of WHO grade II to IV glioma, to screen for dysregulated genes, which were more accurate. There were 124 UG genes enriched (P< 0.05 and FDR < 0.05) in cell cycle. CCNB1, one of the UG genes, which is a protein essen-tial for cell cycle progression through the G2/M phase. CCNB1 was reported as a novel therapeutic approach against many tumors [35–37] and may become novel therapeutic target for glioma.
Conclusion
In summary, our study has provided a better understanding of tumor heterogeneity and disease progression in GBM. We show that up-regulated UG are a crucial factor for ma-lignant progression and poor prognosis in glioma patients and modulate the cell cycle, and that down-regulation of UG predict a better outcomes in patients. To our know-ledge, this is the first study that focus on subtypes to detect dysregulated genes that can contribute to malignant pro-gression. Furthermore, the differentially expressed genes profile may lead to the identification of new therapeutic tar-gets for glioma patients. Although the therapeutic oppor-tunities for glioma remain limited, continuing efforts to detail the mechanisms of disease relapse would contribute to our ability to provide curative treatment for this lethal disease.
Competing interests
The authors declare that they have no competing interests
Authors’contributions
ZLW and CBZ made substantial contributions to conception, design and wrote the manuscript. JQC, QBL and ZW gave suggestion on study design, discussed and interpreted the data. TJ designed and supervised study. All authors read and approved the final manuscript.
Acknowledgements
We thank Yuling Yang for tissue sample collection and clinical data retrieval. This work was supported by the following grants: 1. The Research Special Fund For Public Welfare Industry of Heath (No. 201402008); 2. National High Technology Research and Development Program (No.2012AA02A508); 3. National Natural Science Foundation of China (No. 91229121); 4. Beijing Science and Technology Plan (No. Z131100006113018); 5. National Key Technology Research and Development Program of the Ministry of Science and Technology of China (No. 2013BAI09B03, 2014BAI04B02); 6. National Natural Science Foundation of China (No. 81201993), Specialized Research Fund for the Doctoral Program of Higher Education of China (No. 20121107120005).
Author details
1Department of Neurosurgery, Beijing Tiantan Hospital, Capital Medical
University, No.6 TiantanXili, Dongcheng District, Beijing 100050, China.
2Beijing Neurosurgical Institute, Capital Medical University, Beijing, China. 3Department of Neurosurgery, The Second Affiliated Hospital of Harbin
Medical University, Harbin, China.4Beijing Institute for Brain Disorders Brain
Tumor Center, Beijing, China.5China National Clinical Research Center for
Neurological Diseases, Beijing, China.
Received: 26 August 2015 Accepted: 20 October 2015
References
1. Condamine T, Gabrilovich DI. Molecular mechanisms regulating myeloid-derived suppressor cell differentiation and function. Trends Immunol. 2011;32(1):19–25. doi:10.1016/j.it.2010.10.002.
2. Wang Z, Bao Z, Yan W, You G, Wang Y, Li X, et al. Isocitrate dehydrogenase 1 (IDH1) mutation-specific microRNA signature predicts favorable prognosis in glioblastoma patients with IDH1 wild type. J Exp Clin Cancer Res. 2013;32:59. doi:10.1186/1756-9966-32-59.
3. Louis DN, Ohgaki H, Wiestler OD, Cavenee WK, Burger PC, Jouvet A, et al. The 2007 WHO classification of tumours of the central nervous system. Acta Neuropathol. 2007;114(2):97–109. doi:10.1007/s00401-007-0243-4. 4. Cai J, Yang P, Zhang C, Zhang W, Liu Y, Bao Z, et al. ATRX mRNA expression
combined with IDH1/2 mutational status and Ki-67 expression refines the molecular classification of astrocytic tumors: evidence from the whole transcriptome sequencing of 169 samples samples. Oncotarget. 2014;15(9):2551–61.
5. Reifenberger G, Collins VP. Pathology and molecular genetics of astrocytic gliomas. J Mol Med. 2004;82(10):656–70. doi:10.1007/s00109-004-0564-x.
Fig. 5Kaplan-Meier estimated of survival for 511 TCGA and 310 CGGA samples.aAmong 511 TCGA GBM samples, there was a significant difference in survival between two groups (p= 0.0095) (b) Among 310 CGGA samples, there was a significant difference in survival between four groups (p< 0.0001).
6. Chaichana KL, McGirt MJ, Laterra J, Olivi A, Quinones-Hinojosa A. Recurrence and malignant degeneration after resection of adult hemispheric low-grade gliomas. J Neurosurg. 2010;112(1):10–7. doi:10.3171/2008.10.JNS08608. 7. Grier JT, Batchelor T. Low-grade gliomas in adults. Oncologist. 2006;11(6):681–93.
doi:10.1634/theoncologist.11-6-681.
8. Ostrom QT, Gittleman H, Liao P, Rouse C, Chen Y, Dowling J, et al. CBTRUS statistical report: primary brain and central nervous system tumors diagnosed in the United States in 2007-2011. Neuro Oncol. 2014;16 Suppl 4:iv1–63. doi:10.1093/neuonc/nou223.
9. Simon R. Roadmap for developing and validating therapeutically relevant genomic classifiers. J Clin Oncol. 2005;23(29):7332–41. doi:10.1200/ JCO.2005.02.8712.
10. Verhaak RG, Hoadley KA, Purdom E, Wang V, Qi Y, Wilkerson MD, et al. Integrated genomic analysis identifies clinically relevant subtypes of glioblastoma characterized by abnormalities in PDGFRA, IDH1, EGFR, and NF1. Cancer Cell. 2010;17(1):98–110. doi:10.1016/j.ccr.2009.12.020. 11. Noushmehr H, Weisenberger DJ, Diefes K, Phillips HS, Pujara K, Berman BP,
et al. Identification of a CpG island methylator phenotype that defines a distinct subgroup of glioma. Cancer Cell. 2010;17(5):510–22. doi:10.1016/ j.ccr.2010.03.017.
12. Balss J, Meyer J, Mueller W, Korshunov A, Hartmann C, von Deimling A. Analysis of the IDH1 codon 132 mutation in brain tumors. Acta Neuropathol. 2008;116(6):597–602. doi:10.1007/s00401-008-0455-2. 13. Bleeker FE, Atai NA, Lamba S, Jonker A, Rijkeboer D, Bosch KS, et al. The
prognostic IDH1(R132) mutation is associated with reduced NADP + -dependent IDH activity in glioblastoma. Acta Neuropathol. 2010;119(4):487–94. doi:10.1007/ s00401-010-0645-6.
14. Hartmann C, Meyer J, Balss J, Capper D, Mueller W, Christians A, et al. Type and frequency of IDH1 and IDH2 mutations are related to astrocytic and oligodendroglial differentiation and age: a study of 1,010 diffuse gliomas. Acta Neuropathol. 2009;118(4):469–74. doi:10.1007/s00401-009-0561-9. 15. Baysan M, Bozdag S, Cam MC, Kotliarova S, Ahn S, Walling J, et al. G-cimp
status prediction of glioblastoma samples using mRNA expression data. PLoS One. 2012;7(11):e47839. doi:10.1371/journal.pone.0047839. 16. Brat DJ, Castellano-Sanchez A, Kaur B, Van Meir EG. Genetic and biologic
progression in astrocytomas and their relation to angiogenic dysregulation. Adv Anat Pathol. 2002;9(1):24–36.
17. Rasheed A, Herndon JE, Stenzel TT, Raetz JG, Kendelhardt J, Friedman HS, et al. Molecular markers of prognosis in astrocytic tumors. Cancer. 2002;94(10):2688–97.
18. Zhu Y, Parada LF. The molecular and genetic basis of neurological tumours. Nat Rev Cancer. 2002;2(8):616–26. doi:10.1038/nrc866.
19. Tusher VG, Tibshirani R, Chu G. Significance analysis of microarrays applied to the ionizing radiation response. Proc Natl Acad Sci. 2001;98(9):5116–21. doi:10.1073/pnas.091062498.
20. Subramanian A, Tamayo P, Mootha VK, Mukherjee S, Ebert BL, Gillette MA, et al. Gene set enrichment analysis: A knowledge-based approach for interpreting genome-wide expression profiles. Proc Natl Acad Sci. 2005;102(43):15545–50. doi:10.1073/pnas.0506580102.
21. Brennan CW, Verhaak RG, McKenna A, Campos B, Noushmehr H, Salama SR, et al. The somatic genomic landscape of glioblastoma. Cell.
2013;155(2):462–77. doi:10.1016/j.cell.2013.09.034.
22. Monti S, Tamayo P, Mesirov J, Golub T. Consensus clustering: a resampling-based method for class discovery and visualization of gene expression microarray data. Mach Learn. 2003;52(1-2):91–118.
23. Colman H, Zhang L, Sulman EP, McDonald JM, Shooshtari NL, Rivera A, et al. A multigene predictor of outcome in glioblastoma. Neuro Oncol. 2010;12(1):49–57. doi:10.1093/neuonc/nop007.
24. Gao K-M, Chen X-c, Zhang J-x, Wang Y, Yan W, You Y-P. A pseudogene-signature in glioma predicts survival. J Exp Clin Cancer Res. 2015;34(1):23. doi:10.1186/ s13046-015-0137-6.
25. Achatz MI, Hainaut P, Ashton-Prolla P. Highly prevalent TP53 mutation predisposing to many cancers in the Brazilian population: a case for newborn screening? Lancet Oncol. 2009;10(9):920–5. doi:10.1016/ S1470-2045(09)70089-0.
26. Louis DN, Pomeroy SL, Cairncross JG. Focus on central nervous system neoplasia. Cancer Cell. 2002;1(2):125–8.
27. Collins VP. Cellular mechanisms targeted during astrocytoma progression. Cancer Lett. 2002;188(1-2):1–7.
28. Knobbe CB, Merlo A, Reifenberger G. Pten signaling in gliomas. Neuro Oncol. 2002;4(3):196–211.
29. Lin Y, Jiang T, Zhou K, Xu L, Chen B, Li G, et al. Plasma IGFBP-2 levels predict clinical outcomes of patients with high-grade gliomas. Neuro Oncol. 2009;11(5):468–76. doi:10.1215/15228517-2008-114.
30. Pitroda SP, Zhou T, Sweis RF, Filippo M, Labay E, Beckett MA, et al. Tumor endothelial inflammation predicts clinical outcome in diverse human cancers. PLoS One. 2012;7(10):e46104. doi:10.1371/journal.pone.0046104. 31. Arimappamagan A, Somasundaram K, Thennarasu K, Peddagangannagari S,
Srinivasan H, Shailaja BC, et al. A fourteen gene GBM prognostic signature identifies association of immune response pathway and mesenchymal subtype with high risk group. PLoS One. 2013;8(4):e62042. doi:10.1371/ journal.pone.0062042.
32. Kim YW, Koul D, Kim SH, Lucio-Eterovic AK, Freire PR, Yao J, et al. Identification of prognostic gene signatures of glioblastoma: a study based on TCGA data analysis. Neuro Oncol. 2013;15(7):829–39. doi:10.1093/neuonc/not024. 33. Weller M, Wick W. Neuro-oncology in 2013: improving outcome in newly
diagnosed malignant glioma. Nat Rev Neurol. 2014;10(2):68–70. doi:10.1038/ nrneurol.2013.268.
34. Van Meir EG, Hadjipanayis CG, Norden AD, Shu HK, Wen PY, Olson JJ. Exciting new advances in neuro-oncology: the avenue to a cure for malignant glioma. CA Cancer J Clin. 2010;60(3):166–93. doi:10.3322/caac.20069.
35. Begnami MD, Fregnani JH, Nonogaki S, Soares FA. Evaluation of cell cycle protein expression in gastric cancer: cyclin B1 expression and its prognostic implication. Hum Pathol. 2010;41(8):1120–7. doi:10.1016/
j.humpath.2010.01.007.
36. Zhou L, Li J, Zhao YP, Cui QC, Zhou WX, Guo JC, et al. The prognostic value of Cyclin B1 in pancreatic cancer. Med Oncol. 2014;31(9):107. doi:10.1007/ s12032-014-0107-4.
37. Santala S, Talvensaari-Mattila A, Soini Y, Santala M. Prognostic value of cyclin B in endometrial endometrioid adenocarcinoma. Tumour Biol.
2015;36(2):953–7. doi:10.1007/s13277-014-2676-4.
Submit your next manuscript to BioMed Central and take full advantage of:
• Convenient online submission
• Thorough peer review
• No space constraints or color figure charges
• Immediate publication on acceptance
• Inclusion in PubMed, CAS, Scopus and Google Scholar
• Research which is freely available for redistribution
Submit your manuscript at www.biomedcentral.com/submit