EEG Based Biometric Identification Using
Correlation and MLPNN Models
https://doi.org/10.3991/ijoe.v15i10.10880
T. Waili (*), Md Gapar Md Johar
Management and Science University, Selangor, Malaysia [email protected]
K.A. Sidek, N. S. H. Mohd Nor, H. Yaacob, M. Othman Islamic University Malaysia, Kuala Lumpur, Malaysia
Abstract—This study investigates the capability of electroencephalogram (EEG) signals to be used for biometric identification. In the context of bio-metric, recently, researchers have been focusing more on biomedical signals to substitute the biometric modalities that are being used nowadays as the signals obtained from our bodies is considered more secure and privacy-compliant. The EEG signals of 6 subjects were collected where the subjects were required to undergo two baseline experiments which are, eyes open (EO) and eyes closed (EC). The signals were processed using a 2nd order Butterworth filter to elimi-nate the unwanted noise in the signals. Then, Daubechies (db8) wavelet was ap-plied to the signals in the feature extraction stage and from there, Power Spec-tral Density (PSD) of alpha and beta waves was computed. Finally, the correla-tion model and Multilayer Perceptron Neural Network (MLPNN) was applied to classify the EEG signals of each subject. Correlation model has yielded great significant difference of coefficient between autocorrelation and cross-correlation where it gives the coefficient value of 1 for autocross-correlation and the coefficient value of less than 0.35 for cross-correlation. On the other hand, the MLPNN model gives an accuracy of 75.8% and 71.5% for classification during EO and EC baseline condition respectively. Therefore, these results support the usability of EEG signals in biometric recognition.
Keywords—Biometric, EEG, Correlation and MLPNN
1
Introduction
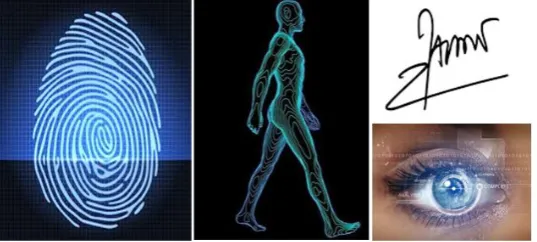
screening, commercial and government applications. For instance, fingerprint, signa-ture, gait and iris as shown in Figure 1 are amongst the several biometric modalities that have been suggested for the past few years. Nevertheless, not all biometrics do not offer satisfactory recognition rates [1]. Fingerprints, for example, can be faked or can be obtained by force whereas the most unique biometric which is deoxyribonucle-ic acid (DNA) is easily contaminated and not really accepted by the society since it can gives information about susceptibilities of a person to certain diseases. Besides that, some individual may not possess these biometric attributes due to mishap or disabilities. Hence, the use of EEG signals in biometric recognition has spark interest of researchers in this area because of the ability to give excellent results as this signal is much closer to human brain which controls our actions and reactions.
Fig. 1. Different types of biometric modalities
EEG is defined as an alternating type electrical activity which was obtained by the metal electrodes assigned on human’s scalp [2]. Like other biometric attributes, EEG signals also provide related information concerning individual dissimilarities related to brain anatomical and functional traits [3]. Due to distinctness of each brain configu-rations, it is presumed that each individual has their own brain patterns. This signal is considered more safe and privacy-compliant than traditional biometric identifiers. Furthermore, EEG based biometric systems offer open access to everyone including people with certain physical abilities such as missing fingers or absence of the iris. Therefore, the purpose of this study is to propose an EEG based biometric recognition system and to assess the performance of the proposed system.
2
Literature Review
EEG signal produced by each and every activity was divided into 20 segments of 0.5 second to acquire a greater dataset. Next, AR modeling was used to extract features from the data and the author used Burg’s method to determine the AR coefficient. The results of the experiment show that all subjects gave optimum outcome in rejecting imposters which means that the False Acceptance Error (FAE) is zero for each mental activity whereas for the False Rejection Error (FRE), the fifth subject gave 1.5% and 0.75% for baseline and mathematical calculation while the first subject gave 1.0% for letter composing activity. Visual counting and geometric figure rotation were con-cluded to be the best mental activities because of the fact that the FAE and FRE val-ues for these two activities are zero. However, this method is considered cumbersome and inconvenient for everyone since visual stimulus is a must for this approach.
Brigham and Kumar [5] claimed that a person can be identified from EEG signals that were obtained during imagined speech. The authors used imagined speech EEG data collected from six volunteers at University of California, Irvine (UCI). These volunteers were required to imagine pronouncing one of the two syllables which are
/ba/ or /ku/, at varying rhythms covertly while their EEG signals were being comput-ed. The rhythms of the syllables are heard to subjects beforehand through a set of electrostatic earphones. Several assumptions were then made in addition to the ap-plied AR model to the EEG signals. This was done to determine the power spectral density of the signal before SVM classifier was used for the classification of volun-teers. The linear SVM classifier gives the most accurate identification result with an average classification rate of 99.41% for the imagined speech dataset. Besides that, the classification process was also done on each rhythm as well as each syllable indi-vidually. Although the identification accuracies for rhythms and syllables are slightly smaller than that of imagined speech dataset, these outcomes suggest that the pro-posed method is suitable for biometric identification. However, these imagined speech characteristics could fluctuate in every experiment which results in uncertainty of information for any kind of classification.
state-ment that the movestate-ment-related EEG helps in identifying the subjects, the author believed that the use of β rhythm gives better results for this method.
Thomas and Vinod [7] found that beta band entropy conveys most of the particular information related to subjects during resting state. The authors conducted experi-ments using EEG signals of 109 healthy subjects which were collected from a public-ly available online database called PhysioNet BCI. Two different baseline conditions which are one-minute EC and one-minute EO were used as the dataset. The study used two operating phases: enrolment and identification for the recognition system. During enrolment, sample entropy based features were obtained from five sub-bands of EEG known as delta (1-4 Hz), theta (4-8Hz), alpha (8-12 Hz), beta (12-30 Hz) and gamma (30-50 Hz) to generate template and were stored in the database. Based on Mahalanobis distance based classifier, subject identification was carried out by ex-tracting sample entropy features from multi-band decomposed multi-channel EEG data. The average correct recognition rate (CRR) which is the performance index used for the proposed recognition system shows that, in both EO and EC, beta band gave better identification level than the other four bands where it provides an average CRR of 98.31% in the validation procedure. However, this approach does not give an opti-mum recognition performance since it uses higher number of EEG channels.
Harshit et al. [8] proposed an online based EEG biometric recognition system that uses both visual and audio stimuli for five subjects. All subjects are right-handed and free from any serious medical conditions. Offline experiment is first conducted to determine the correlation threshold of various stimuli (self, familiar and unfamiliar) for both cases. The visual session is conducted for 10 seconds for each single trial which consist of 10 self-face images, 10 familiar faces images and 10 unfamiliar faces images in random order. For the audio session, subjects were required to hear self, familiar and unfamiliar voices from the same phrase for eight trials in each stimulus. Based on experimental results, it is observed that the amplitude of EEG signal in re-sponse to self-face stimuli is higher as compared to familiar and unfamiliar faces for all subjects. On the other hand, the amplitude of EEG signal in response to self-voice is lower than familiar voice and higher than unfamiliar voice. EEG signals are then recorded during online experiment and the feature vectors consist of Power Spectral Density (PSD) values were compared with the template obtained from the offline experiment. The false acceptance rate (FAR) and false rejection rate (FRR) were then computed which gives the average FAR of 13.91% and average FRR of 26.66% while the recognition accuracy was recorded to be 79.73%. Even though the results obtained were quite satisfying, the proposed approach needs to be tested in a greater population over an extended duration. Furthermore, this approach is not applicable for people with disabilities such as blind and deaf.
multiscale wavelet packet statistics (WPS) and multiscale wavelet packet energy sta-tistics (WPES) were applied to the signals. Lastly, the SVM classifier with the applied error-correcting output code multiclass model (ECOC) was used for the classification process. In this study, only the results obtained from EC task were presented and based on the experimentation, the WPS and WPES methods performed better identifi-cation as compared to the MSD method. These two methods gave the highest accura-cy of 94.44% on channel-3 and channel-5 for WPS and on channel-5 for WPES. De-spite the satisfying results produced by WPS and WPES methods, it is believed that there are other potential methods that could give better results which were not ana-lyzed in this study.
3
Methodology
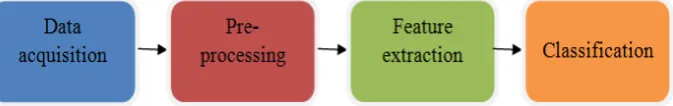
The general design of the proposed system starts with EEG signals collection and followed by pre-processing of the signals. Next, alpha and beta sub-bands were ex-tracted using the proposed feature extraction technique and from there, PSD of the two sub-bands were computed. Finally, classification of the signals were performed using correlation and MLPNN models. Figure 2 encapsulates the overall architecture of the proposed system. The next sub-sections will briefly describe about each steps of the proposed system.
Fig. 2. Overall design of the proposed system
3.1 Data acquisition
Fig. 3. Architecture of devices used for data acquisition [4].
3.2 Feature extraction
In order to characterize the EEG signals into five sub-bands as mentioned earlier, db8 wavelet function was applied to the filtered signals. The db8 wavelet decomposes EEG signals into multi-level details with respect to the range of frequencies of each sub-band [10]. Additionally, only signals obtained from electrodes C3, C4 and CZ will be used in this study. This is because, previous works done by neurologists show that, EEG recordings from these three electrodes consist of particularly any brain activities related to imaginary motor movement including movement of the eyes [11]. Besides that, these three electrodes contain two sub-bands which coincide with the brain activity of a normal adult during conscious state that are alpha and beta waves. Thus, EEG signals from the remaining 16 electrodes as well as delta, theta and gam-ma waves will not be further analyzed in this study because the gam-main focus is to ana-lyzed signals containing alpha and beta waves.
Subsequently, the PSD of alpha and beta waves were computed using Welch’s method or also known as periodogram averaging method. Equation 1 depicts the equation of periodogram values to obtain Welch’s estimate of the PSD.
𝑆"(𝑣) =('∑(+,'𝑃+(𝑣) (1)
where the parameter S refers to the number of points to shift between segments, pa-rameter K defines the number of segments or batches and parameter P is the modified periodogram value [12].
3.3 Classification
3.4 Correlation model
Correlation is a method where two signals are required to produce a third signal. If a signal is associated with itself, the third signal is called the autocorrelation, other-wise it is called the cross correlation of the two input signals. Equation 2 shows the cross correlation function used in this classification step
𝐶(𝑛, τ) = ∑ x(t)y(n, t + τ)6 (2)
Where x(t)and y(t)denote the PSD of the first and second set of EEG signals at time t and channel n, respectively. Moreover, τ denotes the time lag between the two signals [8].
The association of two variables is stronger as the coefficient value approaching to
± 1. On the other hand, a correlation coefficient of 0 signifies that there is no associa-tion exists between the measured variables. The correlaassocia-tion coefficients are catego-rized into three categories for both positive and negative correlations which are low or weak correlation (≤ 0.35), moderate correlation (0.36 – 0.67) and high or strong cor-relation (0.68 – 1.0) [9].
3.5 MLPNN model
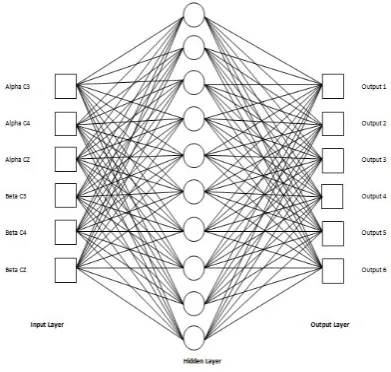
MLPNN is one of the types of neural networks with error based training mecha-nism used to classify EEG signals. The multilayer perceptron composes of a system of simple interrelated neurons or nodes. Figure 4 illustrates the architecture of a three-layer MLPNN used for EEG classification. In this study, the multithree-layer perceptron requires six output nodes where one node is representing one subject. That being said, six binary vectors were assigned as the target output vector where bit 1 indicates the correct classification and bit 0 specifies the incorrect classification.
4
Experimentation and Results
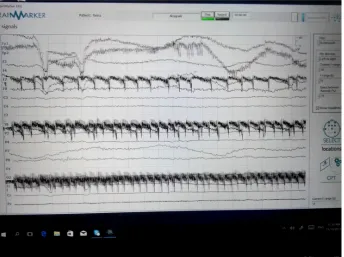
In this study, a total of six subjects were required to undergo two baseline condi-tions which are EO and EC. Subjects were placed in a dim light room and they were asked to be in a calm condition before the recording process started. During EO con-dition, subjects were instructed to minimize eye blinking to reduce noise and artifacts in the signals. The EEG signals of each subject were recorded for one minute in each condition using a 19-channel electrode cap and the signals obtained were displayed through a laptop as shown in Figure 5.
Fig. 5. Recorded EEG signals
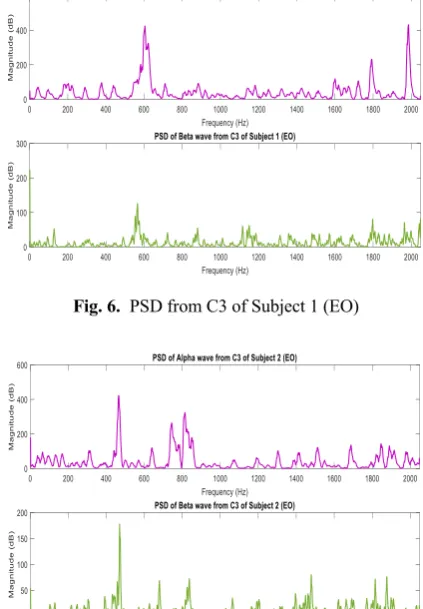
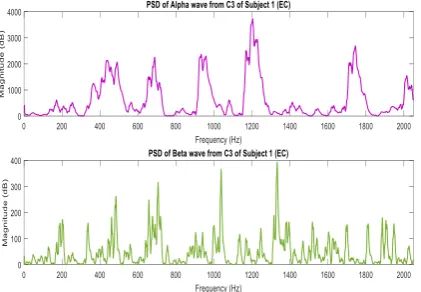
The raw signals were then pre-processed using 2nd order Butterworth filter with a band pass of 0.01 to remove noise in the signals. After that, the filtered signals from electrodes C3, C4 and CZ were further analyzed to discriminate alpha and beta waves of each subject where the PSD for these two waves were computed afterwards. For illustration purposes, only the EEG signals from electrode C3 of three subjects are shown which are categorized into EO and EC.
Fig. 6. PSD from C3 of Subject 1 (EO)
Fig. 7. PSD from C3 of Subject 2 (EO)
Fig. 9. PSD from C3 of Subject 1 (EC)
Fig. 10.PSD from C3 of Subject 2 (EC)
Finally, correlation model was applied to the extracted features as the first classifi-cation method. For documentation purpose, only correlation coefficient values from electrode C3 are depicted which are categorized into EO and EC. The correlation coefficients of PSD values for electrode C3 during EO baseline condition are provid-ed in Table 1 for alpha wave and Table 2 for beta wave. As for EC baseline condition, the correlation coefficients of PSD values for electrode C3 are organized in Table 3 and Table 4.
Table 1. Correlation coefficient of PSD of alpha wave from C3 during EO
Alpha EO-C3
0 S1 S2 S3 S4 S5 S6
S1 1 -0.07 -0.1486 -0.0499 -0.0864 -0.0225
S2 -0.07 1 0.2784 0.0241 -0.0314 0.0579
S3 -0.1486 0.2784 1 0.0279 -0.1309 0.0978
S4 -0.0499 0.0241 0.0279 1 0.2516 -0.1316
S5 -0.0864 -0.0314 -0.1309 0.2516 1 0.0789
S6 -0.0225 0.0579 0.0978 -0.1316 0.0789 1
Table 2. Correlation coefficient of PSD of beta wave from C3 during EO
Beta EO-C3
S1 S2 S3 S4 S5 S6
S1 1 -0.0344 -0.0472 0.01 -0.0231 0.1029
S2 -0.0344 1 -0.0376 0.0442 0.1082 0.0106
S3 -0.0472 -0.0376 1 -0.0363 0.0188 -0.0221
S4 0.01 0.0442 -0.0363 1 0.0404 -0.0842
S5 -0.0231 0.1082 0.0188 0.0404 1 -0.0041
S6 0.1029 0.0106 -0.0221 -0.0842 -0.0041 1
Table 3. Correlation coefficient of PSD of alpha wave from C3 during EC
Alpha EC-C3
S1 S2 S3 S4 S5 S6
S1 1 0.0048 0.1123 0.0198 0.1311 -0.118
S2 0.0048 1 -0.2049 0.1129 -0.0714 -0.1473
S3 0.1123 -0.2049 1 0.0093 -0.0621 0.1403
S4 0.0198 0.1129 0.0093 1 0.0704 -0.0142
S5 0.1311 -0.0714 -0.0621 0.0704 1 0.0069
S6 -0.118 -0.1473 0.1403 -0.0142 0.0069 1
Table 4. Correlation coefficient of PSD of beta wave from C3 during EC
Beta EC-C3
S1 S2 S3 S4 S5 S6
S1 1 -0.0387 0.0054 0.044 0.018 -0.1134
S2 -0.0387 1 0.1453 -0.0897 -0.1342 0.2838
S3 0.0054 0.1453 1 -0.0814 0.0027 0.0298
S4 0.044 -0.0897 -0.0814 1 -0.0505 -0.0637
S5 0.018 -0.1342 0.0027 -0.0505 1 0.0864
As for the MLPNN model, the performance of the system was measured by the to-tal percentage of correct and incorrect classification as shown in Table 5.
Table 5. Percentage of correct and incorrect classification of MLPNN system
Baseline condition Percentage of correct classification Percentage of incorrect classification
EO 75.8% 24.2%
EC 71.5% 28.5%
Based on the correlation coefficients tabulated in Tables 1 to 4, it is deduced that for signals correlated with their own signals, the coefficient value is 1 for all six sub-jects. Whereas, for signals that correlated with other subjects’ signals, the coefficients obtained are less than 0.35 which falls under the category of weak correlation. These indicate that correlation method is capable of classifying the EEG signals of different subjects with a significant difference between autocorrelation and cross correlation.
Meanwhile, based on the result in Table 4.5, it shows that MLPNN has the ability to match the EEG signals of individuals in this experiment. However, the percentage of incorrect classification for both conditions is probably due to the utilization of EEG electrode cap to record the EEG signals in this experiment. This is because, the posi-tion of electrodes on subjects’ scalps does not exactly match the 10-20 system interna-tional standard of electrode location for EEG signal recording as humans have differ-ent sizes of head. Besides that, the algorithm used during feature extraction might be unsuitable and could also contribute to the percentage of incorrect classification.
To summarize, both correlation and MLPNN models have the potential to classify EEG signals of every individuals. However, both methods have several limitations. For the first classification method, even though correlation model yields a very signif-icant difference of coefficient between autocorrelation and cross correlation, it cannot give an exact value of the method’s accuracy as this method only measures the degree to which two signals are correlated. As for the MLPNN model, despite its capability to impart the correct and incorrect classification percentage, the percentage for correct classification is not very satisfying.
5
Conclusion
6
Acknowledgement
I would like to express my deepest gratitude and appreciation towards Management and Science University Malaysia for the financial support.
7
References
[1]M. A. M. Ali and N. M. Tahir, “Cancelable biometrics technique for iris recognition,” 2018 IEEE Symposium on Computer Applications & Industrial Electronics (ISCAIE), 2018. https://doi.org/10.1109/iscaie.2018.8405512
[2]Jain, A. K., Ross, A., & Prabhakar, S. “An introduction to biometric recognition”, IEEE Transactions on circuits and systems for video technology, 14(1), pp. 4-20, 2004. https://doi.org/10.1109/tcsvt.2003.818349
[3]Teplan, M., “Fundamentals of EEG measurement”. Measurement science review, 2(2), pp. 1-11, 2002.
[4]La Rocca, D., Campisi, P., Vegso, B., Cserti, P., Kozmann, G., Babiloni, F., & Fallani, F. D. V., “Human brain distinctiveness based on EEG spectral coherence connectivity”, IEEE Transactions on Biomedical Engineering, 61(9), pp. 2406-2412, 2014.
https://doi.org/10.1109/tbme.2014.2317881
[5] Palaniappan, R., “Two-stage biometric authentication method using thought activity brain waves”, International Journal of Neural Systems,18(01), pp. 59-66, 2008.
https://doi.org/10.1142/s0129065708001373
[6]Brigham, K., & Kumar, B. V., “Subject identification from electroencephalogram (EEG) signals during imagined speech”, In Biometrics: Theory Applications and Systems (BTAS), 2010 Fourth IEEE International Conference on, pp. 1-8, 2010. https://doi.org/10.1109/btas.2010.5634515
[7]Kostílek, M., & Št'astný, J., “EEG biometric identification: repeatability and influence of movement-related EEG”, In Applied Electronics (AE), 2012 International Conference on, pp. 147-150, 2012.
[8]Thomas, K. P., & Vinod, A. P., “Biometric identification of persons using sample entropy features of EEG during rest state”, In Systems, Man, and Cybernetics (SMC), 2016 IEEE International Conference on, pp. 003487-003492, 2016.
https://doi.org/10.1109/smc.2016.7844773
[9]Harshit, R. S., Thomas, K. P., Smitha, K. G., & Vinod, A. P., “Online Electroencephalo-gram (EEG) based biometric authentication using visual and audio stimuli”, In Biomedical Engineering and Sciences (IECBES), 2016 IEEE EMBS Conference on, pp. 454-459, 2016. https://doi.org/10.1109/iecbes.2016.7843492
[10]Bashar, M. K., Chiaki, I., & Yoshida, H., “Human identification from brain EEG signals using advanced machine learning method EEG-based biometrics”, In Biomedical Engi-neering and Sciences (IECBES), 2016 IEEE EMBS Conference on, pp. 475-479, 2016. https://doi.org/10.1109/iecbes.2016.7843496
[11]Sherwani, F., Shanta, S., Ibrahim, B. S. K. K., & Huq, M. S., “Wavelet based feature ex-traction for classification of motor imagery signals”, In Biomedical Engineering and Sci-ences (IECBES), 2016 IEEE EMBS Conference on, pp. 360-364, 2016. https://doi.org/10.1109/iecbes.2016.7843474
[13]Solomon Jr, O. M., “PSD computations using Welch's method”, NASA STI/Recon, Tech-nical Report N, p. 92, 1991.
[14]Smith, S. W., “The scientist and engineer's guide to digital signal processing”, California Technical Publishing, 1999.
8
Authors
T. Waili is with Faculty of Information Sciences and Engineering, Management and Science University, Shah Alam, Selangor, Malaysia. [email protected]
Md Gapar Md Johar is with Faculty of Information Sciences and Engineering, Management and Science University, Shah Alam, Selangor, Malaysia
K.A. Sidek is with faculty Department of Electrical and Computer Engineering, Kulliyyah of Engineering, International Islamic University Malaysia, Kuala Lumpur, Malaysia
N. S. H. Mohd Nor is with faculty Department of Electrical and Computer
Engi-neering, Kulliyyah of EngiEngi-neering, International Islamic University Malaysia, Kuala Lumpur, Malaysia
H. Yaacob is with faculty in Kulliyyah of Information and Communication
Tech-nology, International Islamic University Malaysia, Kuala Lumpur, Malaysia
M. Othman is with faculty in Kulliyyah of Information and Communication
Tech-nology, International Islamic University Malaysia, Kuala Lumpur, Malaysia
![Fig. 3. Architecture of devices used for data acquisition [4].](https://thumb-us.123doks.com/thumbv2/123dok_us/559710.2055294/6.595.200.400.150.294/fig-architecture-devices-used-data-acquisition.webp)