Analysis of the decrease of center pivot sprinkling system
uniformity and its impact on maize yield
Li Lianhao
1,2*,
Zhang Xinyue
3,
Qiao Xiaodong
4,
Liu Guiming
4 (1. College of Mechanical and Electronic Engineering, Henan Agricultural University, Zhengzhou 450002, China;2. Collaborative Innovation Center of Biomass Energy, Zhengzhou 450002, China; 3. College of Engineering, Heilongjiang Bayi Agricultural University, Daqing 163319, China;
4. Chinese Academy of Agricultural Mechanization Sciences, Beijing 100083, China)
Abstract: Early studies showed that the irregular operations of the center pivot sprinkling system would decrease its uniformity while the reason was lack of discussion. Taking Herman-Hein uniformity coefficient (CUH) and Distribution uniformity
coefficient (DU) as evaluation indicators, the reason that irregular operation management and configurations can decrease the uniformity of center pivot sprinkling irrigation was discussed and the impact on maize yield was tested. The reasons for such decrease in uniformity include: (1) With the increase of moving speed, the effect of sprinkling overlaying became worse, which resulted in the lower uniformity of sprinkling irrigation; (2) With the increase of head pressure, the inlet pressure could be adjusted to the same pressure by pressure regulator, which kept the uniformity of sprinkling irrigation constant; (3) When end gun worked abnormally, total head pressure decreased, which led to the decrease of sprinkling irrigation’s uniformity; (4) When pressure regulator worked abnormally, the water flow was subject to great pressure loss, which could decrease the uniformity of sprinkling irrigation; (5) When pressure regulator was uninstalled, significant abnormality of sprinkling irrigation depth occurred, resulting in the decreasing of sprinkling irrigation’s uniformity; (6) Different types of nozzles could produce different uniformity of sprinkling irrigation, which was due to different structures of micro-nozzles; (7) Due to lower uniformity, at the seedling stage of maize, both height and seedling emergence rate decreased. Final yield decreased by 18.35%. This study is important to the proper use and the improvement of configuration selection and field management of center pivot sprinkling system.
Keywords: center-pivot sprinkling system, uniformity, maize, yield
DOI: 10.3965/j.ijabe.20160904.1129
Citation: Li L H, Zhang X Y, Qiao X D, Liu G M. Analysis of the decrease of center pivot sprinkling system uniformity and its impact on maize yield. Int J Agric & Biol Eng, 2016; 9(4): 108-119.
1 Introduction
Irrigation system with center-pivot sprinkling system,
Received date: 2014-03-05 Accepted date: 2015-11-02
Biographies:Zhang Xinyue, PhD, Research interest: agricultural machine, Email: [email protected]; Qiao Xiaodong, PhD. Research interest: agricultural machine, Emial: 182890557@ qq.com; Liu Guiming, Master. Research interest: agricultural machine, Email: [email protected].
*Corresponding author: Li Lianhao, PhD, Research interest: intelligent agricultural machine and water-saving theory and technology. Mailing address: College of Mechanical and Electronic Engineering, Henan Agricultural University, No.63, Nongye Road, Jinshui District, Zhengzhou, 450002, China. Tel: 086-13783608652, Email: [email protected].
intensification of water resource shortage, the extension of farming and animal husbandry scale and the increase of labor price in China, the usage of center-pivot sprinkling system is showing rapid growth trend year after year.
Uniformity of sprinkling irrigation in field is one of the important technical and economic indicators for center pivot sprinkling system[2], which directly affects the irrigation effect and yield. The uniformity of sprinkling irrigation of the center-pivot sprinkling system is influenced by factors such as operation parameters (moving speed, head pressure, etc.) and configurations (type of micro nozzles, installed or uninstalled pressure regulator, specification of pressure regulator and on/off of end gun, etc.).
At present, there are only a few reports of field test discussed the irrigation uniformity of center-pivot sprinkling system in the world. Guo et al.[3] researched
the calculation method of irrigation intension and uniformity of center-pivot sprinkling systems in the 1980s; Lan et al.[4], Jin et al.[5] and Yan et al.[6] conducted
the research on the nozzle configuration method of center-pivot sprinkling system. Ascough et al.[7] conducted the research of calculation method of evaluating the uniformity of water irrigation distribution by using Herman-Hein uniformity coefficient (CUH).
There are only several dissertations published on academic journals such as ASABE written by Perry et al.[8], Dukes et al.[9], etc. that discussed the uniformity of center-pivot sprinkling systems, and they all focused on the influence of wind speed. And there are hardly any reports that researched the influence of irregular operation and irregular configuration on sprinkling uniformity of center pivot sprinkling system by field test, which contribute to the increase of crop yield.
Based on above consideration, we took operating management parameters and configuration as the influence factors of center pivot system’s sprinkling uniformity and took Herman-Hein uniformity coefficient (CUH) and distribution uniformity coefficient (DU) as the
evaluation indicators to conduct a systematic experimental research by field test and discuss the impact on the maize production. The research results will
provide a technical guidance to improve effect and reasonable application of the center-pivot sprinkling systems.
2 Materials and methods
2.1 Experiment method
2.1.1 Uniformity
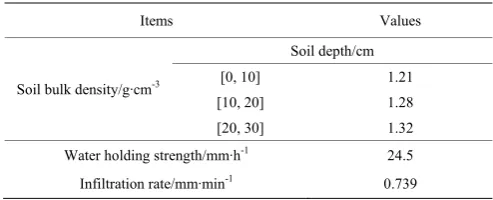
The experiment was carried out on Green Grassland Pasture of General administration of Land Reclamation of Heilongjiang Province in Oct. 21-29, 2013. The soil type was black clay. The physical properties of soil were test on 28th, Sep., 2013 and are shown in Table 1.
Table 1 Soil physical properties of experimental site
Items Values
Soil bulk density/g·cm-3
Soil depth/cm
[0, 10] 1.21
[10, 20] 1.28
[20, 30] 1.32
Water holding strength/mm·h-1 24.5
Infiltration rate/mm·min-1 0.739
2.1.2 Impact on maize production
The maize production test was carried out in Green Grassland Pasture of General administration of Land Reclamation of Heilongjiang Province from May to October in 2014. The test field was fan-shaped distributed in 24 areas. Each test area was 1.2 hm2 and repeated twice. The maize variety was King Kong 35. Seeded in May 8th and sampled in 16-20, October. We randomly selected 2 row of maize (5 m each row) in each test area to measure the number of plants and spikes and estimate the yield. The amount of nitrogen fertilizer was 230 kg(NH4SO3)/hm2, phosphate and potash were 80 kg
P2O5/hm2 and 150 kg(K2CO3)/hm2. To verify the above
conclusions and simplify the test, the test selected micro-nozzle D3000 and R3000 (Nelson Company, USA) as the main dripping device.
2.2 Equipment
2.3 Arrangement of rain gauge
The shelf of rain gauge was fanned out in the center of center support, and the top-end of the shelf was 60- 70 cm above the ground. The distance between the last two rain gauges of every two adjacent lines was 50 m, and the distance of two neighboring rain gauge was 3 m. The rain gauges were put on the shelves vertically to avoid the route of span tower carriage[10].
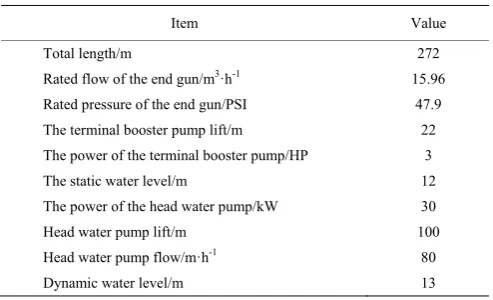
Table 2 Basic parameters of center-pivot sprinkling system for test
Item Value
Total length/m 272
Rated flow of the end gun/m3·h-1 15.96
Rated pressure of the end gun/PSI 47.9
The terminal booster pump lift/m 22
The power of the terminal booster pump/HP 3
The static water level/m 12
The power of the head water pump/kW 30
Head water pump lift/m 100
Head water pump flow/m·h-1 80
Dynamic water level/m 13
2.4 Determination of wind speed
The cup-type anemorumbometer was used to measure wind speed during the test, which was set within 200 m from the test place, and with altitude 2 m from the ground[11]. The test was conducted when the wind speed was under 0.3 m/s.
2.5 Evaluating index
2.5.1 Calculation method of uniformity (1) Herman-Hein uniformity coefficient (CUH)
CUH is the ratio of the sum of the absolute value of
difference between every water depth and average water depth of all observation points to the average value of all water depths, which can better display the condition of the water distribution and the average deviation in all fields [12]. CUH is calculated with Equation (1):
1 1 1 100% n i i i UH n i i i
h h r C h r = = ⎛ − ⎞ ⎜ ⎟ = − × ⎜ ⎟ ⎝ ⎠
∑
∑
(1)where, CUH is Herman-Hein uniformity coefficient, %; n is the total amount of rain gauges used for data analysis;
i is ordinal number of rain gauges used for data analysis;
i=1 when the adopted rain gauges were closest to the center pivot and i=n when the adopted rain gauges were furthest away from the center pivot; hi is the sprinkling
irrigation water depth of the rain gauge, mm; ri is the
distance between the rain gauge and the center support, m;
h is the average sprinkling irrigation water depth of rain gauges, mm.
(2) Distribution uniformity coefficient (DU)
DU is the field test ratio of the average water depth of
partial measure points to the total average water depth. It emphasizes on the water volume of lower water depth, which is helpful to ensure the crops getting necessarily minimum sprinkling irrigation water volume[13]. DU is
calculated with Equation (2):
100% lq U ave d D D
= × (2)
where, DU is distribution uniformity coefficient, %; dlq is
the weighted average of sprinkling irrigation water depth for the water depths of rain gauges among the first n/4 ranked from small to large, mm; Dave is the weighted
average of the sprinkling irrigation water depth of all the rain gauges that are adopted data analysis, mm. (Notes: n
refer to the number of the rain gauges that is adopted for data analysis; the weight (i) is the ordinal number of the rain gauges that are adopted for data analysis. When the adopted rain gauge is closest to center support, i=1 and when the adopted rain gauge which is the furthest away from the center pivot, i=n. The distance of water depth of rain gauge which is 10% of the total length of center-pivot sprinkling system away from the center support can be ignored during data analysis process. Beyond the system length (distance) or 75% off the range of end gun spray can be ignored as well[14]).
2.5.2 Impact on maize production (1) The rate of maize germination
Germination rate directly influence the maize yield which is determined by raditional method after seeding 7-10 d. The rate of maize germination was calculated with Equation (3):
100% S T E E E
= ×
(3)
where, E is the rate of maize emergence, %; ES is the
actually sprouting number of maize within 5 m2; E
T is the
theoretically sprouting number of maize within 5 m2. (2) The height of maize
observation value with raditional method when the leaf maize seedling was 7 d.
(3) Production rate
To further discuss the influence of the abnormal configuration and management of sprinkling irrigation on the maize yield, we introduced the production rate [15]. It can be expressed by the Equation (4):
100%
P
Y y y
Y
−
= × (4)
where, yP is production rate, %; Y is maize yield of pipe
irrigation under the same condition of water and fertilizer, kg/ha; y is actual yield under various processes, kg/hm2.
3 Results and discussion
The following section discussed reasons for impacts of center pivot sprinkling system's irregular operation management and irregular configurations on uniformity of sprinkling irrigation by field test.
3.1 Moving speed
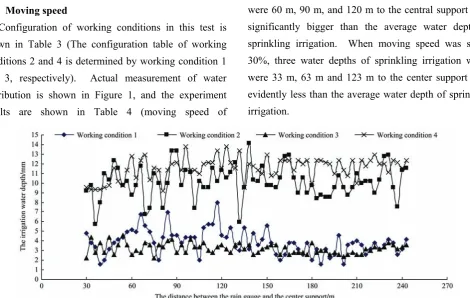
Configuration of working conditions in this test is shown in Table 3 (The configuration table of working conditions 2 and 4 is determined by working condition 1 and 3, respectively). Actual measurement of water distribution is shown in Figure 1, and the experiment results are shown in Table 4 (moving speed of
center-pivot sprinkling system was set by its percentage timer).
Table 3 Working conditions on influence of moving speed
Working condition Moving speed/% Nozzle type
1 100 D3000
2 30 D3000
3 100 R3000
4 30 R3000
Notes: Head pressure was 1.6 bar, pressure regulator was 15 PSI and end gun was off.
Table 4 Test results of influence of moving speed
Working condition CUH/% DU/% Compared with Working condition
1 ↓12.91 ↓10.5 2
3 ↓6.35 ↓2.39 4
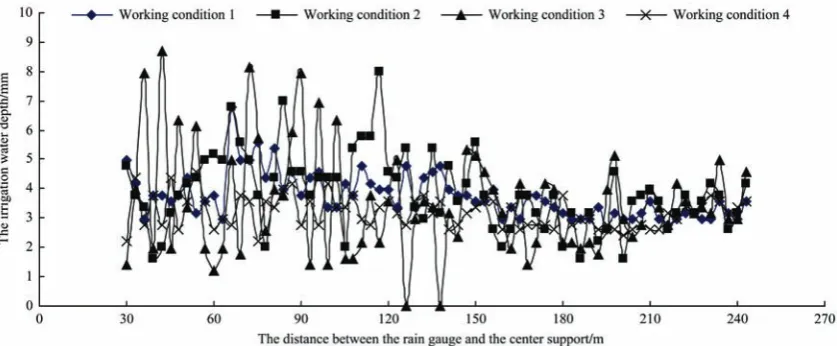
From Figure 1, we can find that when moving speed was set to 100% and 30% with D3000, the water depth of sprinkling irrigation floated around the average value along the cantilever. When moving speed was set to 100%, three water depths of sprinkling irrigation which were 60 m, 90 m, and 120 m to the central support were significantly bigger than the average water depth of sprinkling irrigation. When moving speed was set to 30%, three water depths of sprinkling irrigation which were 33 m, 63 m and 123 m to the center support were evidently less than the average water depth of sprinkling irrigation.
Figure 1 Distribution of water under different moving speed
The reason for the above changes was mainly due to the sprayer-plate structure of D3000, which was installed with non-rotating sprayer-plate that water routes arranged evenly. When the water was sprayed to the spray-plate with certain pressure, it would be separated into all-round directions along the routes. Since there was certain
extent, the “blind zone” could not be eliminated entirely. According to the on-site observation, when the rain gauge was in a special point of waterway curve (composed by the circular motion of center pivot sprinkling system and the linear motion of water), water depth of sprinkling irrigation increased. When the rain gauge was in “blind zone”, water depth of sprinkling irrigation reduced. Therefore, the above situation happened. The rotating R3000 provided better distribution of water when moving speed was set to 100% and 30%. Figure 1 also proved the above points.
Table 4 showed that CUH declined with moving speed
increasing. When moving speed of center-pivot sprinkling system with D3000 was set to 30%, CUH
increased by 12.91% compared with that was set to 100%; when moving speed of center-pivot sprinkling system with R3000 was set to 30%, CUH increased by 6.35%
compared with that was set to 100%. This was mainly due to the fact that with the slowing down of moving speed, the overlaying effect improved, which increased
CUH.
When moving speed of the center-pivot sprinkling system with D3000 was set to 30%, DU increased by
10.5% compared with that was set to 100%. When moving speed of the center-pivot sprinkling system with R3000 was set to 30%, DU increased by 2.39% compared
with that was set to 100%. This was mainly because it's overlaying frequency increased with moving speed decreasing, which resulted in the average water depth of sprinkling irrigation of minimum N/4 (N represented the total number of valid rain gauges, in present test N=72,
the same below) rain gauges increased, and the difference with the average water depth of sprinkling irrigation of valid rain gauges reduced. Therefore, DUincreased with
moving speed decreasing.
The results of the above studies are consistent with results of Yan[16], Hills et al.[17] and Blaine[18]. So we should try to use firstly the new R3000 with the configured system in practice.
3.2 Head pressure
In this test, we selected three conditions of head pressures, i.e. 1.2 bar, 1.6 bar and 2.0 bar. Configuration of working conditions is shown in Table 5 (The configuration table of working conditions 1 and 3 was determined by working condition 2. The configuration table of working conditions 4 and 6 was determined by working condition 5). The actual measurements of water distribution are shown in Figure 2 and test results are shown in Table 6.
Table 5 Working conditions on influence of head pressures
Working condition Head pressure/ bar Nozzle type
1 1.2 D3000
2 1.6 D3000
3 2.0 D3000
4 1.2 R3000
5 1.6 R3000
6 2.0 R3000
Notes: Moving speed was 100%, pressure regulator was 15 PSI and end gun was off.
Table 6 Test results of influence of head pressures
Working condition CUH/% DU/% Compared with working condition
2 ↓0.05 ↑0.18
1
3 ↑0.17 ↑3.27
5 ↓0.01 ↓3.57
4
6 ↓0.24 ↓2.8
According to Figure 2, the vast majority of water distribution floated around the average value among the cantilever and the reasons were the same as the analysis of 3.1.
According to Table 6, with increase of head pressure, the growth rate of CUH and DU (max 0.15%) was pretty
small compared with increasing degree of head pressure (25%), which could be considered that was caused by the factors such as the measurement tools, measurement personnel and wind, etc. So it could be considered that the uniformity remained unchanged with increase of head pressure. This was mainly due to, on one hand, the increasing pressure could be consumed by control valve, and the flow did not increase significantly. On the other hand, the inlet pressure (hose end) with different distance from center support could be adjusted to the same pressures by pressure regulator. The results of the above studies are consistent with results of Valin et al.[19] and Clarket al.[20]
3.3 Switch on/off of end gun
The test in this section was based on the consideration of the influence of improper use (end gun was turned on within the whole process) of end gun on uniformity of sprinkling irrigation. The working conditions are shown in Table 7 (The configuration table of working conditions 2 and 4 was determined by working conditions 1 and 3, respectively). The actual measurement of water distribution is shown in Figure 3. The test results are
shown in Table 8.
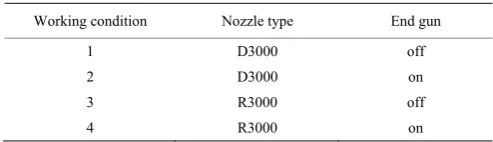
Table 7 Working conditions on influence of end gun
Working condition Nozzle type End gun
1 D3000 off
2 D3000 on
3 R3000 off
4 R3000 on
Notes: Moving speed was 100%, head pressure was 1.6 bar and pressure regulator was 15 PSI.
Table 8 Test results of influence of turning end gun on/off
Working condition CUH/% DU/% Compared with working condition
2 ↓10.27 ↓14.13 1
4 ↓20.78 ↓23.15 3
Figure 3 showed that, compared with that of the normal configuration, when turning on the end gun throughout the operating process, the numbers of abnormal value of water distribution increased from the center support to cantilever. CUH and DU decreased by
10.27% and 14.13%, 20.78% and 23.15% respectively with D3000 and R3000. This was mainly due to the water outflow from end gun, which caused gooseneck outlet pressure and flow rate rapidly decreased. In addition, this also resulted in disordered distribution of water, so CUH and DU declined. From another point of
view, under the same working conditions, CUH and DU
would decrease drastically with R3000 compared with that of D3000 which meant R3000 was more sensitive to deficiency of the pressure and flow of water than that of D3000.
Figure 3 Water distributions under the condition of on and off of end gun
In this test, we installed a frequency converter in control cabinet to maintain value of head pressure unchanging. But farmers usually would not install a
phenomenon (end gun was turned on during the whole process) should be avoided in practice.
3.4 Pressure regulator
3.4.1 Improper use of pressure regulator
Improper use of pressure regulator mainly was that pressure regulator could not work normally or other specifications (different with the configuration table) of pressure regulator were mistakenly installed.
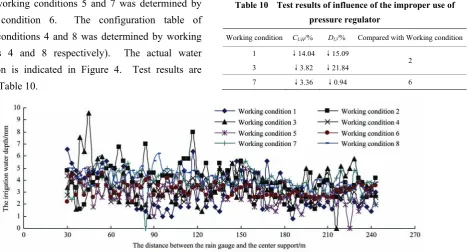
In this test, working condition is shown in Table 9 (Configuration table of working conditions 1 and 3 was determined by working condition 2. The configuration table of working conditions 5 and 7 was determined by working condition 6. The configuration table of working conditions 4 and 8 was determined by working conditions 4 and 8 respectively). The actual water distribution is indicated in Figure 4. Test results are shown in Table 10.
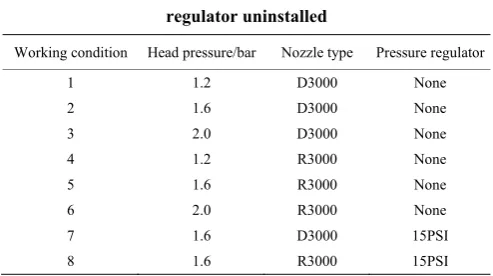
Table 9 Working conditions on influence of the improper use of pressure regulator
Working condition Head pressure/bar Nozzle type Pressure regulator
1 0.8 D3000 15PSI
2 1.6 D3000 15PSI
3 1.6 D3000 20PSI
4 1.6 D3000 20PSI
5 0.8 R3000 15PSI
6 1.6 R3000 15PSI
7 1.6 R3000 20PSI
8 1.6 R3000 20PSI
Notes: Moving speed was 100% and end gun was off.
Table 10 Test results of influence of the improper use of pressure regulator
Working condition CUH/% DU/% Compared with Working condition
1 ↓14.04 ↓15.09
2
3 ↓3.82 ↓21.84
7 ↓3.36 ↓0.94 6
Figure 4 Water distributions under improper use of pressure regulator
From Figure 4, when pressure regulator could not work normally, the amount of water distribution decreased along the cantilever, both CUH and DU
decreased by 14.04%, 15.09%, 13.37% and 15.61%, respectively with D3000 and R3000.
This was mainly because when pressure regulator could not work normally, the water flow was subject to great pressure loss when it was sprinkled to the sprinkling plate from the water pipe. One of the losses was in tube wall of branch pipe and the other one of the losses was in the water flow splitter within the pressure regulator. Therefore, the water flow pressure went down along the cantilever, and the flow decreased as well. These all resulted in the sharp decrease of CUH and DU.
From Table 10, it can be inferred that when installing the pressure regulator inconsistent with that of the
configuration table under the conditions of head pressure 1.6 bar, pressure regulator 15 PSI and D3000, CUH and DU dropped by 3.82% and 21.84% respectively with that
of the pressure regulator 20 PSI. When replaced D3000 by R3000 in the above conditions, CUH and DU dropped
by 3.36% and 0.94% respectively with that of pressure regulator 20 PSI.
measurement point. In terms of the installation of D3000 and R3000, when pressure regulator 15 PSI was changed to 20 PSI, the water flow pressure sprinkled on the sprinkling disk increased from 15 PSI to 20 PSI. Despite water pressure increased, the sprinkling effect (whether it was rotary or non-rotary micro nozzle) went down. It was mainly because only when the water pressure sprinkled on the sprinkling disk was 15 PSI, the D3000 and R3000 could achieve their best effects of sprinkling.
3.4.2 Pressure regulator uninstalled
Survey showed that a lot of farmers have not yet installed the pressure regulator in the top of douche for cost savings (generally they could save 6-15 thousand RMB for one center pivot sprinkling system). Then how this situation affects the uniformity of sprinkling irrigation was the research purpose of this section. The working condition in this section is shown in Table 11 (The configuration table of working conditions 1, 2 and 3 was determined by working condition 7. The configuration table of working conditions 4, 5 and 6 was
determined by working condition 8). The actual water distribution is shown in Figure 5. The test results are shown in Table 12.
Table 11 Working conditions on influence of pressure regulator uninstalled
Working condition Head pressure/bar Nozzle type Pressure regulator
1 1.2 D3000 None
2 1.6 D3000 None
3 2.0 D3000 None
4 1.2 R3000 None
5 1.6 R3000 None
6 2.0 R3000 None
7 1.6 D3000 15PSI
8 1.6 R3000 15PSI
Notes: Moving speed was 100% and end gun was off.
Table 12 Test results of influence of pressure regulator uninstalled on uniformity of sprinkling irrigation
Working condition CUH/% DU/% Compared with working condition
1 ↓1.22 ↓29.71
7
2 ↓1.81 ↓14.87
3 ↓6.50 ↓12.52
4 ↓9.26 ↑17.66
8
5 ↓15.00 ↓34.84
6 ↓18.09 ↑7.85
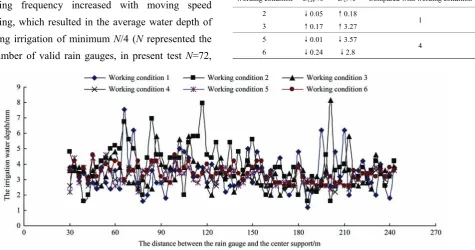
Figure 5 Water distributions with no pressure regulator
It can be seen from Figure 5 that water distribution fluctuated around the average value when pressure regulator was uninstalled. A significant abnormality of sprinkling irrigation depth occurred at the distance 159 m away from center support with D3000 and head pressure 1.6 bar.
This was mainly due to that, with the increasing of distance away from the center support, both diameter of micro-nozzle and the water pressure (over 1 bar) on the spray plate obviously increased, resulting in that the spray
radius were greater than that with pressure regulator. And the overlapping of adjacent increased so that the depths of sprinkling water irrigation obviously increased.
regulator uninstalled with the increase of water press, so that the “blind zone” of spray increased dramatically. Although the effect of atomization of water drops was better, the water drifted to the measurement point after atomization was little, almost zero. This caused the obvious increasing of abnormal points of water depths of sprinkling irrigation.
According to Table 12, with the increase of head pressure and pressure regulator uninstalled, CUH was less
than that of pressure regulator installed with R3000 and D3000. CUH declined by 1.23%, 1.82% and 6.51%
respectively with D3000 and declined by 9.26%, 15% and 18.09% with R3000 corresponding to head pressure 1.2 bar, 1.6 bar and 2.0 bar.
This was mainly because that, D3000 and R3000, the spray effect was the best when the water pressure on the tray was about 1.0 bar. When the water pressure on the tray reached 1.2 bar, the ultimate pressure tray approached 1.0 bar due to the pressure loss in the water pipes, so CUH would be reduced to the lowest.
With the gradual increase of head pressure, the pressure on each tray of the micro nozzle ultimately exceeded 1.0 bar. Thus, the reduction of CUH would
become larger. With D3000, the increasing of DUwas
less than that of the normal configuration. DU with
D3000 declined by 29.61%, 14.87% and 12.52% corresponding to head pressure 1.2 bar, 1.6 bar and 2.0 bar respectively. This was mainly because with the increase of head pressure, the spray radius of R3000 increased compared with that of normal configuration. The water amount of the minimum N/4 irrigation depths measurement point increased gradually. The difference with the average water depths of sprinkling irrigation decreased, so DU increased.
With the increasing of head pressure, DU experienced
the trend of first increased, then decreased and increased again. DU with R3000 increased by 20.05%, declined
by 29.61% and declined by 10.24% corresponding to the head press 1.2 bar, 1.6 bar and 2.0 bar respectively.
The major reason of the above changes was that R3000 was a rotary nozzle and its rotating speed increased when head pressure was set to 1.2 bar, the water pressure on the spray-plate was approaching to 1.0 bar (or slightly over 1.0 bar). It increased water
receiving possibilities of all observation points, so the water amount of the observation points in the minimum spraying depth were gradually increasing and DU
increased as well.
When head pressure was set to 1.6 bar and 2.0 bar, on one hand, the rotating speed of the spray-plate kept increasing, and on the other hand, R3000’s lowest water tube (micro sprayer R3000 had 3 tubes as upper, middle, and lower when it was spraying) above the ground would gradually enlarge its spraying radius, which resulted in the increasing of the amount of water for the observation points in the minimum spraying depth, and the growing up of the DU subsequently.
It can be summarized from the above that, under a certain head pressure, the water pressure was subject to certain loss owing to the pipe, which led to the difference of outlet pressure of gooseneck pipes along the cantilever. This would easily result in the decrease of uniformity,so the outlet pressure of gooseneck pipes needed to be regulated to the same press, which meant the pressure regulator should be equipped during the operation of the center-pivot irrigation system. The results of the above studies are consistent with results of Marjang[21].
3.5 Micro nozzle type
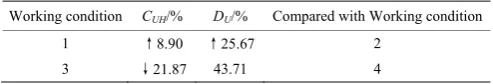
This section aimed at researching how the sprinkling uniformity of the center pivot irrigation system would be affected on different micro nozzles mistakenly installed under normal configuration. Work condition is shown in Table 13 (The configuration table of working conditions 1 and 3 was determined by working conditions 2 and 4 respectively). The distribution of measured water amount is shown in Figure 6. Test results are shown in Table 14.
Table 13 Working conditions on influence of micro nozzle type on uniformity of sprinkling irrigation
Working condition Micro-sprinkler
1 R3000 2 D3000 3 D3000 4 R3000 Notes: Moving speed was 100%, head pressure was 1.6 bar, press regulator was
15 PSI and end gun was off.
Table 14 Test results of influence of different micro nozzle
Working condition CUH/% DU/% Compared with Working condition
1 ↑8.90 ↑25.67 2
Figure 6 Distribution of water amount different micro-sprinklers
From Figure 6, we can find that except the R3000 was mistakenly substituted by D3000 (two zero-sprinkling- depth measure points), the water distribution under other working conditions was relatively uniform. This was mainly because under the working condition of R3000, compared with that of D3000, the diameter of micro-nozzle enlarged. When replacing R3000 by D3000, the radius of sprinkling shortened, so the distribution of water amount was not uniform.
Table 14 shows when D3000 was mistakenly substituted by R3000, both CUH and DU increased
compared with that with D3000. This is mainly because R3000 is a rotary nozzle and the spraying radius was larger, which led to the increase of uniformity of sprinkling irrigation. On the contrary, if R3000 was mistakenly installed to D3000, both CUH and DU reduced
compared with R3000. This was mainly because the gap with its neighboring sprinklers was widened when R3000 was installed normally, and the spraying radius of D3000 was shortened, thus the sprinkling uniformity reduced[22].
4 Impacts on maize yield
4.1 The emergence rate and the height of maize
The sprinkler uniformity of sprinkling irrigation directly influenced the emergence rate and the height of maize. Results of observation of the emergence rate and the height of maize are shown in Table 15.
From Table 15, moving speed can affect the emergence rate and maize height. When moving speed were 30% and 100%, the emergence rate decreased by
2.83% and plant height decreased by 7 cm.
Table 15 Results of observation of the emergence rate and the height of maize
Influence factors Working condition Emergence rate/% Plant height/cm
Moving speed Table 3 1 95.34 82
2 98.17 89
Head pressure Table 5 1 94.57 81
3 95.50 85
End gun Table7 2 89.72 79
Improper use of
pressure regulator Table 9
1 88.02 78
3 93.0 80
4 92.33 84
Pressure regulator
unstalled Table 11
1 67.80 69
2 72.40 71
3 73.0 72
Micro nozzle type Table 13 1 95.23 81
Under different head pressures, when head pressure was higher than designed pressure, the emergence rate and maize height were closer to those under normal configuration; when head pressure was lower than designed pressure, the emergence rate and maize height reduced more than those under normal configuration; Compared head pressure 2.0 bar with 1.2 bar, the emergence rate reduced by 0.93%, and maize height reduced by 4 cm.
The results all above indicate that the abnormal configuration and management has an influence on the seedling emergence rate and height of maize. The degree of influence varied, which need to be further studied.
4.2 Yield
The maize yield results of field test are shown in Table 16.
Table 16 Yield reduction
Influence factors Working condition y Y yp
Moving speed Table 3 1 12330
12574
↓1.94
2 12421 ↓1.19
Head pressure Table 5 1 12297 ↓2.20
3 12480 ↓0.74
End gun Table7 2 11930 ↓5.12
Improper use of
pressure regulator Table 9
1 11872 ↓5.58
3 12093 ↓3.83
4 12054 ↓4.14
Pressure regulator
uninstalled Table 11
1 10267 ↓18.35
2 10843 ↓13.77
3 11032 ↓12.26
Micro nozzle type Table 13 1 12171 ↓3.21
From Table 16, compared with traditional maize production with pipe irrigation (Y), different operation parameters and configurations of the center-pivot irrigation system could decrease the maize yield to varying degrees. The highest production reduction rate reached 18.35%, which was related with the difference of sprinkler uniformity.
5 Conclusions
In this paper, we discussed the effect of irregular operation and irregular configuration of the center-pivot irrigation system on the uniformity of sprinkler irrigation and the impact on maize yield. The conclusions are as follows:
1) Both CUH and DU decreased with the increase of
moving speed which was caused by the worse effect of sprinkling overlaying when moving speed was higher.
2) Both CUH and DU stayed the same when the head
pressure increasing since the pressure regulator kept the inlet pressure constant.
3) When the pressure regulator was uninstalled, CUH
decreased a little with D3000, while CUH decreased
greatly with R3000. Uninstalling of pressure regulator
would cause a significant reduction of DU because the
water flow of the pipe was subject to great pressure loss. 4) The irregular operation and irregular configuration of the center-pivot irrigation system could reduce maize yield.
Acknowledgements
The project was supported by the 59th Chinese
Postdoctoral Science Foundation (2016M59068) and Breeding programs of Heilongjiang Bayi Agricultural University(Grant No.XZR2014-04).
[References]
[1] Wang Y H, Lan C Y, Yi X T. Solutions of blowout on center sprinkling machine. Water-saving Irrigation, 2012; 17(3): 72–74. (in Chinese with English abstract)
[2] Yi X T, Dou Y S, Lan C Y. Configuration method and the maths model of center pivot sprinkling machine. Transactions of the CSAE, 2007; 23(2): 117–121. (in Chinese with English abstract)
[3] Guo R L, Xu B H. Uniformity and strength of Center Pivot sprinkling Machine. Sprinkling Machine, 1997; 7(3): 21–26.
[4] Lan C Y, Yi X T, Xue G N. Research state and development of sprinkler irrigation equipments in China. Drainage and Irrigation Machinery, 2005; 23(1): 1–6. (in Chinese with English abstract)
[5] Jin H Z, Yan H J, Qian Y C. Overseas development of water saving irrigation engineering technology. Transactions of the ASAME, 2010; 41 (Supp.1): 59–63. (in Chinese with English abstract)
[6] Lan C Y, Xiu Y T. Study on the discharge coefficient of nonrotatable sprays for center pivot system. Journal of Irrigation and Drainage, 2004; 23(2): 55–57. (in Chinese with English abstract)
[7] Ascough G W, Kiker G A.The effect of irrigation uniformity on irrigation water requirements. Water SA, 2002; 28(2): 235–241.
[8] Dukes M D, Perry C. Uniformity testing of variable-rate center pivot irrigation control systems. Precision Agriculture, 2006; 7(3): 205–218.
[9] Dukes M D. Effect of wind speed and pressure on linear move irrigation system uniformity. Applied Engineering in Agriculture, 2006; 22(4): 541–548.
[11] Li J, Li B, Rao M. Spatial and temporal distributions of nitrogen can crop yield as affected by non-uniformity of sprinkler fertigation. Agriculture Water Manage, 2005; 76(3): 160–180.
[12] Hussein M. Effect of maintenance on the performance of sprinkler irrigation system and irrigation water conversation. Food Science and Agricultural Research, 2006; 32(3): 5–19. [13] Kincaid D C. Application rates from center pivot irrigation
with current sprinkler types. Applied Engineering in Agriculture, 2006; 21(4): 605–610.
[14] King B A, Wall R W, Karsky. Center-pivot irrigation system for independent site-specific management of water and chemical application. Applied Engineering in Agriculture, 2009; 25(2): 187–198.
[15] Wang Y, Bai L X, Zhao J. Dynamic variations of soil moisture in field and water use efficiency of maize under sprinkler irrigation. Transactions of the CSAE, 2012; 28(Supp.1): 92–97. (in Chinese with English abstract) [16] Yan H J. Study on water distribution irrigation uniformity
of center pivot and later move irrigation system based on
variable rate technology. Doctoral dissertation, China Agricultural University, 2005; pp.59–61.
[17] David J H, Gu Y P, James W R, Wesley W. Wallender. Lateral Move Water Application Uniformity Relative to Machine Speed. Transactions of the ASAE, 1988; 31(2): 527–531.
[18] Blaine R. Evaluation of center-pivot sprinkler systems. California Agriculture, 1986; 21(3): 24–27.
[19] Valin M L, Cameira M R. A model for center-pivot design and evaluation .Computer and Electronic in Agriculture, 2012; 87(1): 159–170.
[20] Clark G A, Srinivasan. Measured and simulated uniformity of low drift nozzle sprinkler. Transactions of ASAE, 2002; 46(2): 321–330.
[21] Marjang N, Merkley G P, Shaban M. Center-pivot uniformity analysis with variable container spacing. Irrigation Science, 2012; 30(2): 146–149.