...
Inequalities in male mortality by occupational class,
perceived status and education in Russia, 1994–2006
Alexey Bessudnov
1, Martin McKee
2, David Stuckler
2,31 Faculty of Sociology and Centre for Advanced Studies, Higher School of Economics, Moscow, Russia 2 London School of Hygiene and Tropical Medicine, Department of Public Health & Policy, London, UK 3 Department of Sociology, University of Cambridge, Cambridge, UK
Correspondence:Alexey Bessudnov, Higher School of Economics, Faculty of Sociology, 3 Kochnovsky proezd, Moscow 125319 Russia, tel: +74991520361, fax: +74991520221, e-mail: [email protected].
Received 13 December 2010, accepted 12 August 2011
Background:Russia’s market reforms in the early 1990s led to marked social inequalities. We analysed inequalities in risks of
dying for Russian men by occupational class and perceived social status in the post-transition era.Methods:Cox proportional
analysis of the hazard of dying by occupational class, education, household income and perceived social status was performed
for 593 deaths that occurred between 1994 and 2006 using a representative sample of Russia’s male population (n= 6586
people, 40 046 person-years). Occupational class was coded based on the European Socio-Economic Classification; social status
was based on survey questionnaires about people’s perceived economic, power and respect status.Results:Manual occupational
class is significantly associated with greater hazards of dying among men, after adjusting for age, education and other potential confounding variables. Groups at highest risk were men who were manual workers, manual supervisors and technicians, and lower sales and service workers. Substantial gaps in life expectancy at age 21 of up to 10 years were observed between male
managers and professionals and manual workers.Conclusion:Substantial inequalities in risks of dying exist by both occupational
class and perceived status in Russia, with patterns by class differing from those in the west.
...
Introduction
R
ussia’s transition to a market economy in the early 1990s had profound implications for the health of its population. Life expectancy, lagging increasingly far behind the West since the 1960s, fell even further. The major contributors were deaths from cardiovascular disease, injuries and violence and the acute effects of alcohol among working age men, all linked to hazardous drinking.1Research in Russia and its neighbours has contributed to an understanding of the factors underlying these changes. One was a rapid increase in the supply of cheap and highly concentrated alcohol2 especially products sold as aftershaves, solvents and
medicines that, although officially not sold as beverages, were widely consumed.3 However, hazardous drinking was a coping response to social disruption, with individual studies demonstrat-ing the negative health consequences of unemployment (and fear of unemployment4), while ecological analyses identify the role of mass privatization5and resulting rapid labour turnover.6
Some Russians profited greatly from the transition. They include not only the oligarchs but also an emergent urban middle class, especially those employed in services and finance. But others fared much less well7as the Soviet-era safety nets were torn leaving many to fall through the gaps.8
Although the main drivers of rising inequalities were the radical economic policies pursued during transition, most existing research on mortality has focused on the role of education as a basis of inequality.9,10 These studies reveal large differences in mortality even in the late 1970s, with the gaps especially wide for injuries and violence and causes directly related to alcohol, such as alcoholic poisoning. These gaps widened during the mid-1990s and beyond,11,12and while life expectancy at age 30 fell among
the least educated, it increased among those with university education.13
Education is, however, only one factor and will interact with changing labour market conditions, employment status, including markers of unstable employment (such as being paid in kind and
being laid off temporarily without pay),4 and perceived social
status.14 In Russia, both low education and unemployment are strongly associated with consumption of non-beverage alcohols15 while low education, as well as not being in a relationship, are strongly associated with death from causes associated with hazardous drinking.16 This is consistent with research from
Poland and Hungary showing unmarried men faring much worse during the 1980s.17,18
The role of occupational class is relatively neglected in the research on inequalities in Russia, unlike in some western countries. Although state socialism was purportedly building a classless society, marked class and status divisions existed prior to the political transition.9,19,20 While class and status are notions commonly applied in sociological studies of inequalities and labour market stratification, they are often combined into a unidimensional construct of socio-economic status in public health studies. As invoked by sociologists, class is the relationship of an individual to the system of economic production. Status, on the other hand, is a person’s social standing, reflecting the prestige or honour conferred on them. Both class and status are hierarch-ical and are interrelated, as a person’s class can influence their status. Occupational class and status have differing effects that are distinct from income and education in political attitudes and cultural consumption (of music, arts and theatre, for example),21– 23and a recent Swedish study found that occupational status is a
strong correlate of mortality.24It is argued that these concepts can provide a more nuanced understanding of health inequalities.25
Based on the existing social science literature on winners and losers in Russia’s market reforms,7,26–31 we hypothesize that the
health of low-skilled, manual workers in Soviet factories would have suffered most during rapid market reforms, because their skills (and thereby prestige) were rendered less valuable in the changing market circumstances and they had greater risk of becoming redundant.5,32,33 However, the situation may be more complicated as workers with the highest skills may have the highest expectations of reform and more stressful experiences, reflecting a gap between their expectations and actual outcomes, whereas
European Journal of Public Health, 1–6
ß The Author 2011. Published by Oxford University Press on behalf of the European Public Health Association. All rights reserved. doi:10.1093/eurpub/ckr130
by guest on September 23, 2011
eurpub.oxfordjournals.org
managers and entrepreneurs who participated in growing areas of the economy would fare better. Thus, those who perceived themselves to have lower status in the new society would experience higher risks of poor health.
In this article, we investigate the role of class and perceived status as bases of social inequalities in Russian mortality.
Methods
We extracted data on Russian individuals from the second wave of the Russia Longitudinal Monitoring Survey (RLMS), an annual representative household panel survey, covering about 4000 households and 10 000 individuals in each round. We used data for the years 1994–2006 (except 1997 and 1999, when there was no survey). TheSupplementary Appendixdescribes the details of data collection and compares our estimates of mortality rates to those previously reported for the RLMS, finding them slightly lower than existing studies mainly because our sample includes persons who changed households.10
Occupational class was coded using the new European Socio-Economic Classification (ESeC).34,35This categorizes occupation, employment status and supervisory status into nine classes, ranging from manual routine workers (lowest) to higher managers and professionals (highest). The ESeC was recently used in a study of inequality in self-assessed health in Europe.36
To account for low numbers of self-employed farmers in Russia, we merged self-employed persons who were not in agriculture and self-employed agricultural workers into one class. Following the literature on social mobility in Russia, we split managers and professionals into three different classes (managers, higher profes-sionals and lower profesprofes-sionals).37
While an individual’s class as measured by occupation could hypothetically change during the course of transition, we were interested in class as a determinant of people’s experiences and opportunities in the course of transition, which could be obscured by allowing it to change over short periods of time (although none of our observations qualitatively changed if class is coded as time varying). Thus, each person’s class was coded based on his/her occupation at the time of the first observation. If the occupation of a person was missing in the round when he/she was first observed, we used the information from the next round. For people who were retired at the time of the first obser-vation, we used their reports of what they had been doing in 1990 and, where that was missing, what they had been doing in 1985.
The sample was limited to men aged 21–70 years. There is only a limited number of deaths of women in this age group, precluding us from estimating inequalities in female mortality reliably. Thus, women were excluded from all subsequent analyses. We also excluded men who lived in single-person households. Following this procedure, we were able to code class for 88% of men (5827 out of 6586) in our analytic sample. The remainder included people who were not employed at any point of the study (mostly long-term unemployed and sick). This missing group was included as a separate category in all the analyses.
Income was measured as household income per capita, adjusted for inflation at the level of 1994 with the official deflator. Education was measured as a categorical variable with five levels (less than secondary, lower vocational (PTU), secondary com-pleted, specialized secondary (tekhnikum) and university degree), according to the highest educational qualification achieved. Marital status was defined as a categorical variable with three values (never married; married or cohabiting; widowed, divorced and married, but not living together). The values for the ethnicity variable took the values Russian, non-Russian and no answer. Region was defined as one of the 38 primary sampling units (so each model that includes ‘region’ has 37 dummy variables).
To measure perceived social status, we drew on three questions that assess an individual’s perception of their position in the
social hierarchy with regard to wealth, power and respect. These responses were scaled from 1 (lowest status) to 9 (highest status). In Cox models, all variables measured on interval scales (perceived status and household income), were standardized with means equal to zero and standard deviations equal to 1.
We estimated class-specific crude and age-standardized mortality rates [using the indirect method of standardization, taking the RLMS analytical sample as the standard population with a standardized mortality ratio (SMR) of 100]. Using the Kaplan–Meier method, we estimated the class-survivor function, which we used to estimate class-specific life expectancies at age 21 (e21). Life expectancies were calculated as the areas under the Kaplan–Meier curve. Cox proportional hazards analysis was applied to model the relationships among class, perceived status, and mortality. In all Cox models, we set age as the analytic time variable, with entry to risk at age 21 and exit at age 70. The crucial assumption of Cox models is the proportionality of hazards. We checked this assumption after fitting the models by examining Schoenfeld residuals and did not find evidence of non-proportionality for class, education, income and perceived wealth. We also tested for potential multi-collinearity among these variables, finding that, while there were intercorrelations, these were below conventional thresholds used to indicate signifi-cant multicollinearity. As our main hypothesis focused on class, we present unadjusted models of the class-mortality association, subsequently introducing demographic controls and status, income and education variables. All models were estimated using Stata 11. Plots were created withR.
Results
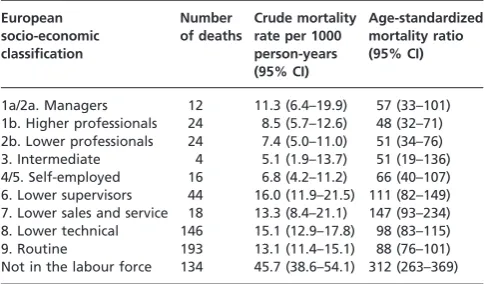
Table 1 presents class-specific crude and age-standardized
mortality rates (descriptive statistics for all variables are available in theSupplementary Appendix). Higher and lower professionals have the lowest SMRs, followed by managers. The SMR for inter-mediate workers is also low, but the range of uncertainty is high due to the small number of deaths in this group. The highest mortality ratios were observed among the lower sales and service class, followed by manual supervisors and technicians and manual workers, both skilled and unskilled. Men who were not in the labour force had by far the highest SMR.
Figure 1 presents the bivariate associations of class, status,
education and income with mortality for men, adjusted for age. The association of mortality with class differs from analyses in other Western European setting in that there is not a clear, linear gradient. Higher and lower professionals and managers have about the same mortality hazards. Unskilled routine, skilled
Table 1 Class inequality in Russian mortality
European socio-economic classification Number of deaths Crude mortality rate per 1000 person-years (95% CI)
Age-standardized mortality ratio (95% CI)
1a/2a. Managers 12 11.3 (6.4–19.9) 57 (33–101) 1b. Higher professionals 24 8.5 (5.7–12.6) 48 (32–71) 2b. Lower professionals 24 7.4 (5.0–11.0) 51 (34–76) 3. Intermediate 4 5.1 (1.9–13.7) 51 (19–136) 4/5. Self-employed 16 6.8 (4.2–11.2) 66 (40–107) 6. Lower supervisors 44 16.0 (11.9–21.5) 111 (82–149) 7. Lower sales and service 18 13.3 (8.4–21.1) 147 (93–234) 8. Lower technical 146 15.1 (12.9–17.8) 98 (83–115) 9. Routine 193 13.1 (11.4–15.1) 88 (76–101) Not in the labour force 134 45.7 (38.6–54.1) 312 (263–369) Crude and age-standardized mortality rates, 1994–2006 (men aged 21–70 years old). Crude mortality rates were standardized using the indirect method. The RLMS male sample was taken as the standard population having an SMR of 100.
by guest on September 23, 2011
eurpub.oxfordjournals.org
lower technical workers and manual supervisors and technicians also have similar mortality hazards.
If we exclude those who are not in the labour force (including persons who have disabilities as well as workers who left the labour force), the magnitude of the gap between best and worst category is as large for class as for education and household income.
The Cox proportional hazards analysis of class and the hazard of dying are presented intable 2.
As shown in Model 1 intable 2, occupational class is a signifi-cant determinant of mortality hazards, even after controlling for several background variables (marital status, ethnicity, year and region) (Model 2). Next, we added the two measures most commonly used to assess social position, education and household income per capita (model 3). Adjusting for these two factors reduced the strength of the association between class and mortality, but not substantially. An increase of household income per capita by one standard deviation was associated with a reduction of the hazard of dying by 12% (after controlling for class and education). After controlling for age, year, marital status, ethnicity, region, income and occupational class, men with less than secondary and lower vocational education had on average 39% and 26% higher mortality hazards compared with men with completed secondary education, while university educated men had 8% lower mortality hazards.
In Model 4, we added three perceived status variables for perceived wealth, respect and power.
After controlling for class, education, household income and other variables, perceived wealth showed a statistically significant association with mortality (HR= 1.28, 95% CI: 1.11–1.48), while the hazard ratios for perceived respect and power were smaller and failed to reach the level of statistical significance. Note that the focus in model 4 is on the hazard ratios for perceived status rather than class. As perceived status can be affected by class, this
makes the interpretation of the coefficients for class in Model 4 less clear than in other reported models.38,39The aim of Model 4 is to show that perceived status remains a statistically significant predictor of male mortality in Russia even after controlling for objective socio-economic characteristics, such as class, education and household income.
After finding a robust association of occupational class with mor-tality, we estimated the association of class with longevity. As noted above, the mortality rates estimated with the RLMS sample were lower than those published by the Russian Statistical Office, so that the estimated life expectancies were higher than official ones. As calculated from the RLMS data, male life expectancy at age 15 was 48.3 years, compared with 45.8 years using average official estimates for the same period (5.2% higher). To correct for this, we assumed that deaths were under reported equally in all classes in the RLMS sample and lowered estimated life expectancies by 5.2% for all classes. Figure 2 presents adjusted class-specific life expectancies at age 21 (e21) for men.
The results reveal that a skilled manual worker aged 21 would expect to live 40 more years, whereas a higher professional would expect to live 48 more years. Men for whom class could not be coded (disabled, permanently unemployed) had particularly low life expectancy at age 21 (25.8 years). Note that as life expectancies are based on sample estimates, there is larger uncertainty for the estimates for classes with a smaller number of deaths (intermediate workers, the self-employed, managers, lower sales and service workers).
Discussion
Before evaluating the implications of our study for health policy, we must address its limitations. First, the RLMS is a small sample for the analysis of mortality, making it more difficult to identify
Figure 1 Mortality hazard ratios by class, education, household income per capita and perceived wealth. Adjusted for age: men, aged 21–70. Estimates plotted with 95% confidence intervals. Number of men in each category reported for class and education in the parentheses
by guest on September 23, 2011
eurpub.oxfordjournals.org
a statistically significant relationship should one actually exist. Nonetheless, we identified robust associations of occupational class, perceived social status, education and income with mortality. Second, our estimates likely underestimate the effect of class, as, like in all analyses of class, it is difficult to assign a class position to persons who are economically inactive (who in our data had the greatest hazards of dying) and persons with manual class back-grounds have greatest risks of leaving the labour force. Further,
we assumed that deaths in the RLMS were equally under-reported in all classes. In fact, in manual classes under-reporting is prob-ably higher (as the survey does not cover the institutionalized population that is more likely to contain manual classes). Thus, our estimates of the class gap in mortality are conservative.
Third, we excluded from the analytic sample men who lived in single-person households. However, this exclusion is unlikely to seriously bias the results, as these men account only for 4.5% of all person-years in the RLMS sample (although this group may be underestimated in the RLMS itself). Ideally, we would also estimate class inequality in mortality among working age men only, but unfortunately doing so would greatly constrain the power of our analysis as the number of deaths is reduced by
40% as compared with the sample of men aged 21–70 years. However, we did conduct sensitivity analysis, constraining the sample to men aged 21–60 years. None of our findings was quali-tatively changed, although the confidence intervals did widen due to lower statistical power.
Overall, we found evidence consistent with our hypotheses that low-skilled workers had the greatest risks of dying during the transition and that those who further perceived themselves in lower status positions had elevated risk. The general pattern of inequality in mortality in Russia is similar to Western countries, whereby manual classes have greater hazards of dying than non-manual. However, unlike in some western countries, we observed no difference in the mortality experience of male higher and lower professionals and, while this may reflect a lack of statistical power, it may also indicate that the former have fared less well during transition. This is consistent with previous studies demonstrating the disadvantaged position of Russian higher pro-fessionals (medical doctors, scientists, engineers and university lecturers) during the transition.7On the other hand, male skilled Table 2 Cox proportional hazards analysis of class associations with risk of mortality, Russia 1994–2006
Model 1 (adjustment for age and year)
Model 2 (mutual adjustment for age, year, marital status, ethnicity and region)
Model 3 (mutual adjustment for age, year, marital status, ethnicity, region, education
and household income)
Model 4 (mutual adjustment for age, year, marital status, ethnicity, region, education, household income, perceived wealth, respect and power) Variable Hazard ratio (95% CI) Hazard ratio (95% CI) Hazard ratio (95% CI) Hazard ratio (95% CI)
Occupational class (ESeC)
1a/2a. Managers 1.20 (0.58–2.47) 1.26 (0.62–2.56) 1.23 (0.58–2.57) 1.27 (0.60–2.70)
1b. Higher professionals – – –
2b. Lower professionals 1.11 (0.58–2.13 1.12 (0.59–2.13) 1.06 (0.56–2.00) 1.06 (0.56–1.99) 3. Intermediate 1.15 (0.41–3.25) 1.12 (0.40–3.19) 1.03 (0.36–2.93) 1.04 (0.37–2.92) 4/5. Self-employed 1.43 (0.74–2.79) 1.48 (0.75–2.89) 1.31 (0.68–2.50) 1.29 (0.66–2.49) 6. Lower supervisors 2.46 (1.50–4.01) 2.39 (1.45–3.93) 2.02 (1.23–3.34) 2.06 (1.25–3.41) 7. Lower sales and service 3.26 (1.45–7.30) 3.25 (1.45–7.28) 2.75 (1.28–5.91) 2.80 (1.28–6.09) 8. Lower technical 2.20 (1.41–3.44) 2.12 (1.37–3.28) 1.67 (1.05–2.67) 1.64 (1.01–2.65) 9. Routine 1.99 (1.23–3.22) 1.88 (1.17–3.03) 1.46 (0.86–2.48) 1.42 (0.83–2.42) Not in the labour force 8.10 (5.33–12.31) 8.17 (5.42–12.30) 6.30 (3.99–9.96) 6.15 (3.80–9.95) Education
Less than secondary 1.39 (1.06–1.82) 1.40 (1.07–1.85)
Lower vocational (PTU) 1.26 (0.98–1.61) 1.28 (1.00–1.62)
Secondary completed (ref.) – –
Specialized secondary 0.95 (0.67–1.36) 1.00 (0.71–1.42)
University degree 0.92 (0.61–1.40) 0.97 (0.64–1.48)
Logged household income per capita (mean = 0, SD = 1)
0.88 (0.80–0.97) 0.90 (0.82–0.98) Perceived social status
Perceived wealth (mean = 0, SD = 1) 1.28 (1.11–1.48)
Perceived power (mean = 0, SD = 1) 0.94 (0.85–1.05)
Perceived respect (mean = 0, SD = 1) 1.00 (0.91–1.09)
Men, 21–70 years old. Age was set as the analytic time variable. All model estimates with the sample of 6586 subjects, 40 046 person-years and 593 deaths. Model 1 controls for year of death, Models 2–4 control for marital status, ethnicity, year of death and primary sampling unit (region); the coefficients are not reported. All models report confidence intervals adjusted for the complex survey design.
Figure 2 Life expectancy at age 21 by class, men. Adjusted for the difference between the RLMS and the official mortality rates
by guest on September 23, 2011
eurpub.oxfordjournals.org
workers had no advantage over their unskilled counterparts (in fact, they had even slightly lower life expectancy). As most skilled workers were employed in threatened industrial enterprises, while unskilled workers (drivers, building caretakers, etc.) could be employed in different sectors, this may indicate that skilled manual workers in Russia were especially vulnerable during the deep industrial crisis that characterized the transition.
Comparing the magnitude of our findings to Western European studies, we found that the male manual to non-manual mortality gap among middle-aged men in Russia is considerably larger. In the age group 45–59 years, the manual to non-manual mortality rate ratio is 2.29 (95% CI: 1.51–3.48), while in Europe it varies from 1.24 in Denmark to 1.65 in France.40(See Supplementary
Appendix for further details.) The larger class mortality gap in
Russia is likely to be explained by differential alcohol consumption that mediates the association between class and mortality, although further research is required to test this claim empirically.
We found that life expectancy at age 21 is about 10 years longer for managers and professionals than for skilled manual workers. To put these levels in perspective, among manual classes, male life expectancy in Russia is similar to, for example, Ghana and Haiti, while among non-manual classes, it is similar to the average for men in Turkey or Hungary.
In summary, occupational class position is a powerful determin-ant of inequalities in mortality among Russian men. Further research is required to understand the pathways that link occupa-tional class and premature mortality among men, especially the important role of hazardous alcohol consumption as well as of any factors that may provide some degree of protection for Russian women.
Supplementary data
Supplementary dataare available atEURPUBonline.
Acknowledgements
The authors are grateful to David Leon (London School of Hygiene and Tropical Medicine) for his thoughtful comments on the article and to Tak Wing Chan (Department of Sociology, University of Oxford) for fruitful discussions.
Funding
This work was supported by the Oxford University John Fell Fund on class, status and health in Russia. A.B. is grateful to the Max Weber Programme of the European University Institute for providing support during the preparation of this article.
Conflicts of interest: None declared.
Key points
The gap in life expectancy at age 21 between male managers and professionals and skilled manual workers in Russia is about 10 years.
Occupational class is significantly associated with mortality after adjusting for education and other confounders.
The manual to non-manual mortality gap in men is considerably larger in Russia compared with Western Europe.
References
1 Leon D, Chenet L, Shkolnikov VM, et al. Huge variation in Russian mortality rates1984–1994: artefact, alcohol, or what?Lancet1997;350:383–8.
2 McKee M, Szucs S, Sarvary A, et al. The composition of surrogate alcohols consumed in Russia.Alcohol Clin Exp Res2005;29:1884–8.
3 Gil A, Polikina O, Koroleva N, et al. Availability and characteristics of nonbeverage alcohols sold in 17 Russian cities in 2007.Alcohol Clin Exp Res
2009;33:79–85.
4 Perlman F, Bobak M. Assessing the contribution of unstable employment to mortality in posttransition Russia: prospective individual-level analysis from the Russian longitudinal monitoring survey.Am J Public Health
2009;99:1818–25.
5 Stuckler D, King L, McKee M. Mass privatization and the post-communist mortality crisis.Lancet2009;373:399–407.
6 Walberg P, McKee M, Shkolnikov V, et al. Economic change, crime, and mortality crisis in Russia: a regional analysis.BMJ1998;317:312–8.
7 Gerber T, Hout M. More shock than therapy: employment and income in Russia, 1991-1995.Am Sociol Rev1998;104:1–50.
8 Field MG, Twigg J.Russia’s Torn Safety Nets: Health and Social Welfare During the Transition. New York: Palgrave Macmillan, 2000.
9 Shkolnikov VM, Leon DA, Adamets S, et al. Educational level and adult mortality in Russia: an analysis of routine data 1979 to 1994.Soc Sci Med
1998;47:357–69.
10 Perlman F, Bobak M. Socioeconomic and behavioral determinants of mortality in posttransition Russia: a prospective population study.Ann Epidemiol
2008;18:92–100.
11 Plavinski S, Plavinskaya SI, Klimov AN. Social factors and increase in mortality in Russia in the 1990s:prospective cohort study.BMJ
2003;326:1420–2.
12 Murphy M, Bobak M, Nicholson A, et al. The widening gap in mortality by educational level in the Russian Federation, 1980–2001.Am J Public Health
2006;96:1293–9.
13 Shkolnikov V, Andreev EM, Jasilionis D, et al. The changing relation between education and life expectancy in central and eastern Europe in the 1990s.
J Epidemiol Community Health2006;60:875–81.
14 Denisova I. Adult mortality in Russia: a microanalysis.Econ Transition
2010;18:333–63.
15 Tomkins S, Saburova L, Kiryanov N, et al. Prevalence and socio-economic distribution of hazardous patterns of alcohol drinking: study of alcohol consumption in men aged 25–54 years in Izhevsk, Russia.Addiction
2007;102:544–53.
16 Leon DA, Saburova L, Tomkins S, et al. Hazardous alcohol drinking and premature mortality in Russia: a population based case-control study.Lancet
2007;369:2001–9.
17 Hadju P, McKee M, Bojan F. Changes in premature mortality differentials by marital status in Hungary and in England and Wales.Eur J Publ Health
1995;5:259–64.
18 Watson P. Health difference in Eastern Europe: preliminary findings from the Nowa Huta study.Soc Sci Med1998;46:549–58.
19 Carlson E. Concentration of rising Hungarian mortality among manual workers.
Sociol Soc Res1989;76:81–5.
20 Carlson E, Tsvetarsky S. Concentration of rising Bulgarian mortality among manual workers.Sociol Soc Res1992;76:81–5.
21 Chan TW, Goldthorpe JH. Class and status: the conceptual distinction and its empirical relevance.Am Sociol Rev2007;72:512–32.
22 Chan TW, Goldthorpe JH. Social stratification and cultural consumption: music in England.Eur Sociol Rev2007;23:1–19.
23 Chan TW, Goldthorpe JH. Is there a status order in contemporary British society?
Eur Sociol Rev2004;20:383–401.
24 Torssander J, Erikson R. Stratification and mortality—A comparison of education, class, status, and income.Eur Sociol Rev2010;26:465–74. 25 Goldthorpe JH. Analyzing social inequality: a critique of two recent contributions from economics and epidemiology. Eur Sociol Rev
2010;26:731–44.
26 Gerber T. Paths to success: individual and regional determinants of entry to self-employment in post-Communist Russia.Int J Sociol2001;31:3–37. 27 Burawoy M. Transition without transformation: Russia’s involutionary road to
capitalism.East Eur Politics Society2001;15:269–92.
28 Burawoy M, Krotov P, Lytkina T. Involution and destitution in capitalist Russia.
Ethnography2000;1:43–65.
by guest on September 23, 2011
eurpub.oxfordjournals.org
29 Burawoy M, Verdery K.Uncertain Transition. Ethnographies of Change in the Post-Socialist World. Oxford: Rowman and Littlefeld, 1999.
30 Burawoy M, Krotov P. The Soviet transition from socialism to capitalism: worker control and economic bargaining in the wood industry.Am Sociol Rev
1992;57:16–38.
31 Brainerd E. Winners and losers in Russia’ economic transition.Am Econ Rev
1998;88:1094–116.
32 King L, Sznajder A. The state-led transition to liberal capitalism: neoliberal, organization, world-systems and social structural explanations of Poland’s economic success.Am J Sociol2006;112:751–801.
33 King L, Hamm P.Privatization and state capacity in postcommunist society. William Davidson Working Paper No. 806, 2005.
34 Rose D, Harrison E. The European Socio-economic Classification: a new social class schema for European research.Eur Soc2007;9:459–90.
35 Rose D, Harrison E, editors.Social Class in Europe. An Introduction to the European Socio-Economic Classification. Routledge: London and New York, 2010. 36 Kunst AE, Roskam A-J. Using the ESeC to describe socio-economic inequalities in
health in Europe.Social class in Europe: An introduction to the European Socio-Economic Classification. Routledge: London and New York, 2010: 216–34. 37 Gerber T, Hout M. Tightening up: declining class mobility during Russia’s market
transition.Am Sociol Rev2004;69:677–703.
38 Schisterman EF, Cole SR, Platt RW. Overadjustment bias and unnecessary adjustment in epidemiologic studies.Epidemiology2009;20:488–95.
39 Rosenbaum PR. The consequences of adjustment for a concomitant variable that has been affected by the treatment.J Roy Statist Soc1984;A147:656–66. 40 Kunst AE, Groenhof F, Mackenbach J. Mortality by occupational class among
men 30–64 years in 11 European countries.Soc Sci Med1998;46:1459–76.
by guest on September 23, 2011
eurpub.oxfordjournals.org