Received: 2013.09.19 Accepted: 2013.10.14 Published: 2013.12.06
ABSTRACT
In this study the first part of the experimental data was recorded in a data acquisition station, and another one was recorded with a high speed camera. The data recorded using the acquisition station was recorded with higher frequency than the time be-tween two subsequent frames of the film. During the analysis of the experimental data the problem was related to the synchronization of measurement from acquisition station and data recorded with a camera. In this paper the method of synchronization of experimental data has been shown. A laser- phototransistor system has been used. The data synchronization was required in scaling of sampling frequency in the inves-tigated time series.
Keywords: experimental data synchronization, time series, video analysis, bubble departure.
INTRODUCTION
During the study of dynamics of bubble chain
formation in liquid the data were recorded using the acquisition station and with a high-speed
cam-era at the same time [1–4]. During the analysis of
the experimental results the data synchronization was required. There are few methods of data
syn-chronization [4, 5]. In the first method the spe -cialized cameras which can be connected to the data acquisition station are used. Another method is based on a connection between the camera and acquisition station using PC computer. These methods allow us for the simultaneous data acqui-sition and the recorded video, but these methods require additional and expensive hardware. These methods need also the same sampling frequency.
In the paper the method of data synchroni-zation, which is based on laser- phototransistor system, has been shown. This method is cheaper than the previously described methods of data synchronization. The method consisted of two
stages. The first stage of data synchronization was
based on the phenomenon of voltage change
dur-ing the time when the laser beam was interrupted. The second stage of synchronization was based on characteristic points inside the analysed time series. The data which were recorded using acqui-sition systems were sampled at frequency equal to 1 kHz. The videos were recorded with the speed of 600 fps. The time series of pressure changes in air supply system, which were recorded using acquisition systems synchronized with changes of liquid penetration into the nozzle, which were recorded with a high speed camera.
EXPERIMENTAL SETUP AND
MEASUREMENT TECHNIQUE
In the experiment, bubbles were generated in the tank whose dimensions were 300×150×700 mm. The experimental setup, for which the dynamics of bubble departing was investigated, has been shown in Figure 1.
Fig. 1. Experimental setup: 1 – glass tank, 2 – camera, 3 – light source, 4 – computer acquisition system, 5 – air pumps, 6 – glass nozzle, 7 – air valve, 8 – overpressure sensor, 9 – air flow meter,
10 – pressure sensor, 11 – air tank, 12 – laser, 13 – phototransistor
was filled with distilled water. During the ex -periment the temperature of water was constant
at about 20°C. The air volume flow rate was
changed from 0.0045 l/min to 0.125 l/min. The changes of air pressure in air supply system were
measured using pressure sensor MPX12DP. The
time series of pressure changes in the supply system were recorded using data acquisition
sta-tion DT9800 Series USB Funcsta-tion Modules for Data Acquisition Systems. Sampling frequency
was 1 kHz. Videos were recorded using a high
speed camera (Casio EX FX 1). The films were
recorded in grey scale with the speed of 600 fps. The duration of each video was 20 s. The
light-ing was based on LED, which gave cold white
light. This kind of lighting made it possible to obtain high contrast between liquid and gas. On the videos the gas phase was a dark grey and the liquid phase was light grey. This kind of light-ing allows obtainlight-ing a clear boundary between liquid and gas. The light source was powered by
a DC power supply. Therefore, the light intensity
could be adjusted. Between the lights and tank,
the glass plate was placed. The plate was made of translucent glass.
The recorded videos were divided into frames. Using the frames, the time series of liq-uid penetration were obtained. The technique of the obtained time series has been presented in the paper [1].
THE SYNCHRONIZATION OF THE
EXPERIMENTAL RESULTS
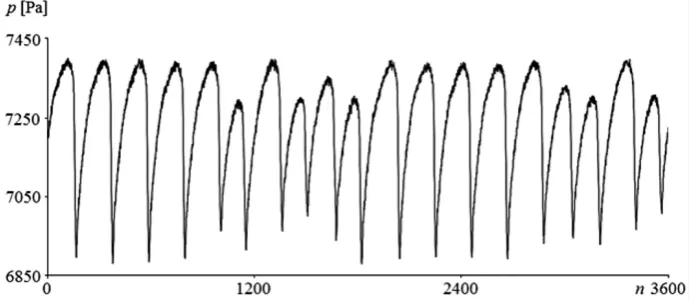
In Figure 2 examples of the time series of pressure changes in the gas supply system has been shown. The exemplary time series of chang-es of depth of liquid penetration inside the nozzle has been shown in Figure 3.
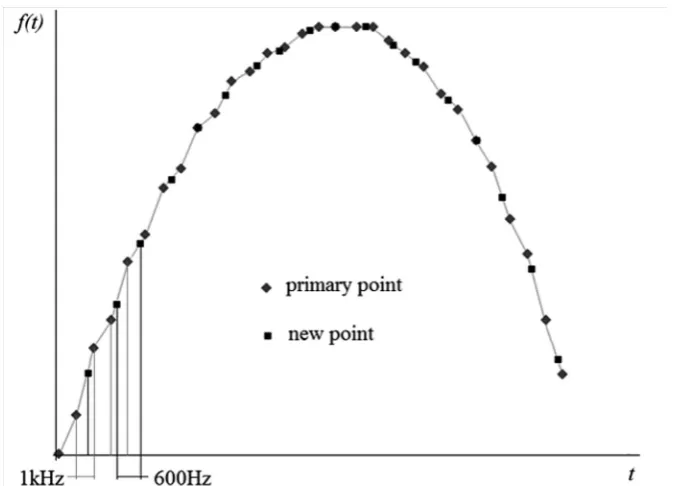
The experimental results (liquid penetration inside the nozzle and pressure changes) were re-corded with different sampling frequencies (600 Hz and 1 kHz). Adjustment of sampling frequency for the analysed time series was required. The sampling frequency of pressure changes has been
modified using a computer program. The time
series, which were recorded using data acquisi-tion system, had a higher sampling frequency. In this method two samples, recorded with the data acquisition station, determined the straight line equation. The value of pressure in time between these two points was calculated using this equa-tion. The example of the output of the algorithm is shown in Figure 4. The original points has been shown which were marked with rhombuses. The new points were plotted on a graph – marked with squares.
In the first stage of the synchronization a
laser-phototransistor system has been used. The schema of electronic circuit of the laser-photo-transistor system has been shown in Figure 5. The integrated circuit LM317 was used to power the laser which allowed us to achieve the stable
op-eration of the laser. Laser module was equipped with aperture. The laser beam diameter was ap-proximately 0.1 mm. The phototransistor that was used (BPYP22) allowed the registration of the signal with a frequency above 75 kHz. The phototransistor was equipped with a cover whose length was equal to 30 mm and was made of a tube with inner diameter of 4 mm.
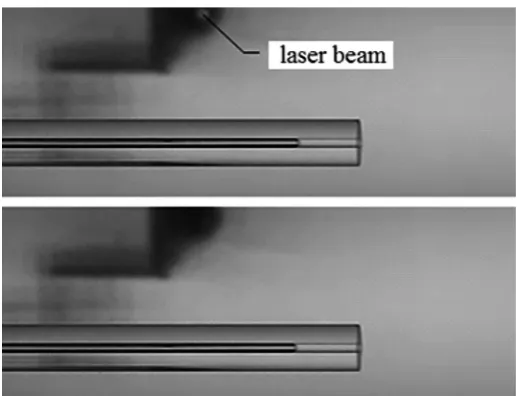
The laser beam was directed to the translu-cent plate of glass. On the other side of the glass plate the phototransistor was set. The part of the laser beam was passed through the translucent
plate of glass and the next part was reflected,
which gave the effect of a spots on the videos (Figure 6a). A signal from phototransistor as a time series of changing of voltage, which was generated in phototransistor, was recorded by the data acquisition station.
Fig. 3. Time series of changes of depth of liquid penetration inside the nozzle
Before the start of the measurement the laser was on and the voltage generated by
phototrans-istor was equal to 2.5V. During the measurement
the laser beam was temporarily blocked by a shut-ter. The shutter was made from a rod with an out-side diameter of 5 mm. The time when the laser beam was invisible was about 0.3 s – about 180 frames. The frame in which there was no light of laser is shown in Figure 6.b. The moment when the laser beam was blocked was also observed in the signal recorded by the data acquisition station as a voltage change (Figure 7). The moment in which the voltage was re-stabilized on phototran-sistor (2.5 V) and the re-emergence of light on the video frame was treated as the starting of the synchronized time series.
The data obtained from the high-speed cam-era was analysed from the frame where the re-emergence of laser beam was noticed. In this way, the changes of liquid penetration into the nozzle
Fig. 5. The schema of electronic circuit of the laser-phototransistor system
Fig. 6. The frames of the video a) visible laser beam, b) the block the laser light
and the time of bubble growth connected with the pressure changes in the supply system.
The time of voltage rise of the signal from the laser was about 0.05 s, therefore, the accuracy of
the first phase of synchronization was about 30
frames. As a result, the time series of pressure changes have been shifted to the time series of liquid penetration into the nozzle. In the second phase of synchronization the beginning of those time series have been corrected using characteris-tic points in those time series.
se-Fig. 7. Voltage change observed in the time series recorded by the data acquisition station
Fig. 8. Second phase of synchronization of changes of pressure in the supply system and the time series of changes of liquid penetration into the nozzle
ries of gas pressure changes in the supply system the lowest pressure value determines the time of
bubble departure (A). During the bubble growth,
the value of liquid penetration into the nozzle was zero. The moment when the liquid penetration increased, the time of gas bubble departing (B)
is Determined. The number of samples with the
lowest pressure value and the number of frames where the process of liquid penetration was start-ing become new onset points of time series. Us-ing these points in the time series the experi-mental data was synchronized. Points A and B in those time series were set on the same values of the samples (x-axis). The samples corresponding to the presented values, at points A and B, was beginning of the analysed time series.
CONCLUSIONS
The presented method of data
synchroniza-tion allowed us to fit the pressure time series re -corded using the data acquisition station and the time series of changes of liquid penetration into the nozzle, recorded by the high-speed camera.
ics of liquid movement inside the nozzle during the