Biogeosciences, 10, 6161–6184, 2013 www.biogeosciences.net/10/6161/2013/ doi:10.5194/bg-10-6161-2013
© Author(s) 2013. CC Attribution 3.0 License.
Biogeosciences
Open Access
Effect of increased
pCO
2
level on early shell development in great
scallop (Pecten maximus Lamarck) larvae
S. Andersen1, E. S. Grefsrud2, and T. Harboe1
1Institute of Marine Research, Austevoll Research Station, 5392 Storebø, Norway 2Institute of Marine Research, Postbox 1870 Nordnes, 5817 Bergen, Norway
Correspondence to: S. Andersen ([email protected])
Received: 25 January 2013 – Published in Biogeosciences Discuss.: 22 February 2013 Revised: 16 August 2013 – Accepted: 22 August 2013 – Published: 1 October 2013
Abstract. As a result of high anthropogenic CO2emissions, the concentration of CO2in the oceans has increased, caus-ing a decrease in pH, known as ocean acidification (OA). Nu-merous studies have shown negative effects on marine inver-tebrates, and also that the early life stages are the most sen-sitive to OA. We studied the effects of OA on embryos and unfed larvae of the great scallop (Pecten maximus Lamarck), atpCO2levels of 469 (ambient), 807, 1164, and 1599 µatm until seven days after fertilization. To our knowledge, this is the first study on OA effects on larvae of this species. A drop inpCO2 level the first 12 h was observed in the ele-vatedpCO2groups due to a discontinuation in water flow to avoid escape of embryos. When the flow was restarted,pCO2 level stabilized and was significantly different between all groups. OA affected both survival and shell growth nega-tively after seven days. Survival was reduced from 45 % in the ambient group to 12 % in the highestpCO2group. Shell length and height were reduced by 8 and 15 %, respectively, whenpCO2increased from ambient to 1599 µatm. Develop-ment of normal hinges was negatively affected by elevated pCO2 levels in both trochophore larvae after two days and veliger larvae after seven days. After seven days, deformities in the shell hinge were more connected to elevatedpCO2 lev-els than deformities in the shell edge. Embryos stained with calcein showed fluorescence in the newly formed shell area, indicating calcification of the shell at the early trochophore stage between one and two days after fertilization. Our re-sults show that P. maximus embryos and early larvae may be negatively affected by elevatedpCO2levels within the range of what is projected towards year 2250, although the initial drop inpCO2level may have overestimated the effect of the highestpCO2levels. Future work should focus on long-term
effects on this species from hatching, throughout the larval stages, and further into the juvenile and adult stages.
1 Introduction
The increase of anthropogenic CO2emissions since the in-dustrial revolution has lead to an increase of carbon diox-ide (CO2)concentration and a decrease in pH in the oceans termed as ocean acidification (OA). Over the next 50–100 yr the CO2values are projected to reach 700 ppm (Zondervan et al., 2001; IPCC, 2001). Caldeira and Wickett (2003) showed through their geochemical model that with no reduction in fossil fuel emission of CO2into the atmosphere, there may be a rapid decline in pH in surface ocean waters over the next 100 yr of as much as 0.4 units (a doubling of H+-ion concen-tration). And within less than 250 yr the ocean surface pH may drop as much as 0.7 units, which may be the lowest pH value experienced during the last 300 million years (Caldeira and Wickett, 2003).
6162 S. Andersen et al.: Effect of increasedpCO2level on early shell development in great scallop
and isolation of the brood chamber, the brooded veligers were exposed to pH values as low as 7.0.
Although many marine organisms show a high tolerance to variations in pH, several experimental studies conducted over the last decade have shown negative effects of OA, es-pecially on calcifying organisms (Kroeker et al., 2010). The effects of elevated CO2levels are shown on a range of rine invertebrates (embryonic and larval development in ma-rine molluscs – Byrne, 2012; Ericson et al., 2010; Gaylord et al., 2011; Gazeau et al., 2011, Kurihara, 2008; Kurihara et al., 2007, 2008; Waldbusser et al., 2010; and effect on other invertebrates – Bechmann et al., 2011; Dupont et al., 2010; Jury et al., 2010; Comeau et al., 2009, 2010; Ries et al., 2009; Hoegh-Guldberg et al., 2007; Pane and Barry, 2007). Espe-cially larval stages of bivalves seem to be extremely sensitive to enhanced levels of CO2(Fabry et al., 2008; Talmage and Gobler, 2009, 2010, 2011), and most studies have shown a decrease in survival, shell growth, and normal larval devel-opment. Some studies have also shown a negative effect on shell thickness and strength (Chaparro et al., 2009; Gaylord et al., 2011; Welladsen et al., 2010), calcification (Ries et al., 2009; Waldbusser et al., 2010; Range et al., 2011), lipid syn-thesis (Talmage and Gobler, 2011), and energy stores (Dick-inson et al., 2012). The high sensitivity of bivalve larvae may be connected to the carbonate composition of the larval shell. A mollusc’s larval shell contains mainly aragonite, the most soluble form of crystalline calcium carbonate (Weiss et al., 2002; Kudo et al., 2010; Barros et al., 2013). The predicted undersaturation of aragonite in the world’s oceans may have a great negative impact on these calcifying organisms (Orr et al., 2005; Raven et al., 2005).
The numerous reports on effects of OA are slowly build-ing up a picture of how marine coastal ecosystems may be affected (biodiversity, functioning, and service) in the fu-ture (Raven et al., 2005). It is crucial to gain more knowl-edge about the effects on different marine organisms in order to get realistic projections of future changes of the marine food web. A negative effect on early life stages may not only be detrimental to recruitment and endanger the species sur-vival but also result in economic loss due to a collapse in global shellfish aquaculture production (Gazeau et al., 2010). Together with mussels and oysters, several scallop species are economically important in global aquaculture production (Bourne, 2000; FAO, 2010) in addition to being important calcifiers in the marine ecosystem.
The great scallop Pecten maximus Lamarck is distributed from the Iberian Peninsula in the south up to Lofoten in Nor-way in the north, and is found in highest abundances at 5– 50 m depth in shell sand areas (Strand and Parsons, 2006). The larvae are pelagic for about 15–32 days at temperatures of 15–18◦C (Comely, 1972; Le Pennec et al., 2003). The great scallop is a highly valued sea food product, and has been cultured for more than 25 yr in Norway. The extended research efforts during the same period make it an excel-lent candidate for OA studies (Andersen et al., 2011). To our
knowledge, only the study of Schalkhausser et al. (2012) has shown the effect of OA on P. maximus. They found a negative effect of OA on adult P. maximus shell-clapping performance and aerobic scope. However, no studies have focused on the effect of OA on P. maximus larvae. Studies on other scallop species as Argopecten irradians, Placopecten magellanicus and Chlamys nobilis show a negative effect of increased pH in most life stages, including fertilization, embryos, larvae, and juveniles (Desrosiers et al., 1996; Talmage and Gobler, 2009, 2010, 2011; Liu and He, 2012).
Most OA studies on mollusc larvae focus on effects on shell formation (Kurihara et al., 2007, 2008; Kurihara, 2008; Ericson et al., 2010; Waldbusser et al., 2010; Byrne, 2012; Gaylord et al., 2011; Gazeau et al., 2011). The shell that starts to evolve at the trochophore stage consists of proteins (Bel-lioli et al., 1993; Casse et al., 1998). Onset of calcification in the initial organic larval shell was detected during the tro-chophore larval stage in Mercenaria mercenaria and Cras-sostrea gigas larvae (Weiss et al., 2002). Casse et al. (1998) did not detect calcification in P. maximus trochophores, and according to Cragg (2006) it is likely that there is initially little or no calcification in pectinid larvae, but that the calci-fication starts within less than a day after the initial shell for-mation. If calcification is the actual process being affected, effects on the shell formation should be detected only after the stage when the calcification starts. The onset of calcifica-tion can be determined by the use of an epifluorescent dye, calcein, which binds to calcium in metabolically active indi-viduals (Körbl and Vydra, 1958; Day et al., 1995; Lucas et al., 2008; Chaparro et al., 2009).
The aim of the present study was to report the effect of el-evated CO2levels on scallop P. maximus Lamarck larvae sur-vival, shell size, and shell development from fertilized eggs to 7-day-old veligers. The exact initiation of calcification in P. maximus larvae is still unknown, and thus a pilot study using calcein staining as a method to elucidate this question was also conducted.
2 Material and methods
S. Andersen et al.: Effect of increasedpCO2level on early shell development in great scallop 6163
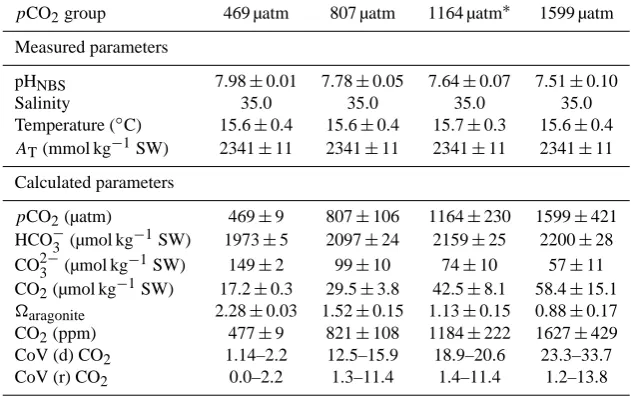
Table 1. Measured and calculated water parameters given as mean±sd for four differentpCO2groups (µatm). Carbon chemistry values were
computed based on daily measurements (0–6 days) of pHNBSin all replicates (n=4,∗n=3), means of hourly temperature measurements in
three tanks (n=468), salinity (daily), and total alkalinity (11 analyses from 3 dates) in seawater running into the lab. Coefficient of variation (CoV) range (sd as % of mean) is shown for variation in CO2(ppm) between days (d) for the replicates, and between replicates (r) for all
days.
pCO2group 469 µatm 807 µatm 1164 µatm∗ 1599 µatm
Measured parameters
pHNBS 7.98±0.01 7.78±0.05 7.64±0.07 7.51±0.10
Salinity 35.0 35.0 35.0 35.0
Temperature (◦C) 15.6±0.4 15.6±0.4 15.7±0.3 15.6±0.4
AT(mmol kg−1SW) 2341±11 2341±11 2341±11 2341±11
Calculated parameters
pCO2(µatm) 469±9 807±106 1164±230 1599±421
HCO−3 (µmol kg−1SW) 1973±5 2097±24 2159±25 2200±28
CO23−(µmol kg−1SW) 149±2 99±10 74±10 57±11
CO2(µmol kg−1SW) 17.2±0.3 29.5±3.8 42.5±8.1 58.4±15.1
aragonite 2.28±0.03 1.52±0.15 1.13±0.15 0.88±0.17
CO2(ppm) 477±9 821±108 1184±222 1627±429
CoV (d) CO2 1.14–2.2 12.5–15.9 18.9–20.6 23.3–33.7
CoV (r) CO2 0.0–2.2 1.3–11.4 1.4–11.4 1.2–13.8
approximately 1:100. Fertilized egg batches were mixed and incubated 1–2 h after fertilization. Egg number was de-termined by counts in 10 subsamples of 50 µL, and 13 fertil-ized eggs mL−1were incubated in 38 L exposure tanks at an ambient pHNBSof 7.98 (control) and mean pHNBSlevels of 7.71, 7.64, and 7.51, corresponding to apCO2level of 469, 807, 1164, and 1599 µatm (Table 1). The pH levels were used based on the predicted drop of 0.5 units from present day to year 2250 (IPCC, 2001). Mean temperature based on hourly measurements in three replicates (±sd) was 15.6±0.3◦C (n=495). Seawater with a salinity of 35 ppm was pumped from 160 m depth and filtered through a sand filter before temperature was adjusted in a heat pump. The water was aer-ated and finally filtered through a 50 µm filter. The experi-ment was conducted in a flow-to-waste system consisting of circular fiberglass tanks with slightly conical bottom, result-ing in a depth difference of 22 mm between tank centre and edge. The inner tank diameter was 500 mm, and water depth was 226–257 mm at the tank edge. Four replicates were used per pH level, and the flow rate was set to 10 L h−1per expo-sure tank. One replicate was lost after three days in the group exposed to a mean pHNBS of 7.64 (1184 ppm) due to over-flow. To prevent escape of embryos, water flow in the exper-imental tanks was turned off overnight at the incubation of fertilized eggs. A slow flow (<10 L h−1)was re-established after 10.5 h, and then increased to 15 L h−1(flow meter read-ings) after another 3.3 h. Slow bubbling of pressurized air was introduced at the tank bottom through a perforated plas-tic tube. Larvae were not fed during the experimental period.
Seawater at different pH levels was produced by mixing seawater with an acid stock solution of pHNBS 5.80, made from mixing CO2gas and seawater with an ambient pHNBS of 7.95. The pHNBS in each mixing tank was continuously adjusted to preset levels by addition of stock solution with dosage pumps (IWAKI) controlled by feedback from pH electrodes to pH transmitters (Endress & Hauser). The dif-ferent water qualities were distributed by gravity to the ex-posure tanks via four high-mounted header tanks. The water level in header and mixing tanks was kept constant by flota-tion valves, and water was pumped in a loop between the mixing tanks and header tanks. Water flow in the loop was much higher than the flow from the header tanks to the expo-sure tanks in order to keep the pH level constant in the header tanks.
Exposure tanks were illuminated continuously by fluores-cent tubes (Philips TL-D 18w/830) 110 cm above the tanks. Light was dispersed through an opaque sheet of polycarbon-ate 70 cm above the exposure tanks.
6164 S. Andersen et al.: Effect of increasedpCO2level on early shell development in great scallop
logger. ThepCO2values (µatm) corresponding to the pHNBS values were calculated from the daily average temperature (◦C) based on hourly recordings, salinity,ATand pH using
the macros in Ernie Lewis’ “CO2SYS.BAS” basic program (Pierrot et al., 2006).
Larvae samples were taken after carefully stirring from bottom to top using a plunger. A 50 mm diameter pipe was lowered to the bottom, and both ends were plugged before the pipe was pulled out of the water, collecting a volume of 400 mL. On day 2 a volume of 800 mL from each replicate was withdrawn to measure shell size and classify larval de-formities. When terminating the experiment after seven days, all tanks were drained and a total sample from each replicate was collected and preserved to determine final shell size, sur-vival, and classify deformities. To determine timing of shell calcification, larvae from ambient pH in an additional tank were stained for 18–20 h from day 1 to day 2.
When collected for preservation, embryos and larvae were retained on a 35 µm mesh screen and preserved in 4 % for-malin (diluted from 36.5 % formaldehyde solution, Sigma-Aldrich, cat. no. 33220) in PSB for two hours, rinsed twice in 70 % ethanol, and then kept in 70 % ethanol until the ra-tio of developmental stages was investigated. The formalin was made from mixing 8.14 g of disodium hydrogen phos-phate dihydrate (Na2HPO4·2H2O, Merck 1.06580.1000) and 4.00 g of sodium dihydrogen phosphate monohydrate (NaH2PO4·H2O, Merck 1.06346.1000) with 100 mL of 37 % formalin in 900 mL of distilled water.
A calcein stock solution was made from mixing 1 g of calcein (Sigma C0875-5G) in 1 L of distilled water adjusted to pHNBS7.0 using a sodium bicarbonate (NaHCO3, Merck 1.06329.1000) solution of 2.4 g in 400 mL of distilled water (Moran, 2000; Moran and Marko, 2005; Fitzpatrick et al., 2010). For staining of calcium, 20 mL of calcein stock so-lution was added to 400 mL of seawater with larvae, giving a final calcein concentration of 22 mg L−1. Only larvae at ambient pHNBS were stained, as the aim of this pilot study was to elucidate when the calcification of the larvae shell is normally initiated. We assumed that the pH was not af-fected during staining since the calcein stock solution was less than 5 % of the total water volume; however the pH was not measured. Calcein has little or no effect on mollusc larvae survival or growth (Moran, 2000; Moran and Marko, 2005; Chick, 2010; Fitzpatrick et al., 2010).
Live (calcein stained) and preserved larvae were pho-tographed using a Canon EOS 5D Mark II camera attached to an Olympus BX60 microscope. Final shell length (paral-lel to the hinge) and height (perpendicular to the hinge) were measured in 21–60 individuals to the nearest 4.8 µm from printed photographs. Survival was based on the initial num-ber of fertilized eggs, and was estimated by concentrating all day-7 larvae in 25–110 mL and counting the number in 10 subsamples of 50 µL. Preserved larvae photographed at 100 magnifications using bright field were classified according to shell shape and counted. The number of trochophores
classi-fied on day 2 was 76–150, and 46–178 veligers were exam-ined on day 7. Since we were unable to find any published study on deformities in scallop larvae, deformities were cat-egorized according to deformities as described in larvae of mussel (Mytilus sp) and the Pacific oyster (C. gigas) (His et al., 1997). We observed the same “convex hinge” and “in-dented shell margins” in our larvae, but called the categories “hinge deformity” and “edge deformity”, respectively. We classified preserved larvae into four categories according to shell shape, and counted (1) normal (Fig. 1a), (2) hinge de-formity (Fig. 1b–c), (3) edge dede-formity (Fig. 1d–e), and (4) both edge and hinge deformity (Fig. 1f). Trochophore larvae on day 2 were only classified into category 1 and 2, since shell edge was not visible until the shell valves covered the whole larva. In veligers on day 7, all four categories were used.
Live, calcein-stained larvae were photographed at 10×40 magnification using an U-MSWB2 cube filter (excitation 420–440 nm, emission 475 nm) and UV light to show yellow-green fluorescence when calcein bonded with cal-cium (Moran, 2000; Moran and Marko, 2005; Fitzpatrick et al., 2010).
Statistica version 11 (Statsoft Inc.) was used to run statisti-cal tests. Arcsine-transformed survival data and shell dimen-sion data were not confirmed to normality (Shapiro–Wilk’s W test), and significant effects were tested using Kruskal– Wallis ANOVA by ranks. Differences between groups were tested using multiple comparisonpvalues (two-tailed). The rest of the data were tested using one-way ANOVA, followed by unequal N HSD post hoc test to find differences between groups. The significance level used in all tests was set to 0.05.
3 Results
3.1 Initial variation inpCO2(µatm)
S. Andersen et al.: Effect of increasedpCO2level on early shell development in great scallop 6165
Figure 1.
[image:5.595.128.468.62.326.2]Fig. 1. Shell shape categories observed in Pecten maximus larvae. (a) Normal shell shape in formalin-preserved day-7 veliger larva; (b) hinge deformity in formalin-preserved day-2 trochophore larva and (c) in day-3 veliger larva; (d) edge deformity in shell edge centre of a live day-7 veliger larva and (e) in shell edge side of a live day-6 veliger larva; (f) both hinge and edge deformity in a live day-7 veliger larva. The scale bar is 100 µm.
Figure 2
1
300 800 1 300 1 800 2 300 2 800
0 1 2 3 4 5 6 7
p
CO
2
(µ
a
tm)
Days
1599 µatm
1164 µatm 807 µatm
469 µatm
2
3 Fig. 2. The daily means ofpCO2(µatm)±sd for replicates in the
treatments and ambient group during the experimental period of seven days (n=4,n=3 for 1164 µatm).
3.2 Survival
The median survival of day-7 veligers based on the ini-tial number of incubated eggs reared at ambientpCO2was 45 % (range 25–46) and decreased with elevatedpCO2 lev-els (Fig. 3). At the highestpCO2level the median survival was 12 % (range 6–13 %). There was a significant effect of pCO2on survival (p=0.013), but only the group at the high-estpCO2level was significantly different from the control.
3285 Figure 3.
1
2
3
0 20 40 60 80 100
469 807 1164 1599
Su
rvi
va
l
(%
)
pCO2-group (µatm)
**
4
5 Fig. 3. Survival of day-7 scallop larvae given as median±quartile
in the fourpCO2groups as percentage of eggs incubated.∗∗
Sig-nificantly different from the otherpCO2groups.
3.3 Shell size
Shell length and height on day 7 were both negatively af-fected by an increase in pCO2 level (p <0.001 for both) showing a decrease in median values of 8 and 15 %, respec-tively, whenpCO2increased from 469 µatm (ambient) to the highestpCO2of 1599 µatm (Fig. 4). The median shell length and height were 115 and 91 µm, respectively, in the ambient
[image:5.595.310.548.404.551.2] [image:5.595.47.284.405.544.2]6166 S. Andersen et al.: Effect of increasedpCO2level on early shell development in great scallop
3286 Figure 4.
1
2
3
60 70 80 90 100 110 120
469 807 1164 1599
Sh
e
ll
si
ze
(µ
m)
pCO2-group (µatm)
SL
SH
** **
** **
*** ***
[image:6.595.308.549.63.208.2]4 5
Fig. 4. Scallop larvae shell length (SL) and height (SH) on day 7 given as median±quartile for fourpCO2groups. Each median
rep-resents measurements of 21–60 individuals in 3–4 replicates. Un-marked,∗∗-, and∗∗∗-marked CO2groups are significantly different
within the same variable.
group. All thepCO2groups were significantly different for both parameters, except for the twopCO2 groups 807 and 1164 µatm.
3.4 Shell deformities
On day 2 an average of 85 % (82–88 %) of examined individ-uals had developed a shell, and only 1 % had not developed further from egg stage. Around 28–68 % of all individuals in the differentpCO2groups on day 2 had developed a normal-looking straight hinge (Fig. 5). On day 7 the percentage of normal hinges was higher: 69–97 % for all pCO2 groups. The percentage of larvae with a normal hinge was negatively affected bypCO2on both days, (p=0.004 andp=0.021 for d2 and d7, respectively), and the lowest percentages were found at the highestpCO2 level (Fig. 5). The percentages of all four shell shape categories on day 7 were affected by increasing pCO2 level (p <0.000–0.005) (Fig. 6). The percentage of normally shaped larval shells decreased from 64 to 28 % with an increase inpCO2level from ambient to 1599 µatm. The effect of elevatedpCO2level seemed to fol-low no clear pattern as the ambient group was significantly different only from the least (807 µatm) and the most ele-vated pCO2 level (1599 µatm). Shell edge deformities ac-counted for 30–57 % in the differentpCO2groups (Fig. 6), and the control was significantly different only from the least elevated group. The percentage of larvae with hinge deformi-ties, and both hinge and edge deformideformi-ties, increased when the pCO2level increased. Only the most elevatedpCO2group was significantly different from the ambient group for these two shell deformity categories. Variation within replicates was high, and the coefficient of variation (CoV) ranged be-tween 5 and 70 % for allpCO2groups and categories.
3287 Figure 5.
1
2
3
0 20 40 60 80 100
469 807 1164 1599
N
o
rma
l
h
in
g
e
(%
)
pCO2-group (µatm)
d2
d7
*
** **
[image:6.595.308.548.300.444.2]4 5
Fig. 5. Percentage of larvae showing a normal, straight hinge on day 2 (d2) and day 7 (d7) based on the total larval number. Val-ues are means±sd for d2, and medians±quartiles for d7 (n=4, andn=3 for 1164 µatm).∗denotes not significantly different from any group within same variable;∗∗, significantly different from un-marked groups within same variable.
3288 Figure 6.
1
2
0 20 40 60 80 100
469 807 1164 1599
Sh
e
ll
sh
a
p
e
ca
te
g
o
ry
(%
)
pCO2-group (µatm)
normal edge hinge both
** **
** **
**
* *
3 4
Fig. 6. Percentage of the four scallop larvae shell shape categories on day 7 for differentpCO2groups. Values are mean (n=4,n=3 for 1164 µatm), and error bars are sd.∗denotes not significantly dif-ferent from any group within same category;∗∗, significantly differ-ent from unmarked groups within same category.
3.5 Calcification
S. Andersen et al.: Effect of increasedFigure 7. pCO2level on early shell development in great scallop 6167
i
ii
iii
a
b
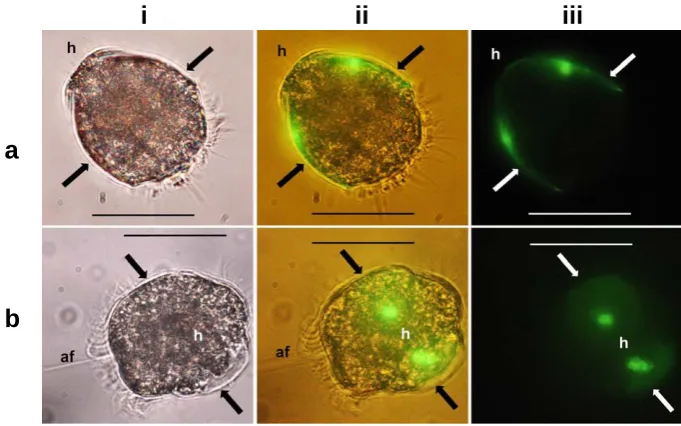
Fig. 7. Stereomicroscopic images of live trochophore scallop larvae stained with calcein from day 1 and overnight (18–20 h). (a) A side view with the hinge area (h) oriented towards the upper-left corner and a newly formed shell valve on each side (arrows). (b) The hinge area (h) and early shell formation (arrow) using (i) bright field, (ii) bright field and UV light, and (iii) UV light. Green colouring in UV light (fluorescence) shows areas containing calcium. The scale bar is 50 µm, and magnification is the same for all photographs.
4 Discussion
4.1 Non-feeding regime
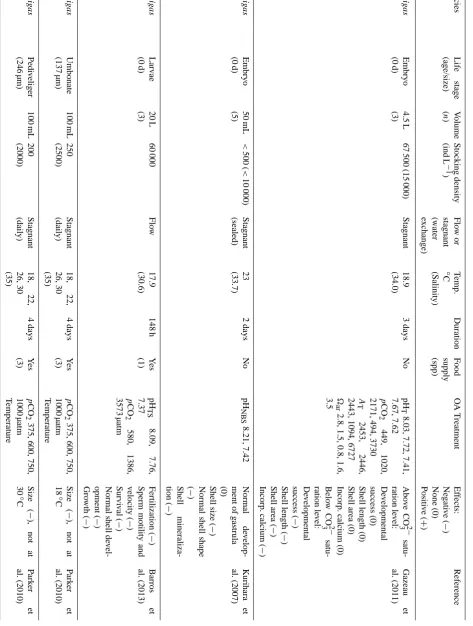
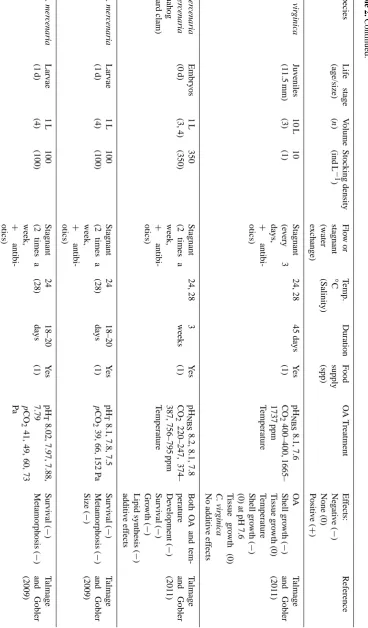
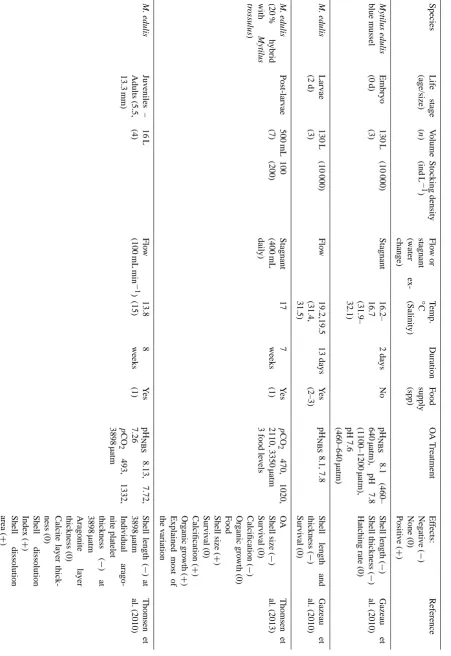
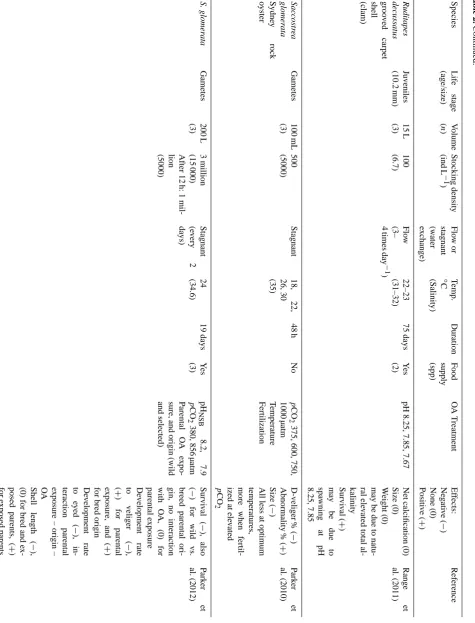
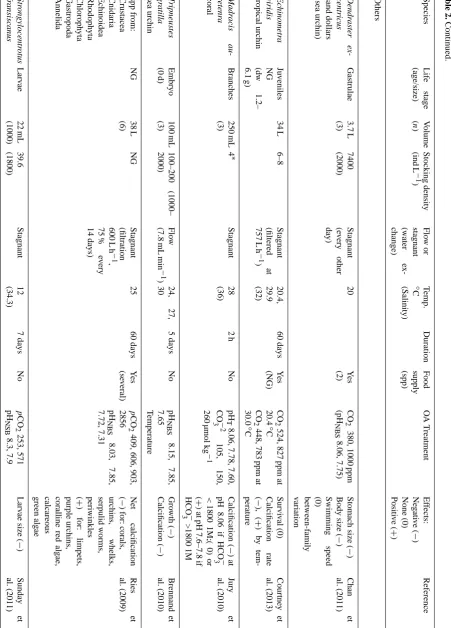
In the present study, scallop larvae were not fed during the 7-day experimental period. Lack of food is known to affect the energy status of scallop larvae after only three days (An-dersen et al., 2012); however, the survival and growth in the control group indicate that the unfed larvae were healthy and viable. Previous OA experiments on bivalve larvae support that the decreased survival, smaller size, and increased per-centage of deformed P. maximus larvae found in the highest pCO2 group was caused by the change in water chemistry rather than the feeding regime (feeding or non-feeding) (Ta-ble 2).
Thomsen et al. (2010) showed that calcifying keystone species may be able to handle the change in seawater chem-istry projected for the end of the century as long as food sup-ply is sufficient. The lack of food can be regarded as a stress factor that may push the larval energy status towards a point where the effects will be visible as slower growth, increased mortality, and increased shell deformity. We believe that in nature, bivalve larvae may experience shorter or longer pe-riods of food scarcity; thus unfed larvae may not be uncom-mon, and most species may be quite well adapted to such conditions. More studies are needed to elucidate how well P. maximus larvae are able to handle the futurepCO2levels at different feeding regimes.
4.2 Initial drop inpCO2level
[image:7.595.125.466.61.274.2]S. Andersen et al.: Effect of increasedpCO2level on early shell development in great scallop 6169
T
able
2.
Continued.
Species
Life
stage
(age/size)
V
olume
(
n
)
Stocking
density
(ind
L
−
1)
Flo
w
or
stagnant (w
ater
exchange)
T
emp.
◦C (Salinity)
Duration
F
ood
supply (spp)
O
A
T
reatment
Ef
fects:
Ne
g
ati
v
e
(
−
)
None
(0)
Positi
v
e
(
+
)
Reference
P
ecten
maximus
(king
scallop)
Adults (108.5
mm
shell height)
200
L
(8)
10 (0.05) Recirculation (exchanged twice
a
week)
4,
10
33–60 days
Y
es
(3)
p
CO
2
at
4
◦C:
0.040
and
0.110
kP
a
p
CO
2
at
10
◦C:
0.040
and
0.115
kP
a
pH
NBS
at
4
◦C:
8.19
and
7.76
pH
NBS
at
10
◦C:
8.25
and
7.81
T
emperature
T
emperature
Survi
v
al
(
−
)
O
A
Clapping
perfor
-mance
(
−
)
Metabolic
rate
(
−
)
Schalkhausser et
al.
(2012)
Placopecten ma
g
ellanicus
(sea
scallop)
Gametes, ooc
ytes,
embryos
NG
NG
NG
10 (25)
180
h
No
pH
7.0,
7.5,
8.0,
8.5
Extru
sion
of
polar
bodies
(0)
Duration
of
first
mi-otic
di
vision
shorter
at
pH
8–8.5
Completion
of
first
embryotic clea
v
age
(
−
)
at
pH
7.0
and
7.5
Le
v
els
of
polyspermy
(
+
)
at
pH
7.0
and
7.5
Desrosiers et
al.
(1996)
Chlamys
nobilis
noble
scallop
Juv
eniles
(40– 44
mm)
10
L
(5)
4
(0.4)
Stagnant (daily) 25 (32)
5
days
Y
es
(1)
pH
NBS
8.1,
7.7,
7.4
Clearance
(
−
)
Respiration
rate
(0),
(
−
)
at
pH
7.4
Excretion
(
−
)
at
pH
7.4
Liu
and
H
e
(2012)
Cr
assostr
ea
gi-gas Pacific
o
yster
Gametes
100
mL
(3)
500 (5000)
Stagnant
18,
22,
26,
30
(35)
48
h
No
p
CO
2
375,
600,
750,
1000
µatm
D-v
eliger
%
(
−
)
Abnormality
%
(
+
)
Size
(
−
)
All
less
at
optimum
temperatures, more
when
fertil-ized
at
ele
v
ated
p
CO
2
P
ark
er
et
al.
S. Andersen et al.: Effect of increasedpCO2level on early shell development in great scallop 6171 T able 2. Continued. Species Life stage (age/size) V olume ( n ) Stocking density (ind L − 1) Flo w or stagnant (w ater exchange) T emp.
◦C (Salinity)
Duration F ood supply (spp) O A T reatment Ef fects: Ne g ati v e ( − ) None (0) Positi v e ( + ) Reference C. gigas Juv eniles (5.5 mm) 100 mL 15 (150) Stagnant (daily) 18, 22, 26, 30 (35) 4 days Y es (3) p CO 2 375, 600, 750, 1000 µatm T emperature Size ( − ), more so at 30 ◦C P ark er et al. (2010) C. vir ginica eastern o yster Embryo 5 L (2) 5 (1)
Stagnant (ev
ery other day) 21 (30) 2 weeks Y es 380, 3500 µatm Stan dard metabolic rate ( + ) Beniash et al. (2010) C. vir ginica Embryos (0 d) 1 L (3, 4) 350 (350) Stagnant (2 times a week, + antibi-otics) 24, 28 3 weeks Y es (1) pH NBS 8.2, 8.1, 7.8 CO 2 220–247, 374– 387, 756–795 ppm De v elopment ( − ) Survi v al ( − ) Gro wth ( − ) Lipid synthesis ( − ) for both O A and temperature, addi-ti v e ef fects T almage and Goble r (2011) C. vir ginica, Larv ae (1 d) 1 L (4) 100 (100) Stagnant (2 times a week, + antibi-otics) 24 (28) 18–20 days Y es (1) pH T 8.1, 7.8, 7.5 p CO 2 39, 66, 152 P a Survi v al ( − ) Metamorphosis ( − ) Size ( − ) only at 152 P a T almage and Goble r (2009) C. vir ginica Juv eniles ( < 1 mm) 5 L (2) 50 (10)
Stagnant (ev
ery other day) 21 (30) 20 weeks Y es (3) p CO 2 380, 3500 µatm Survi v al ( − ) Dry shell mass ( − ) Soft-tissue mass Shell fracture toughness ( − ) Shell gro wth ( − ) Shell area (0) Standard metabolic rate ( + ) Beniash et al. (2010) C. vir ginica Juv eniles (7 weeks) 30 L (6control , 11– 12) NG
Stagnant (ev
ery
other
day)
21 (30, 15
S. Andersen et al.: Effect of increasedpCO2level on early shell development in great scallop 6173 T able 2. Continued. Species Life stage (age/size) V olume ( n ) Stocking density (ind L − 1) Flo w or stagnant (w ater exchange) T emp.
◦C (Salinity)
Duration F ood supply (spp) O A T reatment Ef fects: Ne g ati v e ( − ) None (0) Positi v e ( + ) Reference M. mer cenaria Larv ae (1 d) 1 L (4) 200 (200) Stagnant (2 times a week, + antibi-otics) 24 (28) 36 days Y es (1) CO 2 247, 380, 742, 1529 ppm, pH T 8.171, 8.052, 7.801, 7.532 pH < ambient Gro wth ( − ) Metamorphosis ( − ) Survi v al ( − ) Lipid accumulation rates ( − ) Normal shell de v el-opment ( − ) Shell thickness ( − ) pH >ambient Gro wth ( + ) Metamorphosis ( + ) Survi v al ( + ) Lipid accumulation rates ( + ) Shell thickness ( + ) T almage and Gob ler (2010) M. mer cenaria Juv eniles (6.1 mm) 10 L (3) 10 (1) Stagnant (ev
ery 3 days, + antibi-otics) 24, 28 45 days Y es (1) pH NBS 8.1, 7.6 CO 2 400–400, 1665– 1737 ppm O A Shell gro wth (0) T issue gro wth (0) T emperature Shell gro wth ( − ) T issue gro wth (0) No additi v e ef fects T almage and Goble r (2011) Mer cenaria spp. Post-larv ae – juv eniles (0.39– 2.9 mm) 50 mL (1, 3, 4) 1–2 g (20–40 g) Stagnant (daily) 20 8 h Y es (1 +
Shell- fish diet)
pH
NBS
8.02,
7.64,
7.41 pCO
2 424, 1120, 1950 µatm Calcification rate ( − ), all sizes, smaller sizes more af fected, and at higher pH Dependent on hatchery popula-tions (h ybridized and pure Mer ce-naria ) W aldb usser et al. (2010) Mytilus califor -nianus California mus-sel Larv ae 2 L (6) 1000 (500) Stagnant (ev
6174 S. Andersen et al.: Effect of increasedpCO2level on early shell development in great scallop
T
able
2.
Continued.
Species
Life
stage
(age/size)
V
olume
(
n
)
Stocking
density
(ind
L
−
1
)
Flo
w
or
stagnant
(w
ater
ex-change)
T
emp.
◦
C
(Salinity)
Duration
F
ood
supply
(spp)
O
A
T
reatment
Ef
fects:
Ne
g
ati
v
e
(
−
)
None
(0)
Positi
v
e
(
+
)
Reference
Mytilus
edulis
blue
mussel
Embryo
(0
d)
130
L
(3)
(10
000)
Stagnant
16.2–
16.7
(31.9–
32.1)
2
days
No
pH
NBS
8.1
(46
0–
640
µatm),
pH
7.8
(1100–1200
µatm),
pH
7.6
(460–640
µatm)
Shell
length
(
−
)
Shell
thickness
(
−
)
Hatching
rate
(0)
Gazeau
et
al.
(2010)
M.
edulis
Larv
ae
(2
d)
130
L
(3)
(10
000)
Flo
w
19.2,19.5
(31.4,
31.5)
13
days
Y
es
(2–3)
pH
NBS
8.1,
7.8
Shell
length
and
thickness
(
−
)
Survi
v
al
(0)
Gazeau
et
al.
(2010)
M.
edulis
(20
%
h
ybrid
with
Mytilus
tr
ossulus
)
Post-larv
ae
500
mL
(7)
100
(200)
Stagnant
(400
mL
daily)
17
7
weeks
Y
es
(1)
p
CO
2
470,
1020,
2110,
3350
µatm
3
food
le
v
els
O
A
Shell
size
(
−
)
Survi
v
al
(0)
Calcification
(
−
)
Or
g
anic
gro
wth
(0)
F
ood
Shell
size
(
+
)
Survi
v
al
(0)
Calcification
(
+
)
Or
g
anic
gro
wth
(
+
)
Explained
most
of
the
v
ariation
Thomsen
et
al.
(2013)
M.
edulis
Juv
eniles
–
Adults
(5.5,
13.3
mm)
16
L
(4)
Flo
w
(100
mL
min
−
1
)
13.8
(15)
8
weeks
Y
es
(1)
pH
NBS
8.13,
7.72,
7.26
p
CO
2
493,
1332,
3898
µatm
Shell
length
(
−
)
at
3898
µatm
Indi
vidual
arago-nite
platelet
thickness
(
−
)
at
3898
µatm
Aragonite
layer
thickness
(0)
Calcite
layer
thick-ness
(0)
Shell
dissolution
Inde
x
(
+
)
Shell
dissolution
area
(
+
)
Thomsen
et
al.
[image:14.595.73.525.66.723.2]S. Andersen et al.: Effect of increasedpCO2level on early shell development in great scallop 6175 T able 2. Continued. Species Life stage (age/size) V olume ( n ) Stocking density (ind L − 1) Flo w or stagnant (w ater exchange) T emp.
◦C (Salinity)
Duration F ood supply (spp) O A T reatment Ef fects: Ne g ati v e ( − ) None (0) Positi v e ( + ) Reference M. edulis Juv eniles (16.6– 17.6 mm) 18 L (4) 4 (0.22) Flo w (50 mL min − 1) 4.7–5.4 (16) 7 weeks Y es (1) p CO 2 mean 54, 117, 248, 385 P a pH NBS mean 8.05, 7.73, 7.43, 7.19 F ood 0.6 and 5.7 cells µL − 1 O A Shell gro wth ( − ) at 385 P a Internal shell disso-lution ( − ) no interactions F ood Shell gro wth ( + ) Inernal shell disso-lution ( + ) interactions? Melzner et al. (2011) M. edulis Juv eniles (45– 55 mm) 50 L (2) 32 (0.64) Flo w (60 mL min − 1)
16.03– 16.11 (35.13– 35.37)
60 days Y es (1) pH NBS 8.0, 7.8, 7.6, 6.5 Health (NRR as-say) ( − ) Beesle y et al. (2008) M. edulis Adults (76 mm) 16 L (2?) 6 (0.4) Flo w 12.5 (11.8) 14 days Y es (3) pH NBS 8.05, 7.89, 7.81, 7.70, 7.56, 7.08 p CO 2 464, 661, 789, 1046, 1480, 4254 µatm pH e ( − ) Haemolymph Mg 2 + (0) Haemolymph Ca 2 + (0) Thomsen et al. (2010) M. gallopr o
vin-cialis Mediterranean mussel
Embryos
50
mL
(6)
400 (<
S. Andersen et al.: Effect of increasedpCO2level on early shell development in great scallop 6177 T able 2. Continued. Species Life stage (age/size) V olume ( n ) Stocking density (ind L − 1) Flo w or stagnant (w ater exchange) T emp.
◦C (Salinity)
Duration F ood supply (spp) O A T reatment Ef fects: Ne g ati v e ( − ) None (0) Positi v e ( + ) Reference S. glomer ata D-v eligers (24 h) 60 L (1) 90 000 (1500) Flo w 26 8 days Y es (2) pH: 8.1, 7.8, 7.6 p CO 2 580, 1386, 3573 Survi v al ( − ) Gro wth ( − ) Shell morphology ( − ) Amount of empty shells ( − ) Shell surf ace char -acteristics ( − ) Larv al dry mass (0) W atson et al. (2009) S. glomer ata Umbonate (142 µm) 100 mL 250 (2500) Stagnant (daily) 18, 22, 26, 30 (35) 4 days Y es (3) p CO 2 375, 600, 750, 1000 µatm T emperature Size ( − ), not at 18 ◦C P ark er et al. (2010) S. glomer ata Pedi v eliger (264 µm) 100 mL 200 (2000) Stagnant (daily) 18, 22, 26, 30 (35) 4 days Y es (3) p CO 2 375, 600, 750, 1000 µatm T emperature Size ( − ), n ot at 18 and 26 ◦C P ark er et al. (2010) S. glomer ata Juv eniles (2.0 mm) 100 mL 15 (150) Stagnant (daily) 18, 22, 26, 30 (35) 4 days Y es (3) p CO 2 375, 600, 750, 1000 µatm T emperature Shell gro wth ( − ), more so at 18 and 22 ◦C P ark er et al. (2010) S. glomer ata Post-larv ae 120 mL (3) 30 (250) Stagnant (daily) 25 (35) 4 days Y es (3) p CO 2 375, 1000 ppm ∗ W ild and mass-selected populations (msp ), and families within msp Shell gro wth ( − ), msp were less af-fected, lar ge v aria-tions between fam-ilies P ark er et al. (2011) spp from bi v alvia NG 38 L (6) NG
Stagnant (filtration 600
S. Andersen et al.: Effect of increasedpCO2level on early shell development in great scallop 6179
4.3 Inter- and intra-species response and synergistic factors
In the present study scallop larvae showed a reduction in shell size, survival, and percentage of normally developed larvae from the ambient group to the highestpCO2 group (discussed in further detail in the sections below). These re-sponses to OA seem to vary little between bivalve species (Table 2). However, the magnitude of the response vary, al-though the pH window, temperature, and rearing volume used during experiments vary, and one should be careful in drawing conclusions about species-specific effects be-tween studies. Comparative studies of two (Sunday et al., 2011; Parker et al., 2010; Talmage and Gobler, 2010) or sev-eral species (Liu and He, 2012; Ries et al., 2009; Talmage and Gobler, 2009, 2011) mostly conclude that species have different sensitivity to OA. Within-species and between-population variation was reported by Parker et al. (2011) when they investigated differences between a wild popula-tion and selectively bred populapopula-tions in sensitivity to OA ex-posure. Their results indicated that sensitivity to rearing con-ditions may have been different between the populations, as growth rate in the ambient group was higher for the selected group. This may have overestimated the differences in sensi-tivity to OA exposure alone.
Many factors may contribute to a synergistic response of a species to OA exposure (Table 2). Some have been in-vestigated for early life stages of bivalves: food availability (Thomsen et al., 2010, 2013; Melzner et al., 2011), tempera-ture (Brennand et al., 2010; Courtney et al., 2013; Parker et al., 2010; Talmage and Gobler, 2011), salinity (Dickinson et al., 2012), parental exposure to OA (Parker et al., 2012), fer-tilization under OA conditions (Parker et al., 2010), and ge-netic selection (populations or families, Parker et al., 2011, 2012). Additionally, there are other external factors that have not yet been investigated that may impact OA effects through reducing or improving the energy level: rearing volume, diet, day length, UV radiation, etc.
A large part of the work undertaken to investigate effects of OA on marine mollusc larvae has been carried out in volumes of 50 mL–200 L (Table 2). Wernberg et al. (2012) points out that it may be problematic that so many experi-mental studies of ocean acidification effects are undertaken in relatively small volumes. Although the larvae are small in size, small rearing volumes may not give a sufficiently sta-ble rearing environment, and result in negative environmen-tal stress. The volume of exposure tanks in the present study was 38 L, and we cannot rule out that these tanks are too small to keep variations in the rearing environment at a low level. However, the low variation in survival in the control group indicates that the experimental conditions were within acceptable limits.
None of the studies conducted on bivalve larvae are di-rectly comparable with the present study (Table 2). When pCO2 was relatively similar, the experiments were
con-ducted in stagnant systems with different rearing volumes and densities, or the larvae were fed. As discussed above, all these factors may be synergistic. Larvae in our experiment were reared from eggs of one individual and sperm from three different individuals (i.e. three half-sibling groups) af-ter being well mixed and distributed in equal densities in the experimental tanks. We assume that the half-sibling groups were distributed more or less equally in the tanks, and the variation we found between tanks is most likely not a result of family differences (intra-species differences).
4.4 Larvae survival
The survival of day-7 veligers for the ambient group repli-cates in this study was 25–46 %. In comparison, the aver-age survival of day-3 veligers (referred to as hatching) in a Norwegian hatchery was 36.7 % of 12 broodstock groups (Magnesen et al., 2006). This indicates that the larval group used in the present study was viable and healthy. In the treatment groups, median survival was reduced by 41–74 %, which was much higher compared to larvae of hard clam (M. mercenaria), bay scallop (A. irradians), and eastern oyster (C. virginica) (Talmage and Gobler, 2009). The highest re-duction in survival on day 6 for these larvae was 20 % for the oyster larvae at 64 and 150 Pa CO2 (pH 7.83–7.85 and pH 7.48–7.50, respectively) when ambient conditions were 36 Pa (pH 8.02–8.08). A study on abalone larvae (Haliotis kamtschatkana) showed that both survival and growth were reduced by 40 % on day 8, when CO2was elevated from an ambient 400 ppm up to 800 ppm (Crim et al., 2011). These variations in survival may indicate inter-species differences, but we cannot rule out that the variation at least partly may be a result of the differences in experimental design (culture volume, water regime, feeding regime).
In an OA study on the Pacific oyster, C. gigas, Gazeau et al. (2011) manipulated theATlevels in one of their treatment groups and showed that the saturation level of CO23−had a more severe effect on development and shell growth in oys-ter embryos than did the pH orpCO2level. However, none of the other OA experiments on bivalve larvae have manipu-lated theATlevel, and thus elevatedpCO2levels seem to be the most plausible cause of reduced survival in these studies. Although survival of bivalve larvae in OA studies shows a significant variation, a clear trend of a negative effect due to elevatedpCO2levels or lower pH is found (Table 2). Of six studies calculating survival on larvae, all reported a negative effect on survival (Table 2).
4.5 Larvae shell size
stud-6180 S. Andersen et al.: Effect of increasedpCO2level on early shell development in great scallop
ies (Table 2). Gaylord et al. (2011) found that when CO2 concentration increased from ambient 380 to 970 ppm, the shell area of mussel larvae (Mytilus californianus) on day 5 and day 7 was reduced by 7 and 5 %, respectively. Kuri-hara et al. (2007) showed the shell length of oyster (C. gi-gas) larvae after 48 h to be ca. 20 % smaller at a pCO2 of 2268 µatm (pH 7.42) than at the ambient 348 µatm (pH 8.21). Kurihara et al. (2008) also found that the shell length of Mytilus galloprovincialis larvae was reduced by about 20 % after six days when pH was reduced from the ambient 8.05 (14.3 µmol CO2kg−1)to 7.43 (83.3 µmol CO2kg−1). Parker et al. (2010) found a synergistic effect of elevated pCO2 and suboptimal temperatures on larvae size of the two oyster species Saccostrea glomerata and C. gigas, the first being the most sensitive to the exposure.
The reduction in shell growth found in the present study was at the lower end of the scale compared to other stud-ies. This may reflect an inter-species difference, and indicates that P. maximus shell growth is not the most sensitive to OA compared to other bivalves. However, the high reduction in survival may indicate that other physiological processes are highly affected by OA. The duration of the study was only seven days, and keeping the scallop larvae in the same con-ditions throughout the larval cycle will allow for elucidation of how OA affects growth, survival, and the critical metamor-phosis over a longer term.
4.6 Shell deformities
In the present study the percentage of normally developed larvae on day 7 was 64 % in the control group. The common ratio of normal shell development in P. maximus larvae has been poorly described and is not known. In a control group of oyster (C. gigas) larvae, Kurihara et al. (2007) described that 68 % developed into normal D-shaped veligers, and 72 % of these larvae had fully mineralized shells after 48 h. This was explained as rather low values for the control group, and was supposed to be a result of using gonadal stripping to produce the embryos. In a study on M. galloprovincialis, Kurihara et al. (2008) reported abnormal morphology in<1 % of control larvae, showing that the variation in percentage of normally developed larvae may vary between species, although other conditions may play a significant role.
The percentage of deformed larvae varied highly between the treatments in our study, and the results showed a tendency of more shell deformities with increasingpCO2levels. The negative effects observed have been reported also in other OA studies on bivalves (Table 2). Watson et al. (2009) found that in 8-day-old S. glomerata larvae, both shell morphology and shell surface characteristics were negatively affected by reduced pH (7.8 and 7.6). Talmage and Gobler (2010) found that the level of CO2 strongly affected the development of the hinge structure in larvae of M. mercenaria and A. irradi-ans using CO2levels of 250 (pre-industrial), 390 (ambient), 750, and 1500 ppm. They found a decline in size, integrity,
and connectedness of the hinge with increasing CO2levels. As the authors pointed out, the hinge facilitates opening and closing of the shell, which again is crucial for both feeding and excretion. Losing the ability to perform these basic func-tions most certainly has a negative effect on larval survival. In the present study, the higher percentage of normally de-veloped hinges on day 7 compared to day 2 in all larvae groups was most likely a result of increased mortality of ab-normal larvae from day 2 to 7. The final sample at the end of the experiment did not show a high amount of deformed empty shells to confirm this assumption. However, empty lar-vae shells are extremely fragile and dissolve fast (and even faster in low-pH water), which may explain why we did not find high numbers of them in the final samples. In future ex-periments, more frequent sampling may reveal whether the deformed larvae die off throughout the experimental period.
It is known that other factors like self-fertilization, high egg : sperm ratio, temperature, and pollutants may cause an increase in larval deformities (Conroy et al., 1996; Spangen-berg and Cherr, 1996; His et al., 1997; Krassoi et al., 1997, Concha et al., 2011; Kobayashi and Kijima, 2010). It has also been reported that factors in the rearing environment such as small rearing volumes, stagnant systems, addition of antibi-otics, or pulse feeding may cause larvae deformities in con-trol groups (Kurihara et al., 2007, 2008; Talmage and Gob-ler, 2009, 2010, 2011; Waldbusser et al., 2010; Gaylord et al., 2011; Gazeau et al., 2011). Although we cannot rule out the effect of small rearing volumes, other factors should play a minor role in the present study as we cross-fertilized the eggs to minimize the amount of self-fertilization, egg : sperm ratio was within the recommended numbers (Martinez et al., 2007; S. Andersen, personal communication, 2012), temper-ature was within the optimum range (Davenport et al., 1975), we used a flow-to-waste system, and no antibiotics or feed were added.
The ambient water used for the control group in the present study had a pH of 7.98, which was 0.19 units lower than the pH values Talmage and Gobler (2010) used when mimicking the pre-industrial level to investigate past, present and future ocean CO2concentrations. They found improved results at pre-industrial pH levels compared to ambient pH levels of 8.05 and 8.04. The shell deformities we found in our control group may therefore at least partly be a result of an already elevated CO2level; thus future studies on P. maximus should include experimental groups kept in pre-industrial CO2 con-ditions to elucidate whether the ongoing OA already may have an impact on scallop larvae.
S. Andersen et al.: Effect of increasedpCO2level on early shell development in great scallop 6181
by handling the samples, calculating the amount of hinge de-formity is probably a better estimate of abnormalities in our study.
4.7 Calcification
In the present study we confirmed that calcein bonded to the calcium in 1–2-day-old trochophore larvae, confirming sim-ilar timing for calcification in P. maximus larvae as in larvae of M. mercenaria and C. gigas (Weiss et al., 2002), but at an earlier stage than was suggested by Cass et al. (1998) and Cragg (2006). We were unable to determine the exact time of initiation of calcification in the larvae since the staining period was 18–20 h. Staining embryos and larvae frequently (e.g. every 5 h) for a shorter period (e.g 3 h) from day 0 to day 2 may reveal more details on the exact onset of the calci-fication process. Comeau et al. (2009) used calcein staining of the pteropod Limacina helicina to compare shell extension in animals held atpCO2levels of 350 and 760 µatm over a period of five days. Although too few organisms were used to get statistically robust quantitative estimations, the results showed that shell extension in pteropods held at the highest pCO2levels were lower compared to those held at 350 µatm. Future OA experiments on P. maximus larvae should eluci-date whether calcein staining can be used to calculate calcifi-cation either as shell extension or size of shell area in larvae held at differentpCO2levels.
4.8 Concluding remarks and future work
The rather severe effects of elevated futurepCO2levels on a number of bivalve larvae seem undisputable (Table 2). Tal-mage and Gobler (2010) showed that the CO2levels of to-day may already affect bivalve larvae negatively compared to pre-industrial levels, and hence, negative effects of OA are happening today rather than in the future. Also, OA should be seen in combination with the increase in global ocean tem-perature (Blunden and Arndt, 2013). Effects of a temtem-perature increase may amplify the OA effects or reduce them. Tal-mage and Gobler (2011) showed that the negative effects of elevated CO2and temperature on larvae were additive.
Long-term studies on larvae of the great scallop P. max-imus are needed to elucidate the effect of OA throughout the larvae stages, metamorphosis, and settlement, and also the potential of an evolutionary response in larval development rate. Such studies should involve assessment of the energy budget, take place in facilities that allow a normal develop-ment, and include studies on temperature effects. Effects on important processes for survival, such as immune defence functions, feeding rate, and shell mass and strength should also be investigated. More studies using calcein at the earli-est larvae stages (day 0–2) are needed to increase knowledge about the onset of the larval shell calcification process, which is crucial to the existence of calcifying organisms.
Supplementary material related to this article is available online at http://www.biogeosciences.net/10/ 6161/2013/bg-10-6161-2013-supplement.pdf.
Acknowledgements. We thank Ørjan Karlsen for helpful assistance with statistics, and the staff at the Institute of Marine Research – Austevoll Research Station for rearing broodstock, producing algal feed, mixing chemical solutions, and assisting in photographic work. This study was supported by the Institute of Marine Research through project number 13192-04, Ocean Acidification – Scallops.
Edited by: D. Schmidt
References
Andersen, S., Christophersen, G., and Magnesen, T.: Spat produc-tion of the great scallop (Pecten maximus): a roller coaster, Can. J. Zool., 89, 585–604, doi:10.1139/z11-035, 2011.
Andersen, S., Christophersen, G., and Magnesen, T.: Implica-tions of larval diet concentration on post-larval yield in a production scale flow through system for scallops (Pecten maximus Lamarck) in Norway, Aquacult. Int., 15, 1–18, doi:10.1007/s10499-012-9570-0, 2012.
Barros, P., Sobral, P., Range, P., Chícharo, L., and Matias, D.: Ef-fects of sea-water acidification on fertilization and larval devel-opment of the oyster Crassostrea gigas, J. Exp. Mar. Biol. Ecol., 440, 200–206, doi:10.1016/j.jembe.2012.12.014, 2013. Bechmann, R. K., Taban, I. C., Westerlund, S., Godal B. F.,
Arn-berg, M., Vingen, S., Ingvarsdottir, A., and Baussant, T.: Effects of ocean acidification on early life stages of shrimp (Pandalus borealis) and mussel (Mytilus edulis), J. Toxicol. Env. Heal. A, 74424–74438, doi:101080/15287394.2011.550460, 2011. Beesley, A., Lowe, D. M., Pascoe, C. K, and Widdicombe, S.:
Effects of CO2-induced seawater acidification onthe health of
Mytilus edulis, Clim. Res., 37, 215–225, doi:10.3354/cr00765, 2008.
Bellioli, G., Lohrman, K., and Dupré, E.: Larval morphology of the scallop Argopecten purpuratus as revealed by scanning electron microscopy, The Veliger, 36, 332–342, 1993.
Beniash, E., Ivanina, A., Lieb, N. S., Kurochkin, I., and Sokolova, I. M.: Elevated level of carbon dioxide affects metabolism and shell formation in oysters Crassostrea virginica, Mar. Ecol.-Prog. Ser., 419, 95–108, doi:10.3354/meps08841, 2010.
Blackford, J. C. and Gilbert, F. J.: pH variability and CO2induced
acidification in the North Sea, J. Marine Syst., 64, 229–241, doi:10.1016/j.jmarsys.2006.03.016, 2007.
Blunden, J. and Arndt, D. S.: State of the climate in 2012, B. Am. Meteorol. Soc., 94, S1–S258, 2013.
Bourne, N. F.: The potential for scallop culture – the next mille-nium, Aquacult. Int., 8, 113–122, 2000.
6182 S. Andersen et al.: Effect of increasedpCO2level on early shell development in great scallop
Byrne, M.: Global change ecotoxicology: Identification of early life history bottlenecks in marine invertebrates, variable species responses and variable experimental approaches, Mar. Environ. Res, 76, 3–15, doi:10.1016/j.marenvres.2011.10.004, 2012. Caldeira, K. and Wickett, M. E.: Anthropogenic carbon and ocean
pH, Nature, 425, 365, 2003.
Casse, N., Devauchelle, N., and Le Pennec, M.: Embryonic shell formation in the scallop Pecten maximus (Linnaeus), Veliger, 41, 133–141, 1998.
Chan, K. Y., Grünbaum, K. D., and O’Donnell, M.: Effects of ocean-acidification-induced morphological changes on lar-val swimming and feeding, J. Exp. Biol., 214, 3857–3867, doi:10.1242/jeb.054809, 2011.
Chaparro, O. R., Montory, J. A., Segura, C. J., and Pechenik, J. A.: Effect of reduced pH on shells of brooded veligers in the estuarine bivalve Ostrea chilensis (Philippi, 1845), J. Exp. Mar. Biol. Ecol., 377, 107–112, doi:10.1016/j.jembe, 2009.
Chick, R. C.: Batch tagging blacklip abalone (Haliotis rubra) for identification of harchery-reared individuals on natural coastal reefs in New South Wales, Australia, J. Shellfish Res., 29, 209– 215, 2010.
Comeau, S., Gorsky, G., Jeffree, R., Teyssié, J.-L., and Gattuso, J.-P.: Impact of ocean acidification on a key Arctic pelagic mollusc (Limacina helicina), Biogeosciences, 6, 1877–1882, doi:10.5194/bg-6-1877-2009, 2009.
Comeau, S., Gorsky, G., and Gattuso, J.-P.: Larvae of the pteropod Cavolinia inflexa exposed to aragonite undersaturation are viable but shell-less, Mar. Biol., 157, 2341–2345, 2010.
Comely, C. A.: Larval culture of the scallop, Pecten maximus, J. Cons. Int. Explor. Mer., 34, 365–378, 1972.
Concha, C., Figueroa, E., and Winkle, F. M.: Association between self-fertilization rates and the frequency of malformed larvae in farmed populations of the northern scallop Argopecten purpu-ratus (Lamarck, 1819), Lat. Am. J. Aquat. Res., 39, 327–337, doi:10.3856/vol39-issue2-fulltext-14, 2011.
Conroy, P. T., Hunt, J. W., and Anderson, B. S.: Validation of a short-term toxicity test endpoint by comparison with longer-term effects on larval red abalone Haliotis rufescens, Env. Toxicol. Chem., 15, 1245–1250, doi:10.1897/1551-5028(1996)015<1245:voastt>2.3.co;2, 1996.
Courtney, T., Westfield, I., and Ries, J. B.: CO2-induced ocean
acidification impairs calcification in the tropical urchin Echi-nometra viridis, J. Exp. Mar. Biol. Ecol., 440, 169–175, doi:10.1016/j.jembe.2012.11.013, 2013.
Cragg, S. M.: Development, physiology, behavior, and ecology of scallop larvae, 45–122. In Scallops: Biology, ecology, and aqua-culture, edited by: Shumway, S. E. and Parsons, G. J., Elsevier, 2006.
Crim, R. N., Sunday, J. M., and Harley, C. D. G.: Elevated sea-water CO2 concentrations impair larval development and
re-duce larval survival in endangered northern abalone (Haliotis kamtschatkana), J. Exp. Mar. Biol. Ecol., 400, 272–277, 2011. Day, R. W., Williams, M. C., and Hawkes, G. P.: A comparison of
fluorochromes for marking abalone shells, Mar. Freshwater Res., 46, 599–605, 1995.
Davenport, J., Gruffydd, L. D., and Beaumont, A. R.: An apparatus to supply water of fluctuating salinity and its use in a study of the salinity tolerances of larvae of the scallop Pecten maximus L., J. Mar. Biol. Assoc. UK, 55, 391–409, 1975.
Desrosiers, R. R., Désilets, J., and Dubé, F.: Early developmen-tal events following fertilization in the giant scallop Placopecten magellanicus, Can. J. Fish. Aquat. Sci., 53, 1382–1392, 1996. Dickinson, G. H., Ivanina, A. V., Matoo, O. B., Pörtner, H. O.,
Lannig, G., Bock, C., Beniash, E., and Sokolova, I. M.: Inter-active effects of salinity and elevated CO2 levels on juvenile
eastern oysters, Crassostrea virginica, J. Exp. Biol., 215, 29–43, doi:10.1242/jeb.061481, 2012.
Dupont, S., Ortega-Martínez, O., and Thorndyke, M.: Impact of near-future ocean acidification on echinoderms, Ecotoxicology, 19, 449–462, doi:10.1007/s10646-010-0463-6, 2010.
Ericson, J. A., Lamare, M. D., Morley, S. A., and Barker, M. F.: The response of two ecologically important Antarctic invertebrates (Sterechinus neumayeri and Parborlasia corrugates) to reduced seawater pH: effects on fertilization and embryonic development, Mar. Biol., 157, 2689–2702, 2010.
Fabry, V. J., Seibel, B. A., Feely, R. A., and Orr, J. C.: Impacts of ocean acidification on marine fauna and ecosystem processes, ICES J. Mar. Sci., 65, 414–432, 2008.
FAO: Food and Agriculture Organization of the United Nations, Fisheries and Aquaculture Information and Statistics Service, Rome, Italy, 2010.
Fitzpatrick, M. P., Jeffs, A. G., and Dunphy, B. J.: Identifica-tion of the optimal fluorochrome for marking larvae of the pul-monate limpet Siphonaria australis, J. Shellfish Res., 29, 941– 944, doi:10.2983/035.029.0427, 2010.
Gaylord, B., Hill, T. M., Sanford, E., Lenz, E. A., Jacobs, L. A., Sato, K. N., Russell, A. D., and Hettinger, A.: Functional im-pacts of ocean acidification in an ecologically critical foundation species, J. Exp. Biol., 214, 2586–2594, doi:10.1242/jeb.055939, 2011.
Gazeau, F., Gattuso, J.-P., Dawber, C., Pronker, A. E., Peene, F., Peene, J., Heip, C. H. R., and Middelburg, J. J.: Effect of ocean acidification on the early life stages of the blue mussel Mytilus edulis, Biogeosciences, 7, 2051–2060, doi:10.5194/bg-7-2051-2010, 2010.
Gazeau, F., Gattuso, J.-P., Greaves, M., Elderfield, H., and Peene, J.: Effect of Carbonate Chemistry Alteration on the Early Em-bryonic Development of the Pacific Oyster (Crassostrea gi-gas), PLoS ONE, 6, e23010, doi:10.1371/journal.pone.0023010, 2011.
Hall-Spencer, J. M., Rodolfo-Metalpa, R., Martin S., Ran-some, E., Fine, M., Turner, S. M., Rowley, S. J., Tedesco, D., and Buia, M.-C.: Volcanic carbon dioxide vents show ecosystem effects of ocean acidification, Nature, 454, 96–99, doi:10.1038/nature07051, 2008.
His, E., Seaman, M. N. L., and Beiras, R.: A simplification the bi-valve embryogenesis and larval development bioassay method for water quality assessment, Water Res., 31, 351–355, 1997. Hoegh-Guldberg, O., Mumby, P. J., Hooten, A. J., Steneck, R. S.,
S. Andersen et al.: Effect of increasedpCO2level on early shell development in great scallop 6183
Dai, X., Maskell, K., and Johnson, C. A., Cambridge University Press, Cambridge, UK and New York, NY, USA, 881 pp., 2001. Jury, C. P., Whitehead, R. F., and Szmant, A. M.: Effects of variations in carbonate chemistry on the calcification rates of Madracis auretenra (= Madracis mirabilis sensu Wells, 1973): bicarbonate concentrations best predict calcification rates, Glob. Change Biol. 16, 1632–1644, doi:10.1111/j.1365-2486.2009.02057.x, 2010.
Kerrison, P., Hall-Spencer, J. M., Suggett, D. J., Hepburn, L. J., and Steinke, M.: Assessment of pH variability at a coastal CO2vent for ocean acidification studies, Estaur. Coast. Shelf S., 94, 129– 137, doi:10.1016/j.ecss.2011.05.025, 2011.
Kobayashi, T. and Kijima, A.: Effects of inbreeding depression in Pacific abalone Haliotis discus hannai, J. Shellfish Res., 29, 643– 649, 2010.
Kudo, M., Kameda, J., Saruwatari, K., Ozaki, N., Okano, K., Naga-sawa, H., and Kogure, T.: Microtexture of larval shell of oyster, Crassostrea nippona: A FIB-TEM study, J. Struct. Biol., 169, 1– 5, doi:10.1016/j.jsb.2009.07.014, 2010.
Kurihara, H.: Effects of CO2-driven ocean acidification on the early
developmental stages of invertebrates, Mar. Ecol.-Prog. Ser., 373, 275–284, doi:10.3354/meps07802, 2008.
Kurihara, H., Kato, S., and Ishimatsu, A.: Effects of increased sea-waterpCO2on early development of the oyster Crassostrea
gi-gas, Aquat. Biol., 1, 91–98, doi:10.3354/ab00009, 2007. Kurihara, H., Asai, T., Kato, S., and Ishimatsu, A.: Effects of
el-evatedpCO2on early development in the mussel Mytilus
gal-loprovincialis, Aquat. Biol., 4, 225–233, doi:10.3354/ab00109, 2008.
Körbl, J. and Vydra, F.: Metallochromic indicators. IV. A note on the preparation and properties of “calcein”, Collect. Czech Chem. C., 23, 622–627, 1958.
Krassoi, R., Anderson, I., and Everett, D.: Larval abnormalities in doughboy scallops Chlamys (mimachlamys) asperrima L. In response to test conditions and six reference toxicants, Aus-tralasian Journal of Ecotoxicology, 3, 65–74, 1997.
Kroeker, K. J., Kordas, R. L., Crim, R. N. and Singht, G. G.: Meta-analysis reveals negative yet variable effects of ocean acidifica-tions on marine organisms, Ecol. Lett., 13, 1419–1434, 2010. Le Pennec, M., Paugam, A., and Le Pennec, G.: The pelagic life
of pectinid Pecten maximus – a review, ICES J. Mar. Sci., 60, 211–223, 2003.
Liu, W. and He, M.: Effects of ocean acidification on the metabolic rates of three species of bivalve from southern coast of China, Chin. J. Oceanol. Limn., 30, 206–211, doi:10.1007/s00343-012-1067-1, 2012.
Lucas, T., Palmer, P. J., Wang, S., Scoones, R., and O’Brien, E.: marking the shell of the saucer scallop Amusium balloti for sea ranching using oxytetracycline, calcein and Alizarin red, J. Shell-fish Res., 27, 1183–1188, 2008.
Mackie, G. L.: Bivalves, in: The Mollusca, 7, Reproduction, edited by: Trompa, A. S., Verdonk, N. H., and Van Den Biggelaar, J. A. M., Academic Press, San Diego, 351–403, 1984.
Magnesen, T., Bergh, Ø., and Christophersen, G.: Yields of great scallop, Pecten maximus, larvae in a commercial flow-through system in Norway, Aquacult. Int., 14, 377–394, 2006.
Martinez, G., Mettifogo, L., Perez, M. A., and Callejas, C.: A method to eliminate self-fertilization in a simultane-ous hermaphrodite scallop. 1. Effects on growth and
sur-vival of larvae and juveniles, Aquaculture, 273, 459–469, doi:10.1016/j.aquaculture.2007.10.033, 2007.
Melzner, F., Stange, P., Trübenbach, K., Thomsen, J., Casties, I., Panknin, U., Gorb, S. N., and Gutowska, M. A.: Food Supply and Seawater pCO2Impact Calcification and Internal Shell
Dissolu-tion in the Blue Mussel Mytilus edulis, PLoS ONE, 6, e24223, doi:10.1371/journal.pone.0024223, 2011.
Moran, A. L.: Calcein as a marker in experimental stud-ies newly-hatched gastropods, Mar. Biol., 137, 893–898, doi:10.1007/s002270000390, 2000.
Moran, A. L. and Marko, P. B.: A simple technique for physical marking of larvae of marine bivalves, J. Shellfish Res., 24, 567– 571, 2005.
Orr, J. C., Fabry, V. J., Aumont, O., Bopp, L., Doney, S. C., Feely, R. A., Gnanadesikan, A., Gruber, N., Ishida, A., Joos, F., Key, R. M., Lindsay, K., Maier-Reimer, E., Matear, R., Mon-fray, P., Mouchet, A., Najjar, R. G., Plattner, G.-K., Rodgers, K. B., Sabine, C. L., Sarmiento, J. L., Schlitzer, R., Slater, R. D., Totterdell, I. J., Weirig, M.-F., Yamanaka, Y., and Yool, A.: Anthropogenic ocean acidification over the twenty-first century and its impact on calcifying organisms, Nature, 437, 681–686, doi:10.1038/nature04095, 2005.
Pane, E. F. and Barry, J. P.: Extracellular acid-base regulation during short-term hypercapnia is effective in a shallow-water crab, but ineffective in a deep-sea crab, Mar. Ecol.-Prog. Ser., 334, 1–9, 2007.
Parker, L. M., Ross, P. M., and O’Connor, W. A.: Comparing the ef-fect of elevatedpCO2and temperature on the fertilization and early development of two species of oysters, Mar. Biol., 157, 2435–2452, doi:10.1007/s00227-010-1508-3, 2010.
Parker, L. M., Ross, P. M., and O’Connor, W. A.: Popula-tions of the Sydney rock oyster, Saccostrea glomerata, vary in response to ocean acidification, Mar. Biol., 158, 689–697, doi:10.1007/s00227-010-1592-4, 2011.
Parker, L. M., Ross, P. M., O’Connor, W. A., Borysko, L., Raftos, D. A., and Pörtner, H.-O.: Adult exposure influences offspring response to ocean acidification in oysters, Glob. Change Biol., 18, 82–92, doi:10.1111/j.1365-2486.2011.02520.x, 2012. Pierrot, D. E., Lewis, D. W., and Wallace, R.: MS Excel Program
Developed for CO2 System Calculations,
ORNL/CDIAC-105a. Carbon Dioxide Information Analysis Center, Oak Ridge National Laboratory, US Department of Energy, Oak Ridge,
Ten-nessee, doi:10.3334/CDIAC/otg.CO2SYS_XLS_CDIAC105a,
2006.
Range, P., Chícharo, M. A., Ben-Hamadou, R., Piló, D., Matias, D., Joaquim, S., Oliveira, A. P., and Chíchar, L.: Calcification, growth and mortality of juvenile clams Ruditapes decussatus un-der increasedpCO2and reduced pH: Variable responses to ocean
acidification at local scales?, J. Exp. Mar. Biol. Ecol., 396, 177– 184, doi:10.1016/j.jembe.2010.10.020, 2011.
Raven, J., Caldeira, K., Elderfield, H., Hoegh-Guldberg, O., Liss, P., Riebesell, U., Sheperd, J.,Turley C., and Watson, A.: Ocean acidification due to increasing atmospheric carbon dioxide, The Royal Society. 2005.
Ries, J. B., Cohen, A. L., and McCorkle, D. C.: Marine calcifiers exhibit mixed responses to CO2-induced ocean acidification,
Ge-ology, 37, 1131–1134, doi:10.1130/G30210A.1, 2009.