Health Statistics NSW: getting the right balance
between privacy and small numbers
in a web-based reporting system
James P. Scandol
A,Band Helen A. Moore
A ACentre for Epidemiology and Research, NSW Ministry of Health BCorresponding author. Email: [email protected]. gov.au
Abstract: Health Statistics NSW is a new
web-based application developed by the Centre for Epidemiology and Research at the NSW Ministry of Health. The application is designed to be an efficient vehicle for the timely delivery of health statistics to a diverse audience including the general public, health planners, researchers, students and policy analysts. The development and implementa-tion of this web applicaimplementa-tion required the consider-ation of a series of competing demands such as: the public interest in providing health data while main-taining the privacy interests of the individuals whose health is being reported; reporting data at spatial scales of relevance to health planners while maintaining the statistical integrity of any infer-ences drawn; the use of hardware and software systems which are publicly accessible, scalable and robust, while ensuring high levels of security. These three competing demands and the relation-ships between them are discussed in the context of Health Statistics NSW.
Health Statistics NSW (HSNSW, www.healthstats.nsw. gov.au) is a new web-based reporting application
developed by the Centre for Epidemiology and Research, New South Wales (NSW) Ministry of Health. This appli-cation was developed to replace the electronic version of the report Health of the people of NSW—Report of the Chief Health Officer (known as the eCHO report) which has been published as a web-based report since 2000 and as a printed report since 1996. The main incentives for converting the eCHO report, which consisted of a series of around 1000 static web pages, into an interactive web-based application were:
• to assist users find specific information through improved search and navigation functions
• to assist users download data and reports through improved download and report compilation functions • to expand the content, update data and maintain the report
through the use of modern business intelligence software, infrastructure and technology.
Many Australian (Australian Institute of Health and Welfare, aihw.gov.au, Public Health Information Develop-ment Unit, www.publichealth.gov.au and the Australian Bureau of Statistics, www.abs.gov.au) and overseas health agencies (US Centers for Disease Control and Prevention www.cdc.gov/DataStatistics/ and the World Health Organi-zation, www.who.int/research/en/) now incorporate some type of web-based data query system into their main agency website.1The rapid development of web-based technologies in the past 20 years has seen such sites evolve from simple tables of data to hosting complex web-based applications that allow significant user interaction including the produc-tion of dynamically generated graphs and maps. For example, new map-based reports using InstantAtlasTM (www.instantatlas.com) are used by the Victorian Depart-ment of Health (www.health.vic.gov.au/healthstatus/atlas/) and to report the Australian Early Development Index (maps.aedi.org.au/IA/2011/region/105/atlas.html).
Vol. 23(1–2) January–February 2012
ISSN 1034 7674
NSW PUBLIC HEALTH
BULLETIN
This trend of improving the technologies that support these types of websites is likely to continue into the foreseeable future with significant investment into the Australian internet infrastructure by both private and public institu-tions (for example the Australian National Broadband Network, www.nbnco.com.au).
This article describes the three competing demands that were considered when designing the HSNSW application, configuring the content and then deploying a system which was suitable for release to the public. These demands were: consideration of the public versus the private interest when reporting health statistics; recognition of statistical signals versus noise when reporting at small spatial scales and on rare conditions; and building data systems that are secure but still highly accessible. An expanded consideration of these issues was presented in the reportPrivacy issues and the reporting of small numbers.2
1. Public versus private interest
The implementation of evidence-based policies and planning for health services requires the collection and management of data. Development of performance indi-cators from these data supports our understanding of whether particular policies and programs are achieving their goals; there is also significant public interest in performance reporting. Further, all levels of government require the use of timely data for the planning of clinical and public health services.3,4In the field of health how-ever, we must be particularly cognisant that these data are collected from individuals and that there are significant legal and ethical reasons why the privacy of these indivi-duals cannot be compromised. Consequently the over-arching challenge when presenting health statistics is to develop robust reporting strategies that ensure that both private and public interests are met.
Within the NSW health system, the key legislative instru-ments to protect the privacy of citizens are thePrivacy and Personal Information Protection Act 1998(NSW) which regulates personal information in the public sector; and the Health Records and Information Privacy Act 2002(NSW) which regulates personal health information. TheHealth Records and Information Privacy Act 2002is supported by detailed statutory guidelines which cover particular appli-cations of health data. All relevant laws and policies are explained in theNSW Health Privacy Manual.5
A critical aspect of privacy legislation when using health data is the de-identification of the data. De-identification in the context of public reporting must be interpreted more broadly than simply removing names and addresses from records because it is about the potential of re-identifying an individual from the final publication of that data. The steps required for effective de-identification in this context are not necessarily simple and require consideration of the
condition being reported and the population from which observations are drawn. Much emphasis in public report-ing is usually placed on the number of people reported and simple threshold rules are defined. However, expert groups such as the Statistical Information Management Committee6argue that the size of the underlying popula-tion (which may be defined as the populapopula-tion in one geographic area or a sub-group such as the Aboriginal population) becomes more important when the probability of re-identification is considered.
Consequently when HSNSW was configured, standard rules were used to guard against re-identification (such as designing tables to minimise the number of cells with denominators less than 1000 people and individual counts less than five people). Such steps are crucial to ensure that private interests are not compromised to achieve the public interests associated with statistical reporting.
2. Data signals versus noise
HSNSW includes partial functionality to drill down into increasing levels of data granularity (the fineness with which data fields are subdivided). For example, when looking at hospitalisation admissions, it is possible to examine the pattern of these admissions across Local Health Districts, or to develop a time series of admissions for a particular Local Health District. This functionality was included because many potential users of the system requested straightforward access to data about their Local Health District. This approach works well but it very rapidly becomes apparent that there are limitations to how far you can drill down into the data before the numbers of individuals being reported become too small to meet two important criteria: privacy and statistical interpretability. Firstly, as noted above, there are privacy issues that cannot be compromised. Secondly, as Steel and co-workers dis-cuss,7 small numbers are subject to much larger relative variation over time or between groups, which makes any inferences drawn from these numbers less reliable. It is important to recall that the reason these statistics are being reported in the first place is the public interest associated with evidence-based policy and decision making. If the inferential value of these data is degraded, then the justification for their publication can become compromised.
Perhaps the most transparent approach to this issue is to estimate the variability of any published statistics (which may require additional statistical assumptions). If the relative variability exceeds some particular threshold, then such statistics should not be published. Where practical, this approach was used in HSNSW, but in other cases, simple techniques such as averaging or more sophisticated statistical methods such as Bayesian smoothing8were used to ensure that patterns, and not observations from indivi-duals, were being presented. Judgments based upon
threshold rules of sample size and relative variability, which were checked by subject matter experts, were used when configuring indicators for HSNSW to ensure that there were adequate data for any meaningful statistical inferences. Options to drill down into these data were not provided if such subsets of the data were subject to excessive variability (e.g. for mesothelioma deaths, which are very rare events). If analysts, planners or policy developers require such data then there are alternative options for accessing this information within secure, non-public environments (such as SAPHaRI).9
Note that technologies designed for data drill-down such as data-cubes (which can be thought of as a multi-dimensional extension to a spreadsheet table) have primar-ily been developed for commercial applications. For example, a sales manager may want to see patterns of sales across the nation, but he or she may also want to know what type of widget a particular salesperson sold yesterday. Such datasets and applications are not associated with the privacy and inferential issues that are so important to the health data being presented with HSNSW. Although HSNSW does use data-cubes to efficiently access large volumes of data, decisions about the level of data granu-larity available to the public are made well before the data are transformed into cubes.
3. Data security versus accessibility
The underlying technical architecture of HSNSW is com-plex and the details are beyond the scope of this article. There are, however, two major components of the system: indicator calculation; and reporting and analytics. The algorithms used for indicator calculation process unit-level or semi-aggregated data into defined health indicators on secure internal workstations. These processing steps are implemented using existing and well-tested processes within the Centre for Epidemiology and Research, NSW Ministry of Health. Any data with potential privacy issues are therefore subject to strict security protocols within the Ministry. None of these privacy-sensitive data are stored on publicly-facing servers.
In contrast, the web-based reporting and analytics solution imports the text output from the indicator calculation steps described above, builds data-cubes, handles user interac-tion and renders tables, charts, maps and portable docu-ment format (pdf) reports, spreadsheets and images. These functions are completed on other servers which are public-ly facing and are isolated from any servers which contain privacy-sensitive data.
This system thus enables the delivery of population health indicators to the public without any privacy-sensitive data being stored on public web servers. This design required some duplication and inefficiencies (from a systems-de-sign perspective), but these are justified to meet the dual
objectives of secure health data and accessible health indicators.
Conclusion
Web-applications such as HSNSW are complex systems which require consideration of a diverse range of issues in their design, implementation and configuration. Many of these issues require a trade-off between users’ wishes and the responsibilities of the data reporting specialists. For example, people want access to data, but cannot be given access to all data because of very justifiable privacy issues. People need access to information about their area, but should not be provided with information that is not suitable for drawing valid statistical inferences. Computer systems need to be deployed that provide public access to the data, but these systems must be designed in a manner that cannot increase risks to personal privacy.
The authors contend that HSNSW strikes the right balance with these inter-related competing demands for the benefit of publishing a diverse range of population health indicators using a new web-based data query system. These issues are discussed in more detail in the report Privacy issues and the reporting of small num-bers2 that was prepared in conjunction with the initial release of HSNSW. Readers may also find the article by Lawlor and Stone10of interest as these authors provided an overview of tensions between data protection and informing public health.
Acknowledgments
The authors wish to acknowledge the following staff from the Ministry of Health who worked on the development of the HSNSW application: Lina Persson, Nicole Mealing, Mark Cerny, Hanna Noworytko, Christian Allen, Sarah Thackway, Kerry Chant, Dejan Mirkovic, Greg Thompson, Sachida Ghimire and Dudley Collinson. The authors are also grateful to the two reviewers whose comments improved the manuscript.
References
1. Rudolph BA, Shah GH, Love D. Small numbers, disclosure risk, security, and reliability issues in web-based data query systems.
J Public Health Manag Pract2006; 12: 176–83.
2. Centre for Epidemiology and Research. Health Statistics NSW: Privacy issues and the reporting of small numbers. Sydney: NSW Department of Health; 2011. p. 18.
3. COAG Reform Council National Healthcare Agreement. Performance report for 2009–10. Sydney: COAG Reform Council; 2011.
4. Government NSW. NSW 2021: A plan to make NSW number one. Sydney: NSW Government; 2011.
5. NSW Health. NSW Health Privacy Manual, Version 2, PD2005_593. North Sydney: NSW Ministry of Health; 2005. p. 75.
6. Statistical Information Management Committee (SIMC). Guidelines for the use and disclosure of health data for
statistical purposes. Canberra: Australian Institute of Health and Welfare; 2007. p. 16.
7. Steel D, Green J, Brown L. Best practice in small area analysis and reporting – literature review and guidelines. Centre for Health Service Development, University of Wollongong; 2003. p. 108.
8. Lawson AB, Browne WJ, Rodeiro CL. Disease Mapping with WinBUGS and MLwiN. Chichester: John Wiley & Sons; 2003. p. 292.
9. NSW Health. Secure analytics for population health research and intelligence (SAPHaRI). Sydney: NSW Health; 2011.
10. Lawlor DA, Stone T. Public health and data protection: an inevitable collision or potential for a meeting of minds?Int J Epidemiol2001; 30: 1221–5. doi:10.1093/ije/30.6.1221
Utilisation of the Medicare Teen
Dental Plan in NSW, 2008
–
2010
John C. Skinner
A,B, Peter List
Aand Clive Wright
AA
Centre for Oral Health Strategy NSW B
Corresponding author. Email: [email protected]
Abstract: Aim:To examine the use of the Medi-care Teen Dental Plan in NSW, its uptake in the private and public dental sectors and to map the geographical pattern of program use. Methods:
Data describing the use of the Medicare Teen Dental Plan were assembled from a variety of sources including Medicare, the NSW Oral Health Data Collection and the NSW Teen Dental Survey 2010.Results:In 2010, use of the Medicare Teen Dental Plan across the entire NSW eligible aged population ranged from 20 to 25.5%, with the average usage across all ages being 20.2%. For the period 2002 to 2010, the average utilisation rate for teenagers accessing public dental care was approximately 6.8%. Conclusion: As a single Dental Benefits Schedule item is used for service provided under the Plan, it is difficult to evaluate the mix of dental treatment items and the compar-ative value of the service provided unless these services are provided in a public dental service with a data collection that can flag care provided under a Medicare Teen Dental Plan voucher.
The Medicare Teen Dental Plan was introduced on 1 July 2008 after being announced as an election commitment by the Commonwealth Labor Government.1 The Medicare Teen Dental Plan provides a $163.05 voucher (indexed annually) that aims to promote life-long good oral health habits. Vouchers are sent to eligible teenagers in January and February each year, and must be redeemed within the calendar year of issue.
At a minimum, each voucher is to provide an oral exami-nation and other necessary diagnostic or preventive dental items that can be provided within the dollar value of the
voucher.1 Parents or teenagers may face out-of-pocket costs if private dentists charge above the voucher amount, or if additional treatment is required. To be eligible for a voucher, a teenager must, for at least some part of the calendar year, be aged between 12–17 years, and meet a means test. The means test involves the teenager or his or her family, caregiver, guardian or partner being eligible for one or more of a range of Australian Government benefits or allowances.2 Approximately 1.3 million (65%) of the Australian population aged 12–17 years were eligible for a Medicare Teen Dental Plan voucher in 20081reducing to 1.2 million in 2010.3 A similar proportion of teenagers were eligible in New South Wales (NSW).
The implementation of the Medicare Teen Dental Plan required a legislative framework for the payment of dental benefits to be established.4 After consultation with the State and Territory Dental Directors and Chief Dental Officers, the Medicare Teen Dental Plan implementation was amended so that vouchers could be claimed through public oral health services. This is a notable difference from the Medicare Chronic Disease Dental Scheme, which has not been available through public oral health services.
Each of the former Area Health Services (now Local Health Districts) in NSW has been providing services under the Medicare Teen Dental Plan since the program began, as all children and young people under 18 years of age are eligible for NSW Public Oral Health Services. Arrangements were made for the processing and claiming of the vouchers through a Representative Public Dentist’s Medicare provider number5 in each of the former Area Health Services. The benefits claimed by the Representa-tive Public Dentist are paid to an Area Health Service account.
We examined the use of the Medicare Teen Dental Plan in NSW and compared this with its use in other Australian jurisdictions. We also examined uptake in the private and public dental sectors in NSW and mapped the geographical pattern of program use.
Methods
were extracted for the 9 years from 2002 to 2010 for all young people aged 12 to 17 years at the time of service delivery. Data for each teenager presenting with a Medi-care Teen Dental Plan voucher or referral indicator were also extracted from the demographics table in the Informa-tion System for Oral Health. Where possible, these data were matched to a unique treatment visit that occurred in the same year as the use of the voucher.
For the last 3 years of the period 2002 to 2010, the Medicare Teen Dental Plan was in place and each of the former Area Health Services accepted Medicare Teen Dental Plan vouchers. A NSW Health Policy Directive mandates the use of a Medicare Teen Dental Plan indicator for each year that the teenager uses their voucher in the public dental system.6The use of this indicator has only been fully implemented recently in some parts of the state which means that the available data underestimate the true number of teens attending dental clinics with vouchers.
In 2010 a randomised, statewide Teen Dental Survey (unpublished) examined the oral health of a random representative sample of Year 9 students aged 14–15 years in NSW. This survey included a questionnaire completed by the teenager and his or her parents about the teenager’s
oral health-related behaviours and use of dental services, including the Medicare Teen Dental Plan. The data from these questionnaire responses were analysed.
Data on the number of services provided and the value of vouchers claimed under the Medicare Teen Dental Plan by all Statistical Local Areas in NSW were obtained for the period 2008 to 2011 from the Department of Human Services National Office by formal request. In addition voucher claims data for all Australian jurisdictions was obtained from the Medicare Statistics website for the period 2008 to 2011. All datasets were analysed using SAS 9.2.7The Medicare data were also mapped for each NSW Statistical Local Area using the Geographical Infor-mation System software, MapInfo version 11.8
Results
At the end of June 2011, $189.9 million in benefits had been claimed in Australia under the Medicare Teen Dental Plan since July 2008 with $68.6 million of benefits claimed for NSW teenagers (Table 1). Since the scheme com-menced in July 2008, 1 270 409 services have been claimed in Australia with 453 138 services in NSW (Table 2). In the first financial year in NSW (2008–9), 168 580 services
Table 1. Total benefits paid through Medicare Teen Dental Plan items (Dental Benefit Schedule Item No 88000) processed for three financial years 2008]2009 to 2010]2011 for each jurisdiction in Australia
Financial year
Jurisdiction Total
NSW Vic. Qld SA WA Tas. ACT NT
$ $ $ $ $ $ $ $ $
2008–2009 24 876 525 19 013 925 12 930 539 4 128 744 3 960 024 892 192 694 582 199 365 66 695 896
2009–2010 22 472 021 16 612 579 11 292 251 5 308 608 4 463 561 2 434 322 625 041 206 075 63 414 458
2010–2011 21 284 505 15 666 985 11 285 616 4 559 590 4 107 848 1 968 736 681 618 245 496 59 800 395
Total 68 633 052 51 293 489 35 508 406 13 996 942 12 531 433 5 295 249 2 001 242 650 936 189 910 749
Source: Medicare Australia. https://www.medicareaustralia.gov.au/statistics/mbs_item.shtml (Cited 8 September 2011).
NSW: New South Wales; Vic: Victoria; Qld: Queensland; SA: South Australia; WA: Western Australia; Tas: Tasmania; ACT: Australian Capital Territory; NT: Northern Territory.
Table 2. Number of services claimed through Medicare Teen Dental Plan items (Dental Benefit Schedule Item No 88000) for the financial years 2008]9 to 2010]2011 for each jurisdiction in Australia
Financial year Jurisdiction Total
NSW Vic. Qld SA WA Tas. ACT NT
n n n n n n n n N
2008–2009 168 580 134 999 88 180 27 979 27 267 6 286 4982 1418 459 691
2009–2010 147 986 113 816 74 775 34 723 29 693 16 079 4304 1410 422 786
2010–2011 136 572 104 023 72 676 29 210 26 650 12 672 4529 1600 387 932
Total 453 138 352 838 235 631 91 912 83 610 35 037 13 815 4428 1 270 409
Source: Medicare Australia. https://www.medicareaustralia.gov.au/statistics/mbs_item.shtml (Cited 8 September 2011).
NSW: New South Wales; Vic: Victoria; Qld: Queensland; SA: South Australia; WA: Western Australia; Tas: Tasmania; ACT: Australian Capital Territory; NT: Northern Territory.
were claimed in NSW declining to 136 572 services claimed in the financial year 2010–11.
In the 2010 calendar year, use of the Medicare Teen Dental Plan was slightly higher in younger age groups, and rates of use declined in older teenagers (Table 3). Use of the scheme in the NSW population aged 12-17 years ranged from 20% among 17 year olds to 25.5% among 13 year olds. As the age requirements of the Medicare Teen Dental Plan includes teenagers who are aged between 12–17 years for only part of the calendar year, there was also some use of vouchers by teenagers who were younger than the scheme’s target group (10.6% of 11 year olds used a voucher) and those older (10.5% of 18 year olds). The average use across all ages 11–18 years was 20.2%.
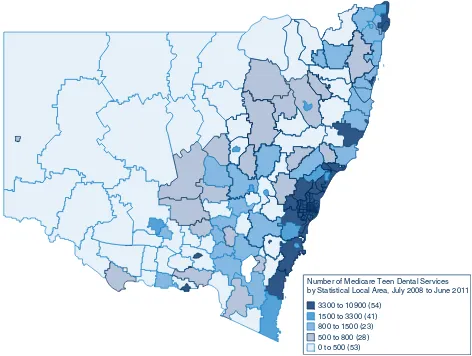
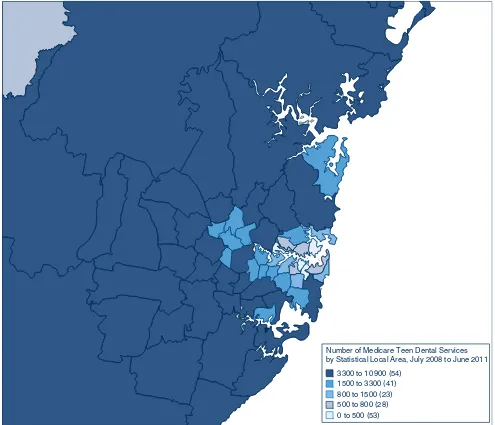
The distribution of Medicare Teen Dental Plan services claimed for NSW for the period July 2008 to June 2011 (Figure 1), and the distribution of Medicare Teen Dental Plan services for the Sydney Metropolitan area for the same time period (Figure 2) show that, while services are largely concentrated in the highly populated coastal areas of NSW, there has been uptake of the Plan in regional and rural areas west of the Great Dividing Range.
Table 4 describes the use of public dental system in each of the former Area Health Services by all young people aged 12–17 years at the time of service for the period 2002 to 2010. This represents an average utilisation rate of approx-imately 6.8% of public dental services for the period 2002 to 2010.
Despite the limitations of the Medicare Teen Dental Plan indicator, there appears to be a slight increase in the number of teenagers accessing the public dental system between 2008 and 2010 compared to the overall period of 2002 to 2010 (Table 4).
Of the 16 365 teenagers with a Medicare Teen Dental Plan voucher indicator between 2008 and 2010 (Table 5),
12 789 (78.1%) were able to be matched with a unique visit identifier in the same year as the voucher indicator (Table 6).
In 2010, 901 (80%) of parent respondents in the NSW Teen Dental Survey reported receiving a Medicare Teen Dental Plan voucher. Of these, 528 teenagers had used the voucher, with 477 (90.3%) having used it at a private dentist and 9.7% reported using it in the public sector. However, a comparison of data from the Information System for Oral Health with Medicare data on total vouchers claimed in NSW indicates that only 3.7% were through the public oral health service in 2010 and 3.6% in 2009 (Table 5).
Referral pathways between private and public sectors have also been developed to ensure continuity of care for those patients who have redeemed their voucher privately, but require further care in the public sector. Between 2008 and 2011 in NSW, 600 teenagers were recorded as presenting to the public dental service for follow-up dental care after claiming their vouchers at a private dental practitioner (Table 5). Unlike vouchers, referrals are not differentiated by a new indicator each year and so it is not possible to examine these data by year from the Information System for Oral Health.
Discussion
When compared nationally, the use of the Medicare Teen Dental Plan in NSW is largely proportional to population. Use of the Medicare Teen Dental Plan as a percentage of the total NSW teenage population (11–18-year olds) shows differences between age groups with use declining in older teenagers. The decline in usage across the ages may be a result of declining interest in the program as older teen-agers may already have had two previous preventive visits under the Plan or it may represent changing circumstances, such as increasing independence from parents or
Table 3. Percentage of the NSW teenage population aged 11]18 years claiming Medicare Teen Dental Plan vouchers in 2010
Age at date of service
Medicare Teen Dental Plan services claimed*
Total NSW population** Medicare Teen Dental Plan usage
Years
Female
n Malen TotalN Femalen Malen TotalN Female%
Male %
Total %
11 4689 4829 9518 43 868 45 784 89 652 10.7 10.6 10.6
12 11 080 11 234 22 315 43 590 45 912 89 502 25.4 24.5 24.9
13 11 419 11 514 22 933 43 818 46 154 89 972 26.1 25.0 25.5
14 10 991 11 180 22 171 43 420 46 592 90 012 25.3 24.0 24.6
15 10 716 10 760 21 476 44 219 46 620 90 839 24.2 23.1 23.6
16 9746 9607 19 354 43 877 46 852 90 729 22.2 20.5 21.3
17 9237 8471 17 707 43 233 45 461 88 694 21.4 18.6 20.0
18 4599 4301 8900 41 252 43 435 84 687 11.2 9.9 10.5
Total 72 478 71 896 144 374 347 277 366 810 714 087 20.9 19.6 20.2
Sources: *Medicare Data, Department of Human Services and Health; **ABS Census Data (2006).
caregivers who previously encouraged them to use their Medicare Teen Dental Plan voucher.
There has been a notable decline in the number of vouchers claimed since 2008. This may be due to changes in the number of teenagers eligible for the Plan, or represent a waning awareness of the program following the initial implementation phase. Other factors that might contribute to the decline are that some teenagers used a voucher and were assessed as having no disease, or required treatment beyond the scope of the items offered under the voucher or beyond their ability to pay for these additional services.
Uptake of the Medicare Teen Dental Plan in the NSW public dental service has varied, both across the former Area Health Services, and over the years of operation. This is likely due to a range of factors including existing high demand for services and concerns during the first 12 months of implementation about taxation liability for the Representative Public Dentist. This taxation liability issue was resolved in 2010 with a ruling from the Australian Taxation Office.4
Recent declines in the number of vouchers claimed in some areas may represent a failure to maintain accurate data entry in the Information System for Oral Health through use of the Medicare Teen Dental Plan voucher indicators. It was not possible to match all Medicare Teen Dental Plan voucher indicators with visit data from the Information System for Oral Health in a way that could be reliably used to investigate treatment provided to teenagers in NSW public dental services.
There was a notable difference in the reported use of Medicare Teen Dental Plan vouchers in the public sector from the 2010 NSW Teen Dental Survey (9.7%) and the data from Medicare and the Information System for Oral Health (3.7%). While this difference may be due to sampling factors, an alternative explanation is that the NSW Teen Dental Survey only collected data regarding those people who were eligible by way of the Family Tax Benefit A, whereas the eligibility for the Plan includes a wider range of benefits. If this was the primary cause of the differences, it would suggest that those teenagers who were eligible via the Family Tax Benefit A were more likely to use their vouchers
Number of Medicare Teen Dental Services by Statistical Local Area, July 2008 to June 2011
3300 to 10900 (54)
1500 to 3300 (41) 800 to 1500 (23) 500 to 800 (28) 0 to 500 (53)
Figure 1. The geographical distribution of Medicare Teen Dental Plan services for each Statistical Local Area in NSW, for the period July 2008 to June 2011.
Source: Department of Human Services National Office, Canberra, Australia.
in the public dental service than those teenagers who were eligible under other benefits and allowances.
There are several observations made by the report of the review of the Dental Benefits Act 2008 related to changes to the program that would assist with evaluation. A key issue noted in the report was that data should be provided for each voucher claimed on which of the dental items included under the scheme had been provided rather than the single Dental Benefits Schedule (DBS) item 88000.1 The report noted that this could be achieved by adding an 88 prefix to the existing Australian Dental Association (ADA) treatment item code set in a similar way to the coding of treatment provided under the Medicare Chronic Disease Dental Scheme. This additional coding would allow for quantification of anecdotal evidence of substan-tial variation in value of services provided under a voucher.1
The review also noted that public feedback on the Medi-care Teen Dental Plan included concerns about access to follow-up treatment of oral health issues identified by the preventive dental check, and the potential difficulties experienced by eligible teenagers moving between the private and public dental sectors for follow-up treatment.1 When vouchers are redeemed in the public sector, treatment identified in the oral examination can be provided to the teenager free of charge and with continuity of care.
Conclusion
The Medicare Teen Dental Plan provides an important opportunity to provide preventive dental care to teenagers, particular to those who may not otherwise seek it. It remains unclear, however, whether the Plan will meet the long-term objective to encourage teenagers to have a
Number of Medicare Teen Dental Services by Statistical Local Area, July 2008 to June 2011
3300 to 10 900 (54) 1500 to 3300 (41) 800 to 1500 (23) 500 to 800 (28) 0 to 500 (53)
Figure 2. The geographical distribution of Medicare Teen Dental Plan services for each Statistical Local Area in the Sydney Metropolitan Area for the period, July 2008 to June 2011.
Source: Department of Human Services National Office, Canberra, Australia.
Table 4. Use of public dental services by teenagers aged 12]17 years for each former Area Health Service in NSW for each year 2002 to 2010
Year Former Area Health Service Total
JH
n SSWn GSn HNEn SESIn GWn NCn NSCCn SWn N
2002 0 5455 2565 6109 3128 2719 3716 2970 5636 32 298
2003 0 5528 2744 7575 3421 2579 4214 3308 6239 35 608
2004 118 5696 3154 7710 3725 2395 4258 3472 6688 37 216
2005 176 5273 3026 8127 4055 2385 4598 3605 7024 38 269
2006 268 5152 3176 6214 4010 2758 4126 3457 7036 36 197
2007 333 5452 2678 6148 4210 2319 4091 3412 7046 35 689
2008 300 6778 3749 6961 5102 2873 4394 3383 8325 41 865
2009 215 6053 3484 6548 4492 2540 4014 3204 7287 37 837
2010 313 6270 3459 6257 4410 2533 3830 3284 7100 37 456
Total 1723 51 657 28 035 61 649 36 553 23 101 37 241 30 095 62 381 332 435
JH: Justice Health; SSW: Sydney South West; GS: Greater Southern; HNE: Hunter New England; SESI: South Eastern Sydney Illawarra; GW: Greater Western; NC: North Coast; NSCC: North Sydney Central Coast; SW: Sydney West.
Source: NSW Oral Health Data Collection.
Table 5. Number of Medicare Teen Dental Plan vouchers and referrals for 2008 to 2010, for each former Area Health Service,* NSW
Former Area Health Services Medicare Teen Dental Plan
2008
n 2009n 2010n VouchersTotal
N
Referrals N
NC 746 717 834 2297 84
NSCC 374 585 254 1213 2
HNE 1112 990 274 2376 101
SSW 910 437 147 1494 1
SESI 810 1039 709 2558 389
SW 80 5 764 849 2
GW 403 513 454 1370 14
GS 996 1352 1860 4208 7
Total claimed in NSW 97 131 158 158 144 397 374 853
Total NSW public dental service 5431 5638 5296 16 365 600
Percentage claimed in public dental service 5.57% 3.56% 3.67% 4.37%
SSW: Sydney South West; GS: Greater Southern; HNE: Hunter New England; SESI: South Eastern Sydney Illawarra; GW: Greater Western; NC: North Coast; NSCC: North Sydney Central Coast; SW: Sydney West.
Source: NSW Oral Health Data Collection.
Table 6. Number of Medicare Teen Dental Plan Voucher indicators matched to treatment data for the period 2008 to 2010 for each former Area Health Services in NSW
Year Former Area Health Service Total
NC
n NSCCn HNEn SSWn SESIn SWn GWn GSn N
2008 451 354 805 602 591 19 320 776 3918
2009 550 579 780 239 866 3 397 1107 4521
2010 678 253 185 103 621 614 361 1535 4350
Total 1679 1186 1770 944 2078 636 1078 3418 12 789
JH: Justice Health; SSW: Sydney South West; GS: Greater Southern; HNE: Hunter New England; SESI: South Eastern Sydney Illawarra; GW: Greater Western; NC: North Coast; NSCC: North Sydney Central Coast; SW: Sydney West.
Source: NSW Oral Health Data Collection.
regular preventive dental check as they become indepen-dent adults, and therefore ongoing monitoring of these teenagers beyond the target age groups of the Plan is required. The decline in use of vouchers as teenagers get older may be of particular concern in this respect, and would suggest that further effort is required to sustain usage as teenagers get older and become more independent.
This examination of the utilisation of the Plan in NSW raised concerns with respect to the lack of uptake, the equity of uptake of vouchers and the number of providers available or willing to accept vouchers in certain rural and regional areas of NSW. A lack of support for the provision of follow-up care in the private sector is also of concern, and could contribute to additional pressures being placed on the NSW public oral health service which are not offset by revenue from the Plan.
With only a single Dental Benefits Schedule item used for services provided under the Plan, it is difficult to evaluate the mix of dental treatment provided and the comparative value of the services delivered. Better capture of the full range of dental care provided under each voucher is needed for more effective monitoring and evaluation of the Plan and its goals.
Acknowledgments
The authors would like to acknowledge the Department of Human Services National Office for supplying the Medicare service and claims data.
References
1. Australian Government Department of Health and Ageing. Report on the Review of the Dental Benefits Act 2008. Publications Approval Number 6334. Canberra: Commonwealth of Australia; 2009. Available at: http://www.health.gov.au/ internet/main/publishing.nsf/content/BF6EEBDAEAB570BB CA2576E7000854DF/$File/DoHA%20Dental%
20Benefits_LR.pdf (Cited 21 November 2011).
2. Department of Health and Ageing. Medicare Teen Dental Plan. Questions and answers. Available at: http://www.health.gov.au/ internet/main/publishing.nsf/Content/dental-teen-questions (Cited 17 November 2011).
3. Department of Health and Ageing. Annual Report 2010/11. Available at: http://www.health.gov.au/internet/main/
publishing.nsf/Content/annual-report2010-11 (Cited 26 January 2012).
4. Biggs A, Biddington M. Dental Benefits Bill 2008. Bills Digest, 13 June 2008, no. 135, 2007–08. Parliament of Australia, Department of Parliamentary Services. Available at: http:// www.aph.gov.au/library/pubs/bd/2007-08/08bd135.pdf (Cited 21 November 2011).
5. Health NSW. Information Bulletin 2009_042: Representative Public Dentist – Commonwealth Medicare Teen Dental Program. August 2009. Available at: http://www.health.nsw. gov.au/policies/ib/2009/pdf/IB2009_042.pdf (Cited 21 November 2011).
6. Health NSW. Policy Directive 2008_056: Priority Oral Health Program and List Management Protocols. September 2008. Available at: http://www.health.nsw.gov.au/policies/pd/2008/ pdf/PD2008_056.pdf (Cited 21 November 2011).
7. SAS Institute. 2010. The SAS System for Windows version 9.2. Cary, NC: SAS Institute Inc.
8. Pitney Bowes Software Inc. MapInfo 11. One Global View, Troy, New York 12180-8399.
Development of a maternity hospital
classification for use in perinatal research
Michael O. Falster
A,B, Christine L. Roberts
A,E,
Jane Ford
A, Jonathan Morris
A,C, Ann Kinnear
Dand Michael Nicholl
C,DA
Clinical and Population Perinatal Research, Kolling Institute of Medical Research, Royal North Shore Hospital
BNSW Biostatistical Officer Training Program, NSW Department of Health
C
Department of Obstetrics, Gynaecology and Neonatology, The University of Sydney at Royal North Shore Hospital D
Primary Health and Community Partnerships, NSW Department of Health
E
Corresponding author. Email: [email protected]
Abstract: We aimed to develop a maternity
hospital classification, using stable and easily available criteria, that would have wide applica-tion in maternity services research and allow comparison across state, national and international jurisdictions. A classification with 13 obstetric groupings (12 hospital groups and home births) was based on neonatal care capability, urban and rural location, annual average number of births and public/private hospital status. In a case study of early elective birth we demonstrate that neona-tal morbidity differs according to the maternity hospital classification, and also that the 13 groups can be collapsed in ways that are pragmatic from a clinical and policy decision-making perspective, and are manageable for analysis.
A hospital’s role and level of service delivery depends on various factors, including its size, geographical location, public or private sector status and the place of the hospital within a wider health system network. Measures of service delivery (e.g. facilities, volume of procedures) have been used to assess the quality of care,1as predictors of health outcomes2,3and to inform hospital role delineation.4The delineated role of a service in maternity care has tradition-ally been determined by the availability of paediatric support services. For example, the National Health and Medical Research Council (NHMRC) recommended that
pregnancies less than 33 weeks gestation be delivered at hospitals with neonatal intensive care units to ensure babies are born under the best conditions possible to reduce morbidity and mortality of the newborn.5
In New South Wales (NSW), information about all births is collected in the NSW Perinatal Data Collection (PDC), a population-based statutory surveillance system which includes information on maternal characteristics, pregnancy, birth and infant outcomes. An obstetric service level is assigned to each hospital where women give birth. These levels are based on a complex array of maternity and neonatal staffing, expertise, pathology and surgical and anaesthetic capability, and range from Level 6 (providing both obstetric and neonatal tertiary care) to Level 1 (no birthing services, may provide postnatal care).6Although the components of the level can change throughout the course of a year (e.g. in rural hospitals the departure of the only obstetrician would change the level), the level that has prevailed for the majority of the year is assigned as the level for the entire year.
When using these levels for research, other limitations emerge. Firstly, there is no geographical differentiation, although the provision and outcome of maternity services needs to take geography into account. Secondly, no service levels are assigned to private hospitals as no information on maternity or neonatal services capability in private hospitals in NSW is routinely available; they form one group regardless of the level of obstetric and neonatal services available. Thirdly, there is no evidence that the level designations are better predictors of birth outcome than the annual number of births at each hospital.7 Therefore we aimed to develop a service level descriptor that was suitable for research with stable and easily available components that would have wide application and allow comparison across state, national and interna-tional jurisdictions. We wanted groupings of hospitals that were sufficiently large that would allow us to exclude or collapse the groups across dimensions relevant to a research question. Here we report the development of such a classification of maternity hospitals and provide a case study of its use.
Methods – construction of a new maternity hospital classification
We classified maternity hospitals in NSW according to the following dimensions of service level: neonatal care
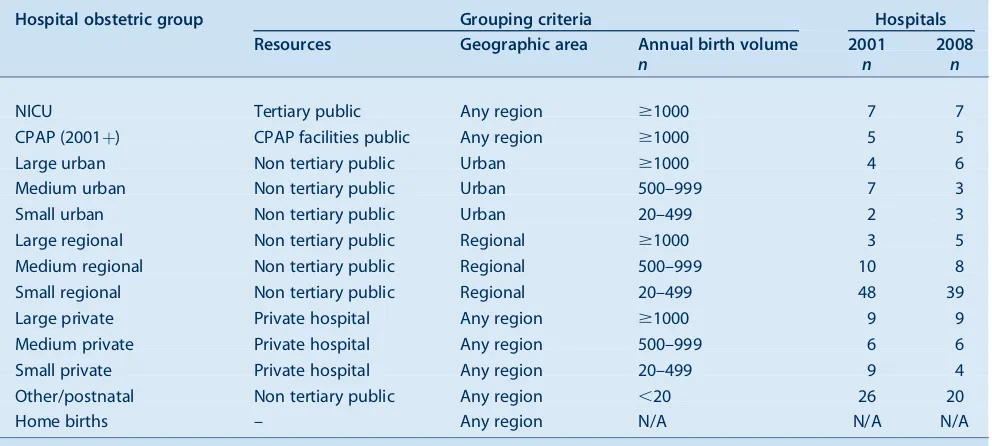
capability (tertiary neonatal intensive care unit (NICU); continuous positive airways pressure (CPAP) facilities and trained staff8 or other); geography (urban or rural loca-tion); annual average number of births (.1000, 500–999, 20–499 and,20 births); and hospital status (public or private). Women birthing outside a hospital were classified as a separate group. These criteria were used to create a set of 13 obstetric groups (12 hospital groups plus home births) (Table 1). Although a classification with 13 levels is unwieldy for most research purposes, the hospital groups can easily be collapsed along dimensions that are appro-priate to the study objectives. Groupings can be allocated on the basis ofa prioriresearch questions and/or similarity of clinical characteristics prior to the assessment of outcomes, as in the following case study. SAS program coding for the maternity hospitals classification is avail-able on the Population Health Research Network website at www.phrn.org.au.
Results – case study
Two objectives of a recent study of early elective births (induction of labour or pre-labour caesarean section) in NSW were to determine the risk of severe neonatal morbidity following elective births (33–39 weeks gestation), and the extent to which the morbidity differs according to the gestational age at which the infant was born.9While much is known about the pattern of morbidity by gestational age in tertiary hospitals,10 less is known about the patterns of, and outcomes following, elective deliveries in a range of non-tertiary hospitals. Thus, a secondary aim of the study was to assess patterns of
morbidity across non-tertiary hospitals, where there may not be the service capability to care for sick and preterm infants.
Data on births were obtained from the NSW Perinatal Data Collection. To assess patterns of morbidity, birth data were linked with hospital data in the NSW Admitted Patient Data Collection. Neonatal and maternal outcomes were assessed using composite indicators of morbidity which include both diagnoses and procedures, and are able to overcome problems of under-ascertainment of individual adverse events.11,12For the purposes of this study, home births and hospitals offering postnatal or midwifery-led care were excluded as elective births do not occur in these settings.
Hospitals were initially stratified into the 12 maternity hospital groups. Rates of elective births (by method) were compared across hospital strata and by gestational age, and strata were combined when the pattern of rates were similar across gestational ages. For example, the elective birth rates for the three levels of private hospitals were grouped based on similar rates across gestational ages (Figure 1). This resulted in six hospital groups: tertiary hospitals, hospitals with continuous positive airways pres-sure facilities, all other urban hospitals, large regional hospitals (delivery volume $1000), all other regional hospitals (delivery volume,1000), and private hospitals.
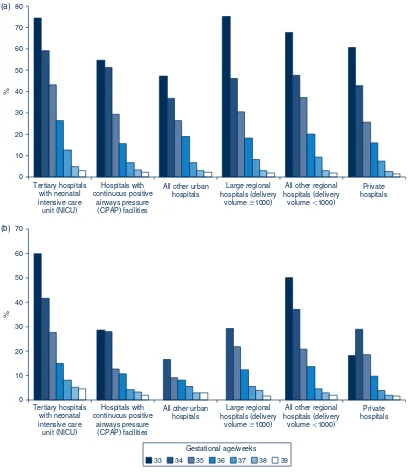
Figure 2 (a and b) presents the absolute risk of severe neonatal morbidity by gestational age and hospital classi-fication. There is a stepwise decline in neonatal morbidity
Table 1. Classification of maternity hospitals in NSW by 13 obstetric groups including home births, 2001 and 2008
Hospital obstetric group Grouping criteria Hospitals
Resources Geographic area Annual birth volume 2001 2008
n n n
NICU Tertiary public Any region $1000 7 7
CPAP (2001þ) CPAP facilities public Any region $1000 5 5
Large urban Non tertiary public Urban $1000 4 6
Medium urban Non tertiary public Urban 500–999 7 3
Small urban Non tertiary public Urban 20–499 2 3
Large regional Non tertiary public Regional $1000 3 5
Medium regional Non tertiary public Regional 500–999 10 8
Small regional Non tertiary public Regional 20–499 48 39
Large private Private hospital Any region $1000 9 9
Medium private Private hospital Any region 500–999 6 6
Small private Private hospital Any region 20–499 9 4
Other/postnatal Non tertiary public Any region ,20 26 20
Home births – Any region N/A N/A N/A
CPAP: continuous positive airways pressure. NICU: neonatal intensive care unit.
Source: Population Health Research Network.
(a)
0 10 20 30 40 50 60 70 80
Tertiary hospitals with neonatal intensive care unit (NICU)
Hospitals with continuous positive
airways pressure (CPAP) facilities
All other urban hospitals
Large regional hospitals (delivery
volume ⱖ1000)
All other regional hospitals (delivery
volume ⬍1000)
Private hospitals
%
(b)
Tertiary hospitals with neonatal intensive care unit (NICU)
Hospitals with continuous positive
airways pressure (CPAP) facilities
All other urban hospitals
Large regional hospitals (delivery
volume ⱖ1000)
All other regional hospitals (delivery
volume ⬍1000)
Private hospitals 0
10 20 30 40 50 60 70
%
33 34 35 36 37 38 39 Gestational age/weeks
Figure 2. Absolute risk of neonatal morbidity at seven gestational ages following elective birth, by hospital classification, using six maternity hospital groups, NSW, 2001–2007. (a) Following pre-labour caesarean. (b) Following induction.
Source: Linked NSW Perinatal Data Collection and NSW Admitted Patient Data Collection.
0 10 20 30 40 50 60 70 80 90 100
34 35 36 37 38 39
% of births in gestational age
which are elective
Gestation (weeks)
Small private Medium private Large private
Figure 1. Gestation-specific rates of elective births at private hospitals, NSW, 2001–2007. Source: NSW Perinatal Data Collection.
with each week of advancing gestation irrespective of the mode of elective birth, and this stepwise pattern was present in all of the hospital groups. The highest gestation-specific morbidity rates were at hospitals with a neonatal intensive care unit, which is consistent with birth of high-risk infants in tertiary centres. The rates of morbidity were higher following pre-labour caesarean section than induction at every gestation until 39 weeks. The pattern of stepwise improvement in outcomes associated with increasing ges-tation was also observed for maternal morbidity, and rates of transfer to a neonatal intensive care unit for infants born in non-tertiary hospitals (data not shown).
Discussion
Classifying hospitals into service levels is important for health services research. However, the classification of hospitals into similar groups may vary depending on the research question. In the case study presented, a key focus of the study was access to neonatal care and therefore geographical and resources dimensions were important.
Our case study found higher rates of severe adverse out-comes at shorter gestations with a stepwise decline as gestation increases, especially following pre-labour cae-sarean section. This pattern was found across all hospital classifications, including a range of non-tertiary hospitals that may not have the facilities to care for sick and preterm infants, reaffirming the importance of birth in risk-appropriate settings. Such results highlight the need for health policy to address the accessibility of obstetric and neonatal support services. Role delineation guidelines need to incorporate criteria on elective birth (pre-labour caesarean and induction of labour) and resourcing of regional hospitals needs to be reviewed if elective births are to be sanctioned in such settings.
The groupings in the case study are pragmatic from a clinical and policy decision-making perspective, and appear to have validity in the expected pattern of morbidity. The collapsed set of six groups was manageable for analysis, and was easily interpretable in the context of the study purposes. In the case study, rates of elective delivery were more similar between private hospitals, than between private and public hospitals of similar geography and volume, and so private hospitals were grouped together.
A limitation of the hospital groups may be the immediate application to jurisdictions outside of NSW, although the classification is easily adapted. For example, there may be private hospitals with neonatal intensive care unit facilities in other jurisdictions, and so an additional category may be needed. Further identification of specialised services, such as hospitals that now offer midwifery care only, is also possible. The proposed classification increases the poten-tial for comparability, through greater flexibility and transparency in the classification of groups. Furthermore,
in the absence of available perinatal data, the groups may be replicated using alternate data sources such as hospita-lisation data.
Conclusion
We have developed and used a classification of maternity hospitals that is based on readily available information, that may be adapted to different research questions and could be used at an area, state, national or international level. Hospitals will change groups if there are significant changes to the annual birth volume, avoiding reliance on facilities and staffing change which are hard to monitor in over 100 hospitals. This approach may be adaptable to other service delivery areas.
Acknowledgments
We thank the NSW Ministry of Health for access to the population health data and the NSW Centre for Health Record Linkage for linking the data sets. This work was supported by an Australian National Health and Medical Research Council (NHMRC)/NSW Ministry of Health Partnership Grant (#571451). MOF was employed as part of the NSW Biostatistical Officer Training Program funded by the NSW Ministry of Health while undertaking this work at the Kolling Institute of Medical Research.
References
1. Keeler EB, Rubenstein LV, Kahn KL, Draper D, Harrison ER, McGinty MJ et al. Hospital characteristics and quality of care.
JAMA1992; 268(13): 1709–14. doi:10.1001/ jama.1992.03490130097037
2. Phibbs CS, Bronstein JM, Buxton E, Phibbs RH. The effects of patient volume and level of care at the hospital of birth on neonatal mortality.JAMA1996; 276(13): 1054–9. doi:10.1001/ jama.1996.03540130052029
3. Birkmeyer JD, Stukel TA, Siewers AE, Goodney PP, Wennberg DE, Lucas FL. Surgeon volume and operative mortality in the United States.N Engl J Med2003; 349(22): 2117–27. doi:10.1056/NEJMsa035205
4. Badawi N, Adelson P, Roberts C, Spence K, Laing S, Cass D. Neonatal surgery in New South Wales–what is performed where?J Pediatr Surg2003; 38(7): 1025–31. doi:10.1016/ S0022-3468(03)00184-2
5. National Health and Medical Research Council. Clinical practice guidelines: care around preterm birth. Canberra: NHMRC; 1997.
6. NSW Health Department. Guide to role delineation of health services. Sydney: NSW Health; 2002.
7. Algert CS, Morris JM, Bowen JR, Giles W, Roberts CL. Twin deliveries and place of birth in NSW 2001–2005.Aust N Z J Obstet Gynaecol2009; 49(5): 461–6. doi:10.1111/j.1479-828X.2009.01054.x
8. Buckmaster AG, Arnolda G, Wright IM, Foster JP, Henderson-Smart DJ. Continuous positive airway pressure therapy for
infants with respiratory distress in non tertiary care centers: a randomised, controlled trial.Pediatrics2007; 120(3): 509–18. doi:10.1542/peds.2007-0775
9. Falster MO, Roberts CL, Ford J, Morris J, Nicholl M. Informing hospital role delineation: Elective delivery of pregnant women before the due date.Aust Epidemiol2010; 17(2): 48.
10. Bailit JL, Gregory KD, Reddy UM, Gonzalez-Quintero VH, Hibbard JU, Ramirez MM et al. Maternal and neonatal outcomes by labor onset type and gestational age.Am J Obstet Gynecol2010; 202(3): 245.e1–e12. doi:10.1016/ j.ajog.2010.01.051
11. Lain S, Algert C, Nassar N, Bowen J, Roberts C. Incidence of Severe Adverse Neonatal Outcomes: Use of a Composite Indicator in a Population Cohort. Matern Child Health J
2011 April. [Epub ahead of print]. doi:10.1007/s10995-011-0797-6
12. Roberts CL, Cameron CA, Bell JC, Algert CS, Morris JM. Measuring maternal morbidity in routinely collected health data: development and validation of a maternal morbidity outcome indicator.Med Care2008; 46(8): 786–94. doi:10.1097/ MLR.0b013e318178eae4
Reporting of Aboriginal and Torres Strait
Islander peoples on the NSW Admitted
Patient Data Collection: the 2010
Data Quality Survey
Jason P. Bentley
A, Lee K. Taylor
A,Cand Peter G. Brandt
BA
Centre for Epidemiology and Research, NSW Ministry of Health
B
Demand and Performance Evaluation Branch, NSW Ministry of Health
C
Corresponding author. Email: [email protected]
Abstract:The reporting of Aboriginal and Torres
Strait Islander peoples on the NSW Admitted Patient Data Collection was ascertained using a stratified purposive sample of NSW public hospi-tal patients in 2010. Information was collected by interviewing patients and compared with patient information obtained on admission. The study used the methods used in the national survey by the AIHW in 2007 and the study results were compared to the AIHW survey results. The level of correct reporting was 90.7% (95% CI 84.6– 94.2). These results, while indicative, should be interpreted with caution as some people may not have identified themselves as Aboriginal or Torres Strait Islander either on hospital admission or in the survey, and non-random sampling can produce non-representative samples.
Improving the health of Aboriginal and Torres Strait Islander peoples is a priority under the National Partner-ship Agreement on Closing the Gap on Indigenous Health Outcomes.1This Agreement aims to reduce the disadvan-tage experienced by Aboriginal and Torres Strait Islander peoples with respect to life expectancy, child mortality, access to early childhood education, educational achieve-ment and employachieve-ment outcomes.1The correct reporting of Aboriginal and Torres Strait Islander peoples on health data collections is essential to measure the effectiveness of
policies and programs at reducing the health disadvantage that they experience.
TheNational best practice guidelines for collecting Indig-enous status in health data setsnote that there are continu-ing problems with the under-reportcontinu-ing of Aboriginal and Torres Strait peoples on many health-related data collec-tions, and encourages states and territories to ‘establish mechanisms for monitoring, improving and maintaining the quality of Aboriginal and Torres Strait Islander datay’.2
A national survey coordinated by the Australian Institute of Health and Welfare (AIHW) estimated the level of correct reporting of Aboriginal and Torres Strait Islander peoples on New South Wales (NSW) public hospital admitted patient data in 2007 to be 88%.The level of correct reporting ranged from 48% to 97% across Austra-lian states and territories.3
Inpatient information collected by hospitals in NSW is compiled into the NSW Admitted Patient Data Collection (APDC). The APDC covers demographic and episode-related data for every inpatient separated from any public and repatriation hospital, and public same day procedure centre. Similar data are collected on patients admitted to private hospitals. Separation can result from discharge, transfer, death or change in care type. The APDC is main-tained by the Data Collections and Reporting Unit in the Demand and Performance Evaluation Branch of the NSW Ministry of Health. The APDC is a major source of infor-mation on indicators of serious morbidity in the population.
To monitor the quality of reporting of Aboriginal and Torres Strait Islander peoples in the APDC, we carried out an audit using survey methods, estimated the level of correct reporting in 2010 and compared the results with those of the 2007 survey conducted by the AIHW.
Methods
Hospital selection
As for the 2007 survey, the aim of the 2010 survey was to achieve a sample size of approximately 2800 people drawn from NSW public hospitals. Hospitals were stratified by their geographic remoteness using the Accessibility/ Remoteness Index of Australia (ARIAþ) categories.4 A proportion of the total sample of people was assigned to each geographic area based on the proportion of the NSW Aboriginal and Torres Strait Islander population resident in each remoteness area. Within each ARIA category, a purposive sample of public hospitals was selected, based on high throughput and/or a relatively high number of separations of Aboriginal or Torres Strait Islander people. Within each hospital, people were selected from medical and surgical wards and renal units. Certain groups of patients were excluded, such as those: aged less than 18 years, too ill to speak, in intensive care or where clinical staff advised at the time that it was not appropriate to interview a patient. To allow comparison, hospitals selected for the 2007 survey were selected again in 2010. Three hospitals that were sampled in 2007 did not participate, reducing the number of participating hospitals from 20 to 17. Of the 17 hospitals sampled: five were selected from 61 hospitals located in major cities, six were selected from 71 hospitals in inner-regional areas, two were selected from 117 hospi-tals in outer-regional areas, and four were selected from 29 hospitals in remote and very remote areas.
Patient interviews
Patients were interviewed in June 2010 by hospital staff members who, where possible, were Aboriginal and Torres Strait Islander liaison officers and not involved in maintaining personal information on the hospital Patient Administration System. The questionnaire included a script for each question so that questions were asked in a standard way and order. Patients were eligible to be interviewed if they were aged 18 years or over and well enough to be interviewed when the interviewer was pres-ent. Patients were provided with an information sheet about the survey and informed consent was obtained. Patients were asked a series of questions concerning their sex, place of birth in Australia (yes/no), date of birth, whether they were Aboriginal or Torres Strait Islander and usual place of residence. Information on whether each survey participant was reported as Aboriginal or Torres Strait Islander was also obtained from the hospital Patient Administration System. De-identified data were provided to the Ministry of Health for analysis.
Analysis
The analysis followed the same method used for the 2007 survey. The proportion of Aboriginal or Torres Strait Islander people correctly reported on the Patient Adminis-tration System was calculated for each hospital stratum, and correction factors derived. These correction factors
were then applied to the number of reported separations for Aboriginal and Torres Strait Islander peoples for each hospital remoteness category for June 2010, to give a number of expected separations for Aboriginal and Torres Strait Islander peoples for each remoteness category, which were then summed to give the total number of expected separations for Aboriginal and Torres Strait Islander peoples for NSW. The numbers of observed and expected separations for Aboriginal and Torres Strait Islander peoples for NSW were then compared to give the estimated proportion of Aboriginal and Torres Strait Islander peoples in NSW who were correctly reported on the Patient Administration System. Binomial confidence intervals for the remoteness category and total state level completeness were calculated.
Trends in monthly counts of reported separations among Aboriginal and Torres Strait Islander peoples for survey hospitals were obtained from the APDC and aggregated to the remoteness level of the hospitals.
As this review is an audit of a data collection and conforms to the standards established by the National Health and Medical Research Council for ethical quality review,5 ethics committee approval was not sought.
Results
Of the 2581 patients who were asked to participate, 61 (2.4%) declined and a further 58 (2.2%) records were excluded as the patients were interviewed twice. Of the 2462 (95.4%) valid survey responses, 136 (5.5%) were among people who identified themselves as Aboriginal and Torres Strait Islander (Table 1).
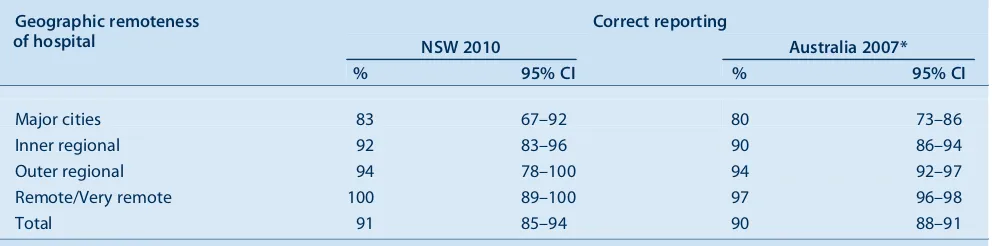
The percentage of Aboriginal and Torres Strait Islander peoples correctly reported on the Patient Administration System in 2010 was estimated to be 91% (Table 2), compared to 88% (95% CI 84%–93%) reported in the 2007 survey. This improvement in reporting was not statistically significant. The percentage of correct reports increased with increasing geographic remoteness of the hospital, from 83% for hospitals in major cities to 100% for hospitals in remote and very remote areas. This pattern is similar to that reported for six jurisdictions combined in the 2007 survey.
There was no noticeable increase in the number of reported separations among Aboriginal and Torres Strait Islander peoples at the time of the survey in June 2010 compared to previous months (Figure 1).
Discussion
Most hospital separations among Aboriginal and Torres Strait Islander peoples were correctly recorded on the Patient Administration System. There was an absolute
Table 2. Correct reporting of Aboriginal and Torres Strait Islander peoples on hospital admission records by Accessibility/ Remoteness Index of Australia (ARIA1) remoteness category of hospital, NSW, 2010 and Australia, 2007
Geographic remoteness of hospital
Correct reporting
NSW 2010 Australia 2007*
% 95% CI % 95% CI
Major cities 83 67–92 80 73–86
Inner regional 92 83–96 90 86–94
Outer regional 94 78–100 94 92–97
Remote/Very remote 100 89–100 97 96–98
Total 91 85–94 90 88–91
Figures for Australia exclude Tasmania and the Australian Capital Territory. CI: confidence interval.
*Australian Institute of Health and Welfare. Indigenous identification in hospital separations data: quality report. Cat. No. HSE 85. Canberra: AIHW; 2010.
0 200 400 600 800 1000 1200
J A S O N D J F M A M J J A S O N D J F M A M J J A S O N D J F M A M J J A S O N D J F M A M J 2010
2007 2008 2009
2006
Major city Inner regional Outer regional Remote/Very remote
Figure 1. Separations from selected hospitals for Aboriginal and Torres Strait Islander peoples aged 18 years and over by month and location of hospital, NSW, July 2006–June 2010.
The series comprises facilities sampled in the 2010 survey.
Source: NSW Admitted Patient Data Collection (HOIST), Centre for Epidemiology and Research, NSW Ministry of Health.
Table 1. Valid survey responses and Aboriginal and Torres Strait Islander peoples reported by Accessibility/Remoteness Index of Australia (ARIA1) remoteness category of hospital, NSW, 2010
Geographic remoteness of hospital
Valid responses*
Aboriginal people
N N %
Major cities 1574 29 1.8
Inner regional 656 62 9.5
Outer regional 162 19 11.7
Remote/Very remote 70 26 37.1
NSW 2462 136 5.5
*Overall response rate was 95.4% of 2581 people invited to participate.
increase of 3% compared to the 2007 survey, as mentioned. This improvement was not statistically significant.
The survey was stratified by geographic remoteness of the hospital to allow adjustment for differences in levels of reporting caused by the remoteness. The strength of this approach is that it addresses any bias that might be intro-duced through differences in the population caused by the geographic location. It should be noted, however, that the original sample sizes were calculated to allow estimation of the quality of the reporting for each remoteness level at a national rather than state level. For this reason, the esti-mates of correct reporting for each level of hospital remoteness for NSW are not precise and this imprecision is reflected by wide confidence intervals (see Table 2). Despite this, correct reporting was found to increase with increased geographic remoteness of the hospital.
There are several aspects to the study design that may affect the generalisability of the results to the NSW hospital population:
• The sample population was restricted to people aged 18 years or over.
• The sample population was restricted to NSW public hospitals.
• The sample population was restricted to those well enough to be interviewed. There is likely to be under-representation of very sick patients who could not be interviewed, or day-only patients.
• Within each geographic stratum, the selection of hospi-tals for the survey was purposive rather than random. Purpose sampling was used to ensure that a sufficient sample of Aboriginal and Torres Strait Islander peoples were interviewed. Due to the small numbers of Aborig-inal and Torres Strait Islander people sampled, we were unable to check the representativeness of the sample. The possibility of sampling bias therefore cannot be excluded.
While the number of Aboriginal and Torres Strait Islander people is small in the survey, the percentage is more than twice the estimated 2.2% of Aboriginal and Torres Strait Islander peoples in the population reported at the 2006 Census.6 This reflects the purposive nature of the sam-pling. Other potential explanations are that hospitals were necessarily aware that an audit was taking place and, during the audit period and administrative staff made a conscious effort to improve reporting of Aboriginal and Torres Strait Islander peoples on the Patient Administra-tion System. Trend informaAdministra-tion obtained from the APDC, however, provided no evidence to suggest this occurred.
The survey determined the level of correct reporting for those Aboriginal and Torres Strait Islander peoples who
agreed to participate in the survey and who chose to identify themselves as Aboriginal or Torres Strait Islander at interview. It is possible that some Aboriginal or Torres Strait Islander patients chose not to identify themselves at interview and on admission.
While reporting of Aboriginal and Torres Strait Islander peoples was reasonably high overall at 91%, there remains room for improvement. Future interventions to increase reporting should target hospitals in major cities, where the level of reporting, at 83%, remains relatively low. The increase in reporting from 88% in 2007 to 91% in 2010 did not achieve statistical significance. Further surveys are needed to confirm that reporting of Aboriginal and Torres Strait Islander peoples is truly improving over time. Future surveys should have an increased sample size and cover a larger number of hospitals to better assess the significance of small increases in reporting and provide a more repre-sentative sample. A greater coverage of hospitals and a larger patient sample size will allow the level of correct reporting to be reliably estimated within levels of geo-graphic remoteness.
Acknowledgment
JPB was employed as part of the NSW Biostatistical Officer Training Program funded by the NSW Ministry of Health.
References
1. Australian Government. Closing the Gap on Indigenous Disadvantage: The Challenge for Australia. Canberra: Australian Government; 2009.
2. Australian Institute of Health and Welfare. National best practice guidelines for collecting Indigenous status in health data sets. Cat. No. IHW 29. Canberra: AIHW, 2010.
3. Australian Institute of Health and Welfare. Indigenous identification in hospital separations data: quality report. Cat. No. HSE 85. Canberra: AIHW; 2010.
4. GISCA. About ARIAþ(Accessibility/Remoteness Index of Australia). Available at: http://www.gisca.adelaide.edu.au/ products_services/ariav2_about.html (Cited 2 May 2011).
5. National Health and Medical Research Council. When does quality assurance in health care require independent ethical review? Canberra: NHMRC, 2003.
6. Australian Bureau of Statistics. Population characteristics, Aboriginal and Torres Strait Islander Australians, New South Wales, 2006. ABS Cat. No. 4713.1.55.001. Canberra: ABS, 2008. Available at: www.abs.gov.au/AUSSTATS/ [email protected]/mf/4713.1.55.001 (Cited 2 May 2011).
Non-intentional farm injury fatalities
in Australia, 2003
–
2006
Tony Lower
A,Band Emily Herde
A AAustralian Centre for Agricultural Health and Safety, The University of Sydney
B
Corresponding author. Email: [email protected]
Abstract: Aim: To describe the pattern of non-intentional farm-related fatalities in Australia for 2003–2006 and examine trends. Methods: Data from the National Coroners Information System were analysed to define all non-intentional farm injury fatalities for the period.Results:The inci-dence of farm fatalities has declined by 44% over the past 20 years from an average of 146 deaths per year to 82 deaths per year. For adults there are high numbers of fatalities related to tractors, quad bikes and farm utilities. Children aged under 15 years account for 17% of fatalities, with dams or other water bodies and quad bikes remaining the most common causes of non-intentional farm fatalities. Almost half of all on-farm non-intentional fatali-ties are non-work-related. Conclusion: Future interventions targeting these priority areas are required to reduce the incidence of non-intentional farm-related fatalities within Australia.
Farming is regarded internationally as a high-risk industry for injury and fatalities.1Despite significant reductions in farm-related fatalities over the past 15 years in Australia, agriculture remains a high-risk industry and lags behind the occupational health and safety gains made in other primary industries such as mining and construction.2,3 Furthermore, as most farms in Australia are family owned and operated, the distinction between the workplace and family home environments is often difficult to discern. In turn, this poses significant challenges for the health and safety of not only farmers and their staff, but also family members and visitors.
The inaugural assessment of farm-related fatalities in Australia was based on data covering the 1989–1992 period.2 In this period there were 587 fatalities, with an annual mean of 146 cases. When examined in respect
to annual deaths per 100 000 employees, the rate of work-related fatalities was 23.3 per 100 000 population. This rate is high compared to an all industries rate of 5.5 per 100 000 population in the same period.4 Additionally, it was identified that the rate of fatal injury per 10 000 farms was 9.1 per year.
With core infrastructure support provided by NSW Health through the former Hunter New England Area Health Service, the Australian Centre for Agricultural Health and Safety has provided research for information on farming-related fatalities, injuries and their prevention for over 2 decades. The National Farm Injury Data Centre within the Australian Centre for Agricultural Health and Safety draws on fatality data from the National Coroners Information System (NCIS).5These data have been used to report on the nature of fatalities in agriculture, with this evidence being employed to drive new preventive programs of work across Australia.2,6,7
This paper presents the most recent data on non-intentional farm fatalities based on the NCIS data for the
![Table 2.Number of services claimed through Medicare Teen Dental Plan items (Dental Benefit Schedule Item No 88000)for the financial years 2008]9 to 2010]2011 for each jurisdiction in Australia](https://thumb-us.123doks.com/thumbv2/123dok_us/58665.2007510/6.595.43.546.110.213/services-claimed-medicare-benefit-schedule-financial-jurisdiction-australia.webp)
![Table 3.Percentage of the NSW teenage population aged 11]18 years claiming Medicare Teen Dental Plan vouchers in 2010](https://thumb-us.123doks.com/thumbv2/123dok_us/58665.2007510/7.595.59.552.100.280/table-percentage-teenage-population-claiming-medicare-dental-vouchers.webp)
![Table 4.Use of public dental services by teenagers aged 12]17 years for each former Area Health Service in NSWfor each year 2002 to 2010](https://thumb-us.123doks.com/thumbv2/123dok_us/58665.2007510/10.595.46.541.650.754/table-public-dental-services-teenagers-health-service-nswfor.webp)
![Table 1.Number of on-farm deaths caused by non-intentionalfarm injury in Australia, 2003]2006, by age and gender](https://thumb-us.123doks.com/thumbv2/123dok_us/58665.2007510/22.595.301.540.108.279/table-number-deaths-caused-intentionalfarm-injury-australia-gender.webp)
![Table 3.Non-intentional work-related farm injury deathsand rates per 100 000 workers in Australia, 2003]2006](https://thumb-us.123doks.com/thumbv2/123dok_us/58665.2007510/23.595.53.560.100.223/table-intentional-related-injury-deathsand-rates-workers-australia.webp)
