AN EXPERIMENTAL STUDY OF SOFTWARE
PROJECT RISKS AND EVOLUTION
Sreedhar .M. Reddy
Scholar,Samskruti College of Engineering and Technology
(Affiliated JNTUH)Kondapur,Ghatkesar,Rangareddy(India)
ABSTRACT
This paper proposes a new approach to software project risk assessment and risk management. , the Process Model-based Risk Assessment method . This process and evolution method assumes explicit modeling of the assessed software process and application of dedicated techniques of risk identification and analysis supported by software tools. The development and application of software exposes the community to various threats. First, the failure of a software project as a business undertaking results in money and time waste as well as a missed business opportunity. The risk of such failure is called the software project risk (software development risk, IT project risk). Another threat pertains to the safety of the citizens and the environment. A failure of a software system may lead to an accident, which, in the worst case, can result in the loss of human life. This is the software safety risk. The last threat materializes when the system’s service is deteriorated or the system’s informational resources are compromised or adversely manipulated after the system’s integrity has been violated through some malicious activity of an attacker. This is the software security risk.
Key Words: Software Engineering,,Software Risks,Software Metrics,Software Measures
I. INTRODUCTION
There are just a few but meaningful examples that software projects have not matured yet to be as predictable
and manageable as other engineering endeavors. PMRA risk assessment process combining the proposed
models and techniques into a consistent framework for continuous software project risk assessment. the
web-based RiskGuide supporting tool that assists in running the PMRA risk assessment process, automates some
aspects of the method application as well as provides a platform for communication on risk particularly to
distributed software projects Available statistics reveal that 70% of software project either deliver their products
later, at a higher cost and with limited utility or do not deliver them at all [CHAOS 2001].
1.1. Software Risk
Despite the progress in technology, the software projects still face the same problems as thirty years ago
[Brooks 1995]. Still, the requirements of the clients are not deeply understood, which results in constant
expansion of the system scope or even in rejection of the final system. The involvement of people is relentlessly
adding the factor of human mind and personality to the technical difficulties of the projects. Finally, the
expectations of the customer are not satisfied. Altogether, it calls for some significant improvements to the
software development and acquisition process..
1.2. Risk Management
Risk management aims at increasing a project‟s chance of success by addressing explicitly the uncertainties of
the future. It involves the assessment of possible pitfalls in the project course and the mitigation of their
destructive potential. Barry W. Boehm, argues that it reduces around 40% of software costs by simply reducing
rework [Boehm 1998]. Risk assessment is a project-wide systematic approach to the identification and analysis
of project risk. It is commonly recognized that effective risk assessment requires communication on risk and risk
documentation as well as the reuse of experiences gathered in the risk knowledge bases, which help in avoiding
known dangers and learning new ones. Risk assessment and its supporting processes can also benefit from
various levels of tool support.
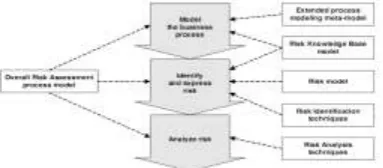
Fig. 1. Overview of the Process Model-based Risk Assessment method
II. ANATOMY OF SOFTWARE PROJECT FAILURE
Partial project failure happens when the system has been delivered to the customer, but some of the
stakeholders‟ success criteria are not satisfied. This covers two major cases: budget or schedule overruns and
downgrading. In the first case, a fully developed system is delivered, but the originally planned budget or
schedule has been exceeded. In the second case, the system is delivered on time and within budget, but its
functionality or quality has been reduced. Complete project failure occurs when the system cannot be delivered
to the customer. This may happen due to running out of funds before the delivery phase (a budget failure) or
delaying the planned delivery so much that the system will no longer add value to the customer‟s business (a
schedule failure). A complete project failure results in project termination. The failure rate of software projects
is high, as shown by numerous surveys conducted in the IT industry Many different risk factors adding to the
failures of software projects have been already identified. Some of these risk factors are quite detailed and
affect only specific projects in specific conditions. Some factors are, however, reported as very commonly
encountered and having strong impact on the project‟s chance of success.
some essential risk factors that appear almost on any list can be distinguished:
• excessive number of requirements changes and ineffective change management
• inaccurate, overly optimistic estimates of schedule and development costs • inadequate design with respect to
functionality and/or performance goals
Additional risk factors are also indicated by particular authors depending on their focus:
• too many development faults and inadequate fault removal capability
•shortchanged quality
• COTS, external components,
• inaccurate metrics, wrong or insufficient measurements,
• poor client‟s strategy and maturity to make use of the information technology
Detailed risk incidents of project failure and their risk factors were observed to depend on the project type .Here
we distinguishes 6 types of software projects (e.g. commercial, military) and for each of them identifies specific
most commonly happening risk incidents. the commercial software projects are most often threatened by:
• inadequate, incomplete, unclear user documentation (70% projects at risk), • low user satisfaction (55%),
• excessive time to market (50%), • harmful competitive actions (45%), • litigation expenses (30%).
Although the situation seems to have improved over the last ten years, the success rate of software projects is
still far from being satisfactory. Risk management aims at increasing the chance of success of a software project
by early identification of project risks and their effective mitigation. The next section overviews the risk
management process and the key principles of successful risk management.
The existing approaches to risk analysis can be roughly divided into qualitative and quantitative. Qualitative
techniques estimate the risk in terms of likelihood and impact and apply ordinal scales and risk matrices as well
as some means of weighting and averaging the obtained score . Quantitative risk analysis calculates the risk
based on the theories of the probability calculus such as Monte Carlo analysis or Bayesian Belief Networks
III. PROCESS MODEL-BASED RISK IDENTIFICATION
The new process model-based approach to risk identification proposed within the PMRA method. In the
following sections, two new risk identification techniques are described: the metrics of process model structure
and the comparison of process models. The final section suggests how the current risk identification practices
can be combined with selected contributions from the PMRA method.
3.1. Metrics of Process Model Structure
This technique involves detecting some disproportions in the process structure, which may indicate risk to the
correct process execution and their further investigation with a set of generic questions. The disproportions
taken into account include:
• high number of other elements related to a given model element (high coupling), and
• extensive output from an element compared to the input to this element (high internal performance), e.g. an activity defined to build 10 output artifacts out of 1 input artifact.
The metrics of process model structure are introduced to highlight the potential flaws in the process design,
focus the analyst attention and provide suggestions in search of process execution risks. The metrics are defined
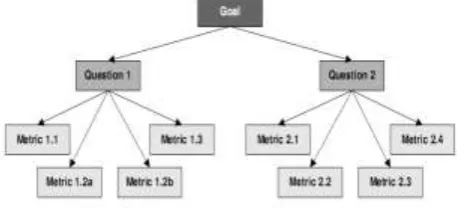
The measurement goal expressed with a GQM pattern is defined as:
Analyze process model for the purpose of risk identification with respect to flawless process structure from the
viewpoint of project manager in the context of project risk management
- M1.1: Number of activities taking a given artifact on input
- M1.2a: Number of input artifact of a given activity
- M1.2b: Total importance (measured with M1.1) of all output artifacts of a given activity
- M1.3: Number of activities, in which a given role participates
• Q2: Are process elements designed adequately to their importance?
- M2.1: Proportion of the activity importance to the number of practices of this activity
- M2.2: Proportion of the artifact importance to the number of features of this artifact
- M2.3: Proportion of the number of features of an artifact on output from an activity to the
total number of quality elements on input to this activity
- M2.4: Proportion of the role importance to the number of capabilities of this role
The entire GQM model of goal, questions and metrics of process model structure is shown in Fig.3
For the purpose of metrics definition, the following sets are defined referring to the relations between model
elements in the RiskSPEM metamodel :
• Ain(Ar) – set of activities that have artifact Ar as input, • Aout(Ar) – set of activities that have artifact Ar as output, • Apart(R) – set of activities in which role R participates,
• Arin(A) – set of input artifacts of activity A, Chapter 5. Process Model-based Risk Identification • Arout(A) – set of output artifacts of activity A,
• Rpart(A) – set of roles participating in activity A, • P(A) – set of practices possessed by activity A, • F(Ar) – set of features possessed by artifact Ar, • C(R) – set of capabilities possessed by role R.
The following sections define the metrics for model element importance and possible risk associated with a
model element as well as the procedure of risk identification with the help of the metrics. In the metrics
definitions, the symbol |A| denotes the cardinality of the set A.
3.2. Metrics for Model Element Importance
Model element importance is defined as measure of impact of that element failure on the entire process. The
metrics of model structure suggesting the importance of different classes of model elements are defined in the
following sections.
M1.1: Importance of Artifact Ar – I(Ar)
• number of activities that have artifact Ar as input Ar ( A ) Ar (I in = , N ) Ar (I ∈ (1)
This metric follows an assumption that the impact of an artifact failure is directly proportional to the number of
activities taking that artifact as input. This is justified by the fact that the more activities take a failed artifact as
input, statistically the more activities and other artifacts the artifact failure will affect.
M1.2: Importance of Activity A – I(A)
a) sum of importance of all output artifacts of activity A N ) A (I ,) Ar (I ) A (I) A ( Ar Ar out
This metric assumes that the impact of an activity failure is directly proportional to the number of output
artifacts of that activity. This is justified by the fact that the more output artifacts a failed activity has,
statistically the more artifacts and other activities that activity failure will affect. To augment the proportion and
increase the resolution of the metric, the total impact of the output artifacts (equation 1) is taken as a measure of
impact of the activity failure instead of the number of output artifacts.
b) number of input artifacts of activity A ) A ( Ar ) A (I in = , N ) A (I ∈ (3)
This metric assumes that the impact of an activity failure is directly proportional to the number of input artifacts
of that activity. This is inspired by the observation that the more input artifacts a failed activity has, the more
work on input artifacts will be wasted and the more new work will be needed on the incorrectly processed input
artifacts to compensate for that failure.
M1.3: Importance of Role R – I(R)
• number of activities in which role R participates
) R ( A ) R (I part= , N ) R (I ∈ (4)
This metric assumes that the impact of a role failure is directly proportional to the number of activities the role
participates in. Again, this is justified by the fact that the more activities the failed role participates in,
statistically the more activities and artifacts that role failure will affect.
3.3. Metrics for Model Element Risk
Model element risk is defined as measure of possibility of element failure and impact of that failure on the entire
process. In the following sections, the metrics of model structure suggesting the possible risk for different
classes of model elements are defined. The metrics follow the general definition of risk introduced in section
2.1.1 and involve the representation of both the impact and the possibility of failure.
M2.1: Risk of Activity A – R(A)
• importance of activity A divided by the number of practices of activity A ) A (P) A (I) A ( R = , }0{ R ) A (
This metric takes into account the risk of event that activity A fails. Activity failure means that it is not
performed as expected and consequently does not produce expected output. It is assumed that the possibility of
activity failure is inversely proportional to the number of practices of that activity. Risk of activity R(A) is
undefined, if activity A does not have any practices (|P(A)| = 0).
M2.2: Risk of Input Artifact Ar – Rin(Ar)
• importance of artifact Ar divided by number of features of artifact Ar ) Ar (F) Ar (I) Ar ( Rin = , }0{ R ) Ar (
Rin ∪∈ + (6)
The above assumption needs further explanation. Let‟s assume that an artifact A having F* features defined
does not introduce any risk it is a perfect artifact. Then, the more of those F* features the artifact actually has,
the less risk it introduces. Hence, the possibility of not having some of those F* features (possibility of input
artifact failure) decreases with the increasing number of features the artifact actually has. Risk of input artifact
Rin(Ar) is undefined, if artifact Ar does not have any features (|F(Ar)| = 0). M2.3: Risk of Output Artifact Ar –
Rout(Ar)
a) risk of developing artifact Ar by activity A is modeled as a number of features of artifact A divided by total
number of features of all input artifacts of activity A plus number of practices of activity A plus total number of
capabilities of all roles participating in activity A
∑ ∑ A ( R R ) A ( Ar ' Ar
Out part in R ( C ) A (P )' Ar (F) Ar (F) A , Ar ( R , }0{ R ) A , Ar ( Rout∪∈ + (7)
This metric assumes that the risk of development of faulty output artifact Ar by an activity A can be estimated
by comparing the „quality potential‟ available on input of the activity to the quality features to be built into the
artifact by that activity. This is based on the observation that the more features of the input artifacts, capabilities
of the roles and practices of the activity (in general, the better their quality), the easier and more reliable it is to
build an output artifact having particular number of features. The input quality potential is assessed by the total
number of quality elements of the input structure elements (artifacts and roles, which are treated here as input)
as well as of the activity itself. Risk of output artifact Rout(Ar,A) is undefined, if all the input artifacts do not
have any features, the roles do not have any capabilities and the activity does not have any practices. This case,
however, is very unlikely.
b) total risk of development of artifact Ar is the risk of development of artifact Ar summed for all activities that
have artifact Ar as output
∑ Ar ( A A) A , Ar ( R ) Ar ( R, }0{ R ) Ar ( Rout∪∈ + (8)
This metric deals with the total degree of risk associated with development of an artifact by many activities in
the process. It is introduced to cover the common case when an artifact is processed by many activities, thus
appears on output of more than one activity. It is assumed that the total risk of artifact development increases
with the increasing number of activities developing that artifact.
M2.4: Risk of Role R – R(R)
• importance of role R divided by number of capabilities of role R ) R ( C) R (I) R ( R = , }0{ R ) R ( R ∪∈ +
(9)
This metric takes into account the risk of event that role R fails. Role failure means that the person playing the
It is assumed that possibility of role failure is inversely proportional to the number of capabilities of that role.
Risk of role R(R) is undefined, if role R does not have any capabilities (|C(R)| = 0). Chapter 5. Process
Model-based Risk Identification
IV. RISK IDENTIFICATION WITH METRICS
This section defines the procedure of risk identification using metrics of model structure. It assumes that the
process model has already been built in terms of the RiskSPEM metamodel .The procedure comprises the
following steps:
Step 1: Calculating Model Metrics
At first, metrics for model element risk should be calculated for all the model elements. As these metrics make
use of the metrics for model element importance, calculating all the metrics is necessary. However, the metrics
for model element risk cannot be calculated if the process model does not define any quality elements to its
structure elements. Step 2: Selecting Candidate Model Elements
Based on the suggestions from the metrics, the candidate model elements that exhibit the greatest disproportions
in design are selected for further investigation. Technically, an arbitrary number of elements of each class, for
which the metrics indicated the highest values, are selected. There is no predefined threshold value for the
values of metrics. It is left to the risk analyst to decide on how many of the elements of particular classes to
select
Step 3: Studying the Context of Selected Model Elements
The model elements selected in previous step are subject to closer examination with a set of generic questions.
The questions aim at investigating the disproportion indicated by the metrics and identifying possible
deficiencies in the closest vicinity (in terms of associated model elements) of a model element.
Step 4: Identifying Risks
Some of the questions asked in the previous step may be answered “No”. Each negative answer suggests
increased risk related to a given model element and indicates a risk factors for the entire project. The actual
flaws in the process design that led to the negative answers form the identified risks. The risk analyst comes to
the conclusion that firstly the project manager participating in the activity does not have sufficient experience
with defining metrics and collecting measures and secondly that there is no project plan, which would define the
need and objects for measurement. Thus, the answer to the posed question is “No”. The identified risks are: • Insufficient experience of project manager
• No project plan
Step 5: Documenting Identified Risks
The identified risks may be documented in the form of natural language statements. However, as argued earlier
in this thesis, such statements often lack accuracy, detail and clear reference to the process. To overcome these
problems, the natural language statements should be built very carefully or, to clearly specify the context of risk,
the risk should be expressed with risk patterns
In our example, the risks identified in the previous step may be documented as:
- natural language: Project manager does not have sufficient experience with defining metrics and collecting
measures to define the measurement plan properly
- risk patterns: If Project Manager<role> loses Experience with defining metrics and collecting
measures<capability> then Measurement Plan<artifact> loses Adequacy<feature>.
• No project plan
- natural language: Without the project plan the measurement plan could miss actual measurement needs and
targets
- risk patterns: If Define Measurement Plan<activity> loses Project Plan<artifact> then Measurement
Plan<artifact> loses Coverage of needs and targets<feature>.
The actual formulation of the pattern-based risk scenarios and the natural language statements is left to the risk
analyst. Some helpful guidelines on risk communication can be found in e.g.
V. COMPARISON OF PROCESS MODELS
This technique is based on comparison of the analyzed model elements to semantically equivalent elements of
the referential model. The surplus and missing elements of the analyzed model and the associations between
them indicate possible risks to the process. The differences between the models are collected on the following
lists (they all relate to the analyzed model):
• list of missing activities, artifacts, roles, practices, features and capabilities, • list of missing associations of activities, artifacts and roles,
• list of surplus activities, artifacts, roles, practices, features and capabilities, • list of surplus associations of activities, artifacts and roles.
Two procedures are proposed for the model comparison: strict comparison and simplified comparison. The
former follows strictly the associations of models defined earlier in the thesis while the latter involves
subjective human reasoning and decision-making. Furthermore, the former is dedicated to the situation when the
analyzed model has been derived from the referential model by means of revision or variant transformations
while the latter covers the opposite case. 5.1. Strict Model Comparison
This technique assumes that the analyzed model has been built as a revision or a variant of the referential model
it is compared to. As a result, the mapping between model elements is defined and can be used to find the
differences between models. The comparison comprises two steps:
Step 1: Finding Surplus Model Elements and Associations
Surplus model elements are these elements of the analyzed model for which no mapping is defined - they are not
mapped on any elements of the referential model.
Associations between structure elements of the analyzed model are considered surplus in two cases:
• both associated elements are not surplus and an association is not present between the structure elements of
the referential model they are mapped to,
• either of the two associated structure elements is surplus.
The elements of the referential model for which no mapping is defined (they are not mapped by any element of
the analyzed model) are considered missing in the analyzed model. Associations missing in the analyzed model
are the associations in the referential model for which:
• both associated elements are not missing and an association is not present between the structure elements of
the analyzed model they are mapped to,
• either of the two associated structure elements is missing. As it can be seen from the above definitions,
missing analyzed model elements and associations are simply surplus model elements and associations but from
the viewpoint of the referential model.
VI.PROCESS MODEL-BASED RISK IDENTIFICATION
6.1. Simplified Model Comparison
In practice, the most common case is that the analyzed model in not derived from the referential model with
revision or variant transformations and the models must be compared manually by a human. Then the complete
mapping need not be built, as the human mind is able to decide on the fly whether compared elements are
equivalent or not. A practical procedure for use by humans involves the following steps:
Step 1: Selecting the Referential Model
First, the referential model must be selected for comparison. A good referential model should be:
• relevant – defining approximately the same type of process (e.g., software project), • thorough – covering thoroughly the scope of the process,
• detailed – distinguishing many discrete model elements,
• quality-oriented – defining many quality attributes (quality elements) for the structure elements, • RiskSPEM compatible – already built or possible to build in terms of RiskSPEM metamodel.
The Rational Unified Process [RUP] satisfies the above criteria as a referential model for software projects.
Step 2: Finding Differences between Models
A procedure of manual model comparison comprises the following steps:
1. Browse the analyzed model and for each structure element check if the referential model includes any
equivalent structure element
1a. if it does not, note the difference in a list of surplus structure elements
1b. if it does, check the associations of that equivalent structure element with other structure elements as well as
its quality elements and note any differences in the lists of missing or surplus associations, mark the equivalent
structure element
2. Browse the referential model and note each unmarked structure element in the list of missing structure
elements
6.2. Identifying and Documenting Risks
Assuming that the referential model involves little risk (that is why it was chosen as the referential model!) any
differences between the compared models may indicate potential risk in the analyzed model. It should be noted
that some of the identified differences might be accepted as they were introduced intentionally to the analyzed
compensated by the benefits from that adaptation. However, the list of such accepted differences should be
explicitly stored and periodically reviewed. The fact that the model (unacceptably) misses or adds an element or
an association is the identified risk. Analogously to the technique of risk identification with metrics of model
structure, the identified risks may be documented in natural language or as pattern-based risk scenarios. For
example, model comparison revealed that the analyzed model misses an activity „Change Management‟. Hence, a risk „No change management‟ is identified. This risk may be documented as:
• natural language: No change management defined for the project • risk patterns: Change Management<activity> is not performed.
6.3. Extending Current Risk Identification Practices
The previous sections presented new risk identification techniques making use of explicit process modeling and
risk patterns. Upon extending, the current risk identification practices may use the process model to:
• clearly specify the context in which the risk is sought for, • ensure scope coverage,
• guide the search for risk through the process.
The risk patterns can be used in documenting the identified risks to:
• avoid ambiguity and too high generality,
• specify the identified risks with clear reference to the context (the process), • build risk scenarios.
6.4. Extending Checklists
Proposed extensions for checklists cover three areas: setting the scope of risk identification, checklist generation
and documentation of the identified risks. Firstly, the contemporary technique based on checklists may be
extended by providing for setting the scope of analyses easier. In general, using checklists implies strict scope
control. Setting the scope, however, is not an easy task without some taxonomy of the analyzed process. Explicit
process model defines a perfect taxonomy of the process. Making use of the process model, the scope of the
checklist application may be clearly set. As the process is modeled around its activities, the scope of risk
identification is set by selecting particular activities for investigation. Work session starts with known target
risks. Consulting the process model can also help in risk discovery as it can stimulate participants‟ thoughts,
focus their attention on particular areas of the process and guide them through the process. The flowchart for the
extended group work session is presented in Fig. 4.
Fig.4. Model-based risk identification in a group work session
Both techniques explicitly refer to the process model to help the risk analyst in the investigation of the process
disproportions in process design potentially being flaws that may pose risk to process execution. The second
technique searches for the differences between the analyzed and the referential model. It provides for controlling
the scope of the analyses and ensures their feasibility in reasonable time. Moreover, the techniques are subject to
automated tool support.
6.5. Risk Snapshots
Risk snapshot is defined as a set of identified risk scenarios selected from all the identified risk scenarios
according to the snapshot criteria. Risk snapshot provides the primary workspace during the risk analysis. The
role of the risk snapshot in the context of risk assessment is outlined in Fig. 4.
Fig. 5. The idea and context of a risk snapshot Chapter 6. Risk Analysis
Risk snapshot is defined by the following snapshot criteria:
• timeframe – the period of time the risk identified in should be included in the risk snapshot. The timeframe
may be one continuous period or a set of (disjoint) time windows. In case risk identification is structured into
discrete events such as reviews, the timeframe must cover entire reviews (it cannot enclose partial review
results). In this case, instead of defining the timeframe, the set of risk identification events (e.g. reviews) may be
selected. When building the risk snapshot, the identified risks are filtered according to the criteria set by the
scope, participants and techniques defined for the snapshot. This feature of risk snapshots allows dividing large
sets of information on risk into smaller parts for easier analysis as well as provides for multi-facet risk analysis
according to different dimensions of scope, participants and techniques.
VII. CONCLUSIONS
Software projects continually show high rate of failure, which appears even more serious when compared to
other engineering disciplines such as construction or mechanics. The unsuccessful performance from numerous
software projects adds up to a massive waste of money and time missed business opportunities, and increasing
social distrust in the information technologies Many approaches have been already proposed under a common
flag of the risk management toincrease the projects‟ chance of success.
REFERENCES
[1] [Adams 1995] Adams J., Risk, UCL Press, 1995
[2] [AIRMIC 2002] A Risk Management Standard, The Institute of Risk Management,
[3] ALARM The National Forum for Risk Management in the Public Sector, The Association of Insurance and
Risk Managers, UK, 2002
[4] [Applegate et al. 1996] Applegate L.M., McFarlan F.W., McKenney J.L., Corporate Information Systems
[5] [AS/NZS 4360] AS/NZS 4360:2004 Australian Standard: Risk management, Standards Australia, 2004
[6] [Avižienis et al. 2004] Avižienis A., Laprie J.-C., Randell B., Landwehr C., Basic Concepts and Taxonomy
of Dependable and Secure Computing, IEEE Transactions on Dependable and Secure Computing, vol. 1,
no. 1, 2004
[7] [Barki et al. 1993] Barki H., Rivard S., Talbot J., Toward an Assessment of Software Development Risk,
Journal of Management Information Systems, Vol. 10, No. 2, 1993, pp. 203-225
[8] [Beynon-Davis 1995] Beynon-Davis P., Information Systems Failure: The Case of the London Ambulance
Service's Computer Aided Dispatch System, European Journal of Information Systems, Vol. 4, 1995, pp.