IJE Transactions A: Basics Vol. 23, Nos. 3 & 4, November 2010 - 215
MATHEMATICAL MODELING AND PERFORMANCE
OPTIMIZATION FOR THE DIGESTING SYSTEM OF A PAPER
PLANT
R. Khanduja*
Department of Mechanical Engineering, Yamuna Institute of Engineering and Technology, Village Gadholi, Yamuna Nagar -133103 Haryana, India
P.C. Tewari
Department of Mechanical Engineering, National Institute of Technology, Kurukshetra-136119, Haryana, India
D. Kumar
Department of Mechanical & Industrial Engineering, Indian Institute of Technology, Roorkee, Uttranchal-247667, India
* Corresponding Author
(Received: December 6, 2009 – Accepted in Revised Form: July 15, 2010)
Abstract This paper deals with the mathematical modeling and performance optimization for the
Digesting system of a Paper Plant using Genetic Algorithm. The Digesting system of a Paper Plant has four main subsystems, arranged in series and parallel. Considering exponential distribution for the probable failures and repairs, the mathematical formulation of the problem is done using probabilistic approach and differential equations are developed based on Markov birth-death process. Then, these equations are solved using normalizing conditions to determine the steady state availability of the Digesting system. The performance of each subsystem of the Digesting system in a Paper Plant has also been optimized using Genetic Algorithm. Therefore, the findings of the present paper will be highly useful to the plant management for the timely execution of proper maintenance decisions and hence to enhance the system performance.
Keywords: Performance Optimization, Digesting System, Genetic Algorithm
ﮑﭼ ﻴ ﻩﺪ
ﺍﻳ ﺯﺎﺳﻝﺪﻣﺎﺑﻪﻟﺎﻘﻣﻦ ﻱ ﺭﻳ ﺿﺎ ﻲ ﻬﺑ ﻭ ﻴ ﺯﺎﺳ ﻪﻨ ﻱ ﺩﺮﮑﻠﻤﻋ ﻱ ﺭﻮﮕﻟﺍ ﺯﺍﻩﺩﺎﻔﺘﺳﺍﺎﺑ ﻳ ﺘﻧﮊ ﻢﺘ ﻴ ﺍﺮﺑﮏ ﻱ ﺳ ﻴ ﻢﺘﺴ ﻢﻀﻫ ﻳ ﺩﺭﺍﺩﺩﺮﺑﺭﺎﮐﺬﻏﺎﮐﻪﻧﺎﺧﺭﺎﮐﮏ
.
ﺳ ﻴ
ﻢﻀﻫﻢﺘﺴ
ﻳ ﺍﺭﺍﺩﺬﻏﺎﮐﻪﻧﺎﺧﺭﺎﮐﮏ ﻱ ﺯﺭﺎﻬﭼ ﻳ ﺳﺮ ﻴ ﻠﺻﺍﻢﺘﺴ ﻲ ﻪﺑﻪﮐﺖﺳﺍ
ﺮﺳ ﺕﺭﻮﺻ
ﻱ ﺯﺍﻮﻣ ﻭ ﻱ
ﺪﻧﺍ ﻩﺪﺷ ﺐﺗﺮﻣ
.
ﺯﻮﺗ ﻳ ﻧﺍﻮﺗ ﻊ ﻲ ﺍﺮﺑ ﻩﺪﺷ ﻪﺘﻓﺮﮔ ﺮﻈﻧﺭﺩ ﻱ
ﻘﻧ ﺎﻳ
ﻤﻌﺗ ﻭ ﺺ
ﻴ ﻟﺎﻤﺘﺣﺍ ﺕﺍﺮ ﻲ ، ﺳﻻﻮﻣﺮﻓ ﻴ ﺭﻥﻮ ﻳ ﺿﺎ ﻲ ﺩﺕﻻﺩﺎﻌﻣﺯﺍﻩﺩﺎﻔﺘﺳﺍﺎﺑﻪﻠﺌﺴﻣ ﻳ
ﺴﻧﺍﺮﻔ ﻴﻠ ﻲ ﺬﭘﻝﺎﻤﺘﺣﺍﺵﻭﺭ ﻭ ﻳﺮ ﻱ ﺎﭘﺮﺑ ﻳ ﺍﺮﻓﻪ ﻳ ﺪﻟﻮﺗﺪﻨ -ﮒﺮﻣ ﻭﻮﮐﺭﺎﻣ (Markov) ﻪﻌﺳﻮﺗ ﻳ ﺖﺳﺍ ﻪﺘﻓﺎ . ﺍ ،ﺲﭙﺳ ﻳ ﺍﺮﺷ ﺯﺍ ﻩﺩﺎﻔﺘﺳﺍ ﺎﺑ ﺕﻻﺩﺎﻌﻣ ﻦ ﻳ
ﺯﺎﺳ ﻝﺎﻣﺮﻧ ﻂ
ﻱ ﺍﺮﺑ ﻱ ﻌﺗ ﻴﻴ ﻦ ﺩﻮﺟﻮﻣ ﻳ ﺖﻟﺎﺣﺖ ﻳ ﺳﺖﺧﺍﻮﻨﮑ ﻴ
ﺖﺳﺍﻩﺪﺷﻞﺣ،ﻢﻀﻫﻢﺘﺴ
.
ﻨﭽﻤﻫ ﻴ ﺯﺮﻫﺩﺮﮑﻠﻤﻋ،ﻦ ﻳ
ﺳﺮ ﻴ ﺳﺯﺍﻢﺘﺴ ﻴ
ﺭﺩﻢﻀﻫﻢﺘﺴ
ﺭﻮﮕﻟﺍ ﺯﺍ ﻩﺩﺎﻔﺘﺳﺍ ﺎﺑ ﺬﻏﺎﮐ ﻪﻧﺎﺧﺭﺎﮐ ﻳ
ﺘﻧﮊ ﻢﺘ ﻴ
ﻬﺑ ﮏ
ﻴ
ﺖﺳﺍ ﻩﺪﺷ ﻪﻨ
. ﺍﺮﺑﺎﻨﺑ ﻳ ،ﻦ ﻳ ﺎﻫ ﻪﺘﻓﺎ ﻱ ﺍﺮﺑ ﺮﺿﺎﺣ ﻪﻟﺎﻘﻣ ﻱ ﺪﻣ ﻳﺮ ﻳ ﺖ ﺍﺮﺑﻪﻧﺎﺧﺭﺎﮐ ﻱ ﻤﺼﺗﺍﺮﺟﺍ ﻴ ﺎﻬﻤ ﻱ ﺭﺍﺪﻬﮕﻧﺩﺭﻮﻣﺭﺩ ﻱ
ﺘﻧﺭﺩﻭﺐﺳﺎﻨﻣ ﻴ
ﺍﺰﻓﺍﻪﺠ ﻳ
ﺳﺩﺮﮑﻠﻤﻋﺶ
ﻴ ﺴﺑﻢﺘﺴ ﻴ ﻔﻣﺭﺎ ﻴ ﺪﻫﺍﻮﺧﺪ ﺩﻮﺑ .
1. INTRODUCTION
The paper industry comprises of large complex engineering systems arranged in
series, parallel or a combination of both the configurations. Some of these systems are chipping, cooking, washing, bleaching, screening, stock preparation and paper [email protected]
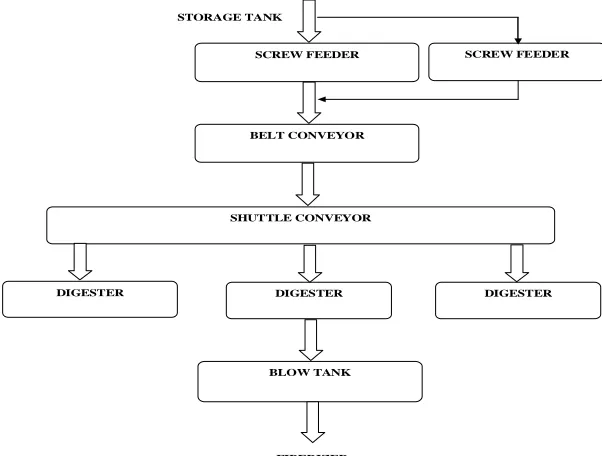
making, etc. These systems are normally arranged in hybrid configuration. The important process of a paper industry, upon which the quality of paper depends, is the Digesting process. In the process of paper formation, the chips from storage are fed in to a digester. A chemical compound, Sodium Hydroxide (NaOH) is added to digester and the steam is forced from the bottom. The wooden chips are cooked for about 8 to 10 hrs
so that lignin and other fibers present in the wooden chips get dissolved. Then, these cooked chips are flown to blow tank in which black liquid is added for dilution. These cooked chips are passed through various systems like washing, bleaching, screening, stock preparation and paper making, etc. to convert into the paper. The schematic flow diagram of the Digesting system is shown in Figure 1.
BELT CONVEYOR SCREW FEEDER
SHUTTLE CONVEYOR
DIGESTER
BLOW TANK
SCREW FEEDER
DIGESTER STORAGE TANK
FIBERIZER DIGESTER
Figure 1. Schematic flow diagram of digesting system
1.1 Literature Review The available literature reflects that several approaches have been used to analyze the steady state behavior of various systems. Dhillon et al. [1] have frequently used the Markovian approach for the availability analysis, using exponential distribution for failure and repair times. Kumar, D. et al. [2, 3, 4] dealt with reliability, availability and operational behavior analysis for different systems in paper plant. Kumar et al. [2, 4] dealt with maintenance planning for the systems in fertilizer and thermal plants. Srinath [5] has proposed the mathematical models for the prediction of reliability and availability. Kalyanmoy Deb [6] has explained the optimization techniques and how they can be used in the engineering problems. Shooman [7] suggested different methods for the reliability computations of systems with
IJE Transactions A: Basics Vol. 23, Nos. 3 & 4, November 2010 - 217
optimization parameters. Genetic Algorithm was used to reach the objective of availability, considering installation and maintenance costs. Chales and Kondo [13] tackled a multiobjective combinatorial optimization problem. They used Genetic Algorithm to optimize the availability and cost of a series and parallel repairable system. Fricks and Trivedi [14] stressed upon importance analysis with Markov Chains. Tewari et al. [15] dealt with the determination of availability for the systems with elements exhibiting independent failures and repairs or the operation with standby elements for sugar industry. Madhu Jain et al. [16] discussed the reliability analysis of redundant repairable system with degraded failure. Kumral [17] dealt with reliability-based optimization of a mine production system using Genetic Algorithm where as Tewari et al. [18] dealt with mathematical modeling and behavioral analysis for a refining system of a sugar industry using Genetic Algorithm. Marseguerra et al. [19] has explained the basics of Genetic Algorithm (GA) optimization for RAMS applications i.e. use of Genetic Algorithm within the area of reliability, availability, maintainability and safety (RAMS) optimization. Sunand et al. [20] discussed simulated availability of CO2 cooling system in a fertilizer plant. Barabady [21] presented a case study describing the reliability and availability analysis of crushing plant in Jajarm Bauxite mine of Iran. Rajiv et al. [22, 23] have developed performance evaluation system for Screening Unit of Paper Plant. He also dealt with availability of bleaching system of paper plant. Sachdeva et al. [24] dealt with the reliability analysis of pulping system in paper industry Ying-Shen Juang et al. [25] proposed a Genetic Algorithm based optimization model to optimize the availability for a series parallel system. The objective was to determine the most economical policy of component’s mean time between failure (MTBF) and mean time to repair (MTTR).. S. Gupta et al. [26] dealt with the reliability and availability analysis of coal handling unit of a steam thermal power plant using the concept of performance modeling and analysis. Michael et al. [27] dealt with availability analysis of transmission system (live case of Goa Electricity Department) using Markov model. In this, the laplace transition
matrix involved in stochastic modeling has been solved by using algorithm developed in MATLAB. Nakagawa et al. [28] analyzed the reliability optimization problem using the concept of the reversed failure rate. Sanjeev et al. [29] dealt with simulation model for evaluating the performance of Urea Decomposition System in a Fertilizer Plant. Wang et al. [30] performed the reliability optimization of a series-parallel system with fuzzy approach. Garg et al. [31] discussed about the availability and maintenance scheduling of a repairable block-board manufacturing system.
In this paper, the mathematical (availability) model has been developed to evaluate the performance of Digesting system of a paper plant on the basis of certain assumptions. After that, the performance optimization using Genetic Algorithm Technique (G.A.T.) is done, which gives the optimum system availability levels for different combinations of failure and repair rates of the subsystems of Digesting system for improving the performance of the paper plant. So, the findings of the present paper will be highly useful to the plant management in futuristic maintenance planning and control to enhance the system performance.
2. SYSTEM DESCRIPTION
The Digesting system of a paper plant comprises of four main subsystems with following description:
I. Subsystem B1: It consists of two screw feeder
unit out of which one is standby. The function of screw feeder is to extract the wooden chips from storage silos and transfer it to the belt conveyor. When both screw feeders fails, it causes the complete failure of the system.
II. Subsystem B2: It consists of one belt conveyor
unit to carry the chips . When belt conveyor fails, it causes the complete failure of the system.
III. Subsystem B3: It consists of one shuttle
conveyor fails, it causes the complete failure of the system.
IV. Subsystem B4: It consists of three digester
units in parallel to cook the wooden chips. If one digester fails, the system is subjected to reduce capacity. When all the three digesters fail at a time, it causes the complete failure of the system.
3. ASSUMPTIONS
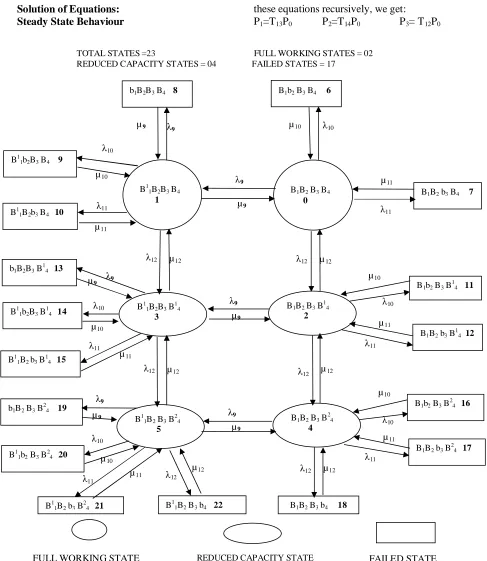
The transition diagram (figure-2) of the Digesting system shows the three states, the system can acquire i.e. full working, reduced capacity and failed state. Based on the transition diagram, a performance-evaluating model has been developed. The following assumptions are addressed in developing the probabilistic models for the Digesting system of the paper plant concerned:
1. Failure/repair rates are constant over time and statistically independent.
2. A repaired subsystem is as well as new, performance wise for a specified duration. 3. Sufficient repair facilities are provided, i.e.
No waiting time to start the repairs.
4. Standby units (if any) are of the same nature and capacity as the active units.
5. System failure /repair follow exponential distribution.
6. Service includes repair and /or replacement. 7. System may work at a reduced capacity. 8. There are no simultaneous failures among
systems.
4. MATHEMATICAL MODELING
The mathematical modeling is carried out using simple probabilistic considerations and differential equations are developed on the basis of Markov birth-death process. These equations are further solved for determining the steady state availability of the Digesting system. Various probability considerations give the following differential equations associated with the Digesting system:
This system consists of twenty three states as:
States 0 to 1 show Full capacity working. States 2 to 5show Reduced capacity working. States 6 to 22 show that unit is in failed state due to complete failure of one or the other subsystem of the unit.
The difference differential equations associated with the transition diagram (Figure2) of Digesting system are:
P'0(t)+
∑
= 129
i i
λ P0(t)=µ1P1(t)+
∑
= 1110
i i
µ Pi-4(t)+
µ12P2(t) (1) P'1(t)+
∑
= 12
9
i i
λ P1(t)+µ9P1(t)=
∑
= 119
i i
µ Pi-1(t)+
µ12P3(t)+λ9P0(t) (2) P'2(t)+
∑
= 12
9
i i
λ P2(t)+µ12P2(t)=
∑
= 1110
i i
µ Pi+1(t)+
λ12P0(t)+µ9P3(t)+µ12P4(t) (3)
P'3(t)+
∑
= 129
i i
λ P3(t)+µ9P3(t)+µ12P3(t)=
∑
= 11
9
i i
µ Pi+4(t)+λ9P2(t)+λ12P1(t)+µ12P5(t) (4)
P'4(t)+
∑
= 129
i i
λ P4(t)+µ12P4(t)=
∑
= 1210
i i
µ Pi+6(t)+λ12P2
(t)+µ9P5(t) (5)
P'5(t)+
∑
= 129
i i
λ P5(t)+µ9P5(t)+µ12P5(t)=
∑
12=9
i i
µ Pi+10(t)+λ9P4(t)+λ12P3(t) (6)
P'i(t) +µ9Pi(t)=λ9Pj(t) where j=1,3,5 i=8,13,19 (7)
P'i(t)+µ10Pi(t)=λ10Pj(t) where
j=0,1,2,3,4,5 i=6,9,11,14,16,20 (8)
P'i(t)+µ11Pi(t)=λ11Pj(t) where
j=0,1,2,3,4,5 i=7,10,12,15,17,21 (9)
P'i(t) +µ12Pi(t)=λ12Pj(t) where
IJE Transactions A: Basics Vol. 23, Nos. 3 & 4, November 2010 - 219
With initial conditions at time t = 0 Pi(t) = 1 for i = 0
= 0 for i ≠ 0
Solution of Equations: Steady State Behaviour
The steady state behavior of the Digesting system can be analyzed by setting d/dt = 0 and t →∞ in equations (1) to (10) and solving
these equations recursively, we get: P1=T13P0 P2=T14P0 P3= T12P0
B11B2B3 B4
1
B1B2 B3 B4
0
B1B2 B3 B14
2 B1
1B2B3 B14
3
B1B2 B3 B24
4 B11B2 B3 B24
5
B1B2 B3 b4 18
B11B2 B3 b4 22
B11B2 b3 B 2
4 21
B1b2 B3 B4 6
b1B2B3 B4 8
TOTAL STATES =23 FULL WORKING STATES = 02 REDUCED CAPACITY STATES = 04 FAILED STATES = 17
B1B2 b3 B4 7
B1b2 B3 B 1
4 11
B1B2 b3 B14 12
B1b2 B3 B24 16
B1B2 b3 B24 17
B11b2B3 B4 9
B11B2b3 B4 10
b1B2B3 B14 13
B11b2B3 B14 14
B11B2 b3 B14 15
b1B2 B3 B24 19
B11b2 B3 B24 20
µ9 λ9 λ10
λ10
λ10 λ10 λ10
µ10
µ10
µ10
µ10
µ10
µ10 λ10
λ9
λ9
λ9
λ9
λ9
µ9
µ9
µ9
µ9
µ9
λ11
λ11
λ11
λ11 λ11
λ11
µ11
µ11
µ11
µ11
µ11
µ11
µ12
µ12
µ12
µ12
µ12
µ12 λ12
λ12
λ12 λ12
λ12 λ12
FAILED STATE REDUCED CAPACITY STATE
FULL WORKING STATE
P4= T15P0 P5=T16P0 P6=B2P0 P7=B3P0 P8=B1T13P0 P9= B2T13P0
P10=B3T13P0 P11=B2T14P0 P12=B3T14P0
P13=B1T12P0 P14=B2T12P0 P15=B3T12P0 P16=B2T15P0 P17=B3T15P0 P18=B4T15P0
P19=B1T16P0 P20=B2T16P0 P21= B3T16P0 P22= B4T16P0
where, Bi = λi/µi i= 9,10,11,12
T=λ9+λ12, T1=λ12+µ9, T2= λ9+λ12+µ12 T3=λ12+µ9+µ12, T4=λ9+µ12, T5=µ9+µ12
T7=[(T/µ12)-{(λ9*µ9)/(T1*µ12)}], T8= µ9/T1 T9=[(T2*T4)/(µ9*µ12)-{(λ
9*T2)/(T5*µ12)}-(λ12/µ9)]
T10=[(λ12*T4)/(µ12*µ9)+{(λ9*λ12/ T5*µ12)}]
T11=[(T4/µ12)+{(λ9*µ9/T5*µ12}+( λ12/ T5)], T12=[{( T7*T9)-T10}/{T11+( T8* T9)}]
T13=[{λ9+(T12*µ12)}/T1], T14= [{T-(µ9* T13)}/ µ12]
T15= [{(T2* T14)- λ12-(µ9* T12)}/ µ12], T16= [{(λ9* T15) + (λ12* T12)}/ T5]
Use of Normalizing condition i.e. sum of all the state probabilities is equal to one [
∑
= 22
0
i i
P =1] gives:
T13P0+T14P0+T12P0+T15P0+T16P0+B2P0+B3P0+ B1T13P0+B2T13P0+B3T13P0+B2T14P0+
B3T14P0+BT12P0+B2T12P0+B3T12P0+B2T15P0+B 3T15P0+B4T15P0+B1T16P0+B2T16P0+
B3T16P0 +B4T16P0 =1
P0=1/[T13+T14+T12+T15+T16+B2+B3+B1T13+B2 T13+B3T13+B2T14+B3T14+B1T12+B2T12+B3T12+ B2T15+B3T15+B4T15+B1T16
+B2T16+B3T16+B4T16] (11)
Now, the steady state availability (Av.) of the Digesting system is given by summation of all the full working and reduced capacity states probabilities.
Hence, Av. =
∑
= 50
i
Pi
Av. = P0 + P1+ P2+ P3+ P4+ P5
Availability(Av.)=1+T13+T14+T12+T15+ T16)/[1+T13+T14+T12+T15+T16(1+B2+B3)
+B1(T13+T12+T16)+B4(T15+T16)] (12) Here, system performance was evaluated in terms of availability.
5. GENETIC ALGORITHM
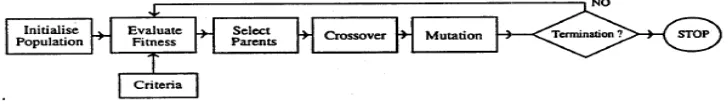
Genetic Algorithms are computerized search and optimization algorithms based on the mechanics of natural genetics and natural selection. Genetic Algorithms have become important because they are found to be potential search and optimization techniques for complex engineering optimization problems. The action of Genetic Algorithm shown in figure 3 for parameter optimization in the present problem can be stated as follows:
1. Initialize the parameters of the Genetic Algorithm.
2. Randomly generate the initial population and prepare the coded strings.
3. Compute the fitness of each individual in the old population.
4. Form the mating pool from the old population.
5. Select two parents from the mating pool randomly.
6. Perform the crossover of the parents to produce two off springs.
7. Mutate if required.
8. Place the child strings to new population. 9. Compute the fitness of each individual in
new population.
10.Create best-fit population from the previous and new population.
11.Repeat the steps 4 to 10 until the best individuals in new population represent the optimum value of the performance function (System Availability)
IJE Transactions A: Basics Vol. 23, Nos. 3 & 4, November 2010 - 221 6. PERFORMANCE OPTIMIZATION
USING GENETIC ALGORITHM
The performance optimization of the Digesting system is highly influenced by the failure and repair parameters of each subsystem. These parameters ensure high performance of the Digesting system. Genetic Algorithm is hereby proposed to coordinate the failure and repair parameters of each subsystem for stable system performance i.e. high availability. Here, number of parameters is four (four failure parameters and four repair parameters). To use Genetic Algorithm for solving the given problem, the chromosomes are to be coded in real structures. Unlike, unsigned fixed point integer coding parameters are mapped to a specified interval [X min, X max], where X min and X max are the minimum and maximum values of system parameters, respectively.The maximum value of the availability function corresponds to optimum values of system parameters. These parameters are optimized according to the performance index i.e. desired availability level. To test the proposed method, failure and repair rates are determined simultaneously for optimal value of unit availability. Effect of number of generations, population and crossover probability size on the availability of the Digesting system is shown in Table 1, 2 and 3. To specify the computed simulation more precisely, trial sets are also chosen for Genetic Algorithm and system parameters. The performance [availability] of the Digesting system is evaluated using the designed values of the unit parameters.
Failure and Repair Rate Parameter Constraints are λ9, µ9, λ10, µ10, λ11, µ11, λ12, µ12.
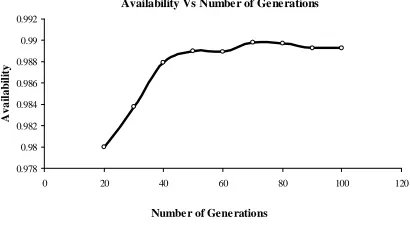
Here, real-coded structures are used. The simulation is done to maximum number of generations, which is varying from 20 to 100.
The effect of number of generations on availability of the Digesting system is shown in Figure 4.
0.978 0.98 0.982 0.984 0.986 0.988 0.99 0.992
0 20 40 60 80 100 120
Numbe r of Gene rations
A
v
a
il
a
b
il
ity
Availability Vs Number of Generations
Figure 4. Effect of number of generations on
fitness (digesting unit availability)
The optimum value of system’s performance is 98.98%, for which the best possible combination of failure and repair rates is λ9 = 0.008, µ9 = 0.2210, λ10 = 0.0077, µ10 = 0.2019, λ11 =0.008, µ11 = 0.2010, λ12 = 0.0069, µ12 = 0.0510 at generation size 70 as given in Table 1.
Now, the simulation is done to maximum number of population size, which is varying from 20 to 100. The effect of population size on availability of the Digesting system is shown in Figure 5.
0.98 0.982 0.984 0.986 0.988 0.99 0.992
0 20 40 60 80 100 120
Population Size
A
v
a
il
a
b
ili
ty
Availability Vs Population Size
Figure 5. Effect of population size on fitness
(digesting unit availability) Parameters Minimum Maximum
λ9 0.002 0.008
µ9 0.2 0.5
λ10 0.002 0.008
µ10 0.2 0.5
λ11 0.002 0.008
µ11 0.2 0.5
λ12 0.001 0.007
Table 1: Effect of Number of Generations on Availability of the Digesting System Using Genetic Algorithm. (Mutation Probability = 0.015, Population Size = 80, Crossover Probability = 0.90
Number of
Generations Availability λ9 µ9 λ10 µ10 λ11 µ11 λ12 µ12
20 0.98 0.0074 0.2937 0.0078 0.2013 0.0079 0.20 0.0066 0.0526
30 0.9838 0.0079 0.2033 0.0079 0.20 0.008 0.20 0.007 0.05
40 0.9879 0.008 0.2213 0.008 0.20 0.0079 0.20 0.007 0.05
50 0.989 0.008 0.2690 0.008 0.20 0.008 0.20 0.007 0.05
60 0.9889 0.008 0.2177 0.008 0.20 0.008 0.20 0.007 0.0576
70 0.9898 0.008 0.2210 0.0077 0.2019 0.008 0.2010 0.0069 0.0510
80 0.9897 0.0079 0.2100 0.0078 0.2016 0.0078 0.2013 0.0069 0.0516 90 0.9893 0.008 0.2410 0.0079 0.2015 0.0078 0.2017 0.0069 0.05 100 0.9893 0.008 0.2412 0.0079 0.2016 0.008 0.2014 0.0069 0.0510
Table 2: Effect of Population Size on Availability of the Digesting System Using Genetic Algorithm. (Mutation Probability=0.015, Number of Generations=80, Crossover Probability=0.90)
Population Size
Availability λ9 µ9 λ10 µ10 λ11 µ11 λ12 µ12
20 0.9806 0.006 0.2128 0.008 0.2135 0.0075 0.2001 0.0065 0.0541
30 0.9838 0.008 0.20 0.008 0.20 0.008 0.20 0.007 0.05
40 0.9875 0.008 0.2011 0.0079 0.2100 0.008 0.2012 0.0068 0.0511 50 0.9888 0.0076 0.2112 0.008 0.20 0.0079 0.2119 0.007 0.0782
60 0.9903 0.0078 0.2098 0.008 0.20 0.0079 0.2100 0.007 0.0691
70 0.9901 0.008 0.2011 0.0078 0.2090 0.008 0.2040 0.0069 0.0710
80 0.9888 0.008 0.20 0.008 0.20 0.008 0.20 0.007 0.0510
90 0.9887 0.008 0.2015 0.008 0.20 0.008 0.20 0.007 0.0518
100 0.9885 0.008 0.20 0.008 0.20 0.008 0.20 0.007 0.05
The optimum value of system’s performance is 99.03%, for which the best possible combination of failure and repair rates is λ9 = 0.0078, µ9 = 0.2098, λ10 = 0.008, µ10 = 0.20, λ11 =0.0079, µ11 = 0.2100, λ12 = 0.007, µ12 = 0.0691 at population size 60 as given in Table 2.
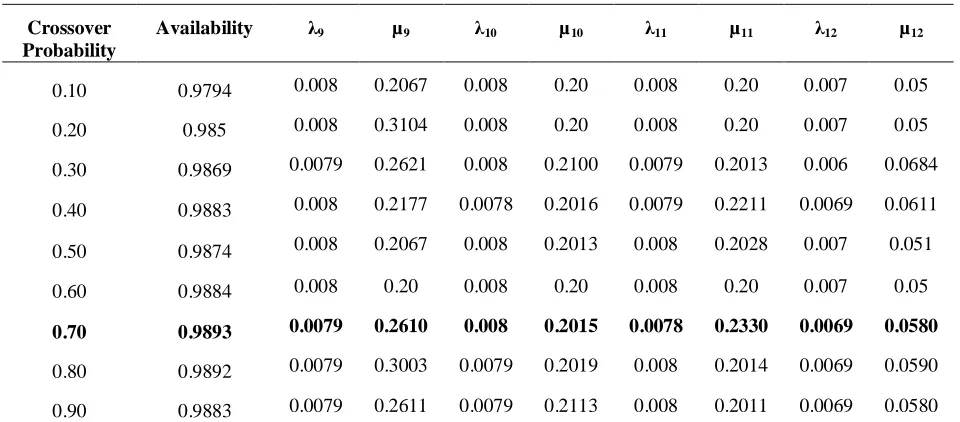
IJE Transactions A: Basics Vol. 23, Nos. 3 & 4, November 2010 - 223 Table 3: Effect of crossover probability on availability of the digesting system using genetic algorithm
(Mutation Probability=0.015, Number of Generations=80, Population Size=80)
0.978 0.98 0.982 0.984 0.986 0.988 0.99
0 0.1 0.2 0.3 0.4 0.5 0.6 0.7 0.8 0.9 1
Crossove r Probability
A
va
il
a
b
il
ity
Availability Vs Crossover Probability
Figure 6. Effect of Crossover Probability on
Fitness (Digesting Unit Availability)
The optimum value of system’s performance is 98.93%, for which the best possible combination of failure and repair rates is λ9 = 0.0079, µ9 = 0.2610, λ10 = 0.008, µ10 = 0.2015, λ11 = 0.0078, µ11 = 0.2330, λ12 = 0.0069, µ12 = 0.0580 at crossover probability 0.70 as given in Table 3.
The above values reveal that to achieve the optimum unit availability level, the corresponding repair and failure rates of the subsystems should be maintained. The failure rates can be reduced using good design, reliable machines and providing standbys etc.
The repair rates can be improved by employing more workers for repair and utilizing better repair facilities. The maintenance workers can be trained beforehand so that quick repairs are possible.
7. CONCLUSIONS
The mathematical modeling and performance optimization of the Digesting system of a paper plant has been carried out in this paper. Genetic Algorithm is hereby proposed to select the various feasible values of the system failure and repair parameters. Then, Genetic Algorithm is successfully applied to coordinate simultaneously these parameters for an optimum level of system performance. Besides, the effect of Genetic Algorithm parameters such as number of generations, population size and crossover probability on the system performance i.e. availability has also been analyzed. Then, the findings of this paper are discussed with the concerned paper plant management. Such results are found highly beneficial for the purpose of performance optimization of the Digesting system in the paper plant concerned.
Crossover Probability
Availability λ9 µ9 λ10 µ10 λ11 µ11 λ12 µ12
0.10 0.9794 0.008 0.2067 0.008 0.20 0.008 0.20 0.007 0.05
0.20 0.985 0.008 0.3104 0.008 0.20 0.008 0.20 0.007 0.05
0.30 0.9869 0.0079 0.2621 0.008 0.2100 0.0079 0.2013 0.006 0.0684 0.40 0.9883 0.008 0.2177 0.0078 0.2016 0.0079 0.2211 0.0069 0.0611 0.50 0.9874 0.008 0.2067 0.008 0.2013 0.008 0.2028 0.007 0.051
0.60 0.9884 0.008 0.20 0.008 0.20 0.008 0.20 0.007 0.05
0.70 0.9893 0.0079 0.2610 0.008 0.2015 0.0078 0.2330 0.0069 0.0580
Nomenclature
The symbols and notations associated with the transition diagram of the Digesting system are given below:
Indicates the system in operating condition.
Indicates the system in breakdown condition
Indicates the system in reduced capacity state.
B1, B2, B3, B4: Represent good working states of respective screw feeder, belt conveyor, shuttle conveyor, digester.
b1, b2, b3, b4 : Represent failed states of respective screw feeder , belt conveyor shuttle conveyor, digester.
λ9, λ10, λ11, λ12: Respective mean constant failure rates of B1, B2, B3, B4.
µ9, µ10, µ11, µ12: Respective mean constant repair rates of b1, b2, b3, b4.
P0(t) : Probability that the system is working at full capacity at time t.
Pi(t): Probability that the system is in the ith state at time t.
P’: First-order derivative of the probabilities.
8. REFERENCES
1. Dhillon, B.S.and Singh, C., Engineering Reliability- New techniques and applications. John willey and sons, New York (1981).
2. Kumar, D., Singh, I.P., and Singh, J, “Reliability analysis of the Feeding System in the Paper Industry”, Microelectron Reliability, Vol. 28(2), (1988), 213-215.
3. Kumar, Dinesh., Singh, Jai., and Pandey, P.C., “Availability analysis of the washing system in the paper industry”, Microelectron Relaibility, Vol. 29, (1989), 775-778.
4. Kumar, Dinesh., Singh, Jai., and Pandey, P.C., “Operational behavior and profit function for a bleaching and screening system in the paper industry”, Microelectron Relaibility, Vol. 33, (1993), 1101-1105.
5. Srinath, L.S., Reliability Engineering, 3rd edition,
East-West Press Pvt. Ltd., New Delhi, India, (1994).
6. Kalyanmoy Deb., Optimization for Engineering Design: Algorithms and examples, Prentice Hall of India, New Delhi, India, (1995).
7. Shooman, M.L,“Reliability computation for Systems with Dependents Failures”, Proceedings of IEEE Annual Symposium on Reliability, (1996), 44-56. 8. Sunand Kumar, Dinesh Kumar and Mehta, N.P.,
“Maintenance Management for Ammonia Synthesis System in a Urea Fertilizer Plant”, International Journal of Management and System (IJOMAS), Vol.15(3), (1999), 211-214.
9. Singh, C.J. and Jain, M., “Reliability of repairable multi-component redundant system”, International Journal of Engineering (IJE), Vol. 13 No. 4, (2000), 17-22.
10. Goldberg, D.E., Genetic Algorithm in Search, Optimization and Machine Learning, Pearson Edition. Asia, (2001).
11. Tsai, Y.T., Wang, K.S. and Teng, H.Y. “Optimizing preventive maintenance for mechanical components using genetic algorithms”, Reliability Engineering and System Safety, Vol. 74, No. 1, (2001), 89-97. 12. Castro H.F. and Cavalca, K., “Availability
optimization with Genetic Algorithm”, International Journal of Quality and Reliab. Management, Vol. 20, No. 7, (2003), 847-863. 13. Chales, C., Kondo, A., “Availability allocation to
repairable systems with genetic algorithms: a multi-objective formulation”, Reliability Engineering and System Safety, Vol. 82, No. 3, (2003), pp. 319-330.
14. Fricks, M.F. and Trivedi, K.S., “Importance analysis with Markov chains,” Proceedings of the 49th
Annual Reliability and Maintainability
Symposium, (2003), 89-95.
15. Tewari, P.C., Kumar, D. and Mehta, N.P., “Decision Support System of Refining System of Sugar Plant”,Journal of Institution of Engineers (India), Vol. 84, (2003), 41-44.
16. Madhu Jain, Rakhee and Sandhya Maheshwari, “Reliability analysis of redundant repairable system with degraded failure”, International Journal of Engineering (IJE),Vol. 17 No. 2, Transactions B: Applications, (2004), 171-182.
17. Kumral, M., “Reliability-based optimization of a mine production system using GA”, Journal of Loss Prevention in the Process Industries, Vol. 18, (2005), 186-189.
18. Tewari, P.C., Joshi, D., M. Sreenivasa Rao. ,“Mathematical Modeling and Behavioural Analysis of a Refining System using Genetic Algorithm”,
Proceedings of National Conference on
Competitive Manufacturing Technology & management for Global Marketing, Chennai, (2005), 131-134.
19. Marseguerra, M., Zio, E. and Martorell, S., “ Basics of Genetic Algorithms (GA)optimization for RAMS applications”, Reliability Engineering and System Safety. Vol. 91, No. 9, (2006), 977-991. 20. Sunand Kumar, Tewari, P.C. and Sharma Rajiv., “Simulated Availability of CO2 Cooling System in a
IJE Transactions A: Basics Vol. 23, Nos. 3 & 4, November 2010 - 225 21. Barabady, J. and Uday Kumar, “Reliability analysis
of mining equipment: a case study of a crushing plant at Jajarm bauxite mine of Iran”, Reliability Engineering & System Safety, Vol. 93, (2008), 643-657.
22. Rajiv Khanduja, Tewari, P.C., Dinesh Kumar., “Development of Performance Evaluation System for Screening Unit of Paper Plant”, International Journal of Applied Engineering Research, Vol. 3, No. 3, (2008), 451-460.
23. Rajiv Khanduja, Tewari, P.C. and Dinesh Kumar., “Availability Analysis of Bleaching System of Paper Plant”, Journal of Industrial Engineering, Udyog Pragati, N.I.T.I.E. Mumbai (India), Vol. 32(1), (2008), 24-29.
24. Sachdeva Anish, Kumar, D., and Kumar Pardeep ,” Reliability analysis of pulping system using Petri nets”, International Journal of Quality and Reliability Management, Vol. 25, No. 8, (2008), 860-877.
25. Ying-Shen Juang, Shui-Shun Lin and Hsing-Pei Kao, “A knowledge management system for series-parallel availability optimization and design”. Journal of Expert system with application Vol. 34, (2008), 181-193.
26. Gupta, S., Tewari, P. C. and Sharma, A. K., “An availability simulation model and performance
analysis of coal handling unit of a typical thermal plant”, South African Journal of Industrial Engineering, Vol. 20, No.1, (2009), 159-171. 27. Michael, S., Mariappan V., Amonkar Uday. J., and
Telang, A.D. , “Availability analysis of transmission system using Markov model”, International Journal of Indian Culture and Business Management, Vol. 2, No. 5, (2009), 551-570.
28. Nakagawa, T. and Mizutani, S., “Optimum problems in backward times of models”, IEEE Transactions on Reliability, Vol. 41, (2009), 65-71.
29. Sanjeev Kumar et al., “Simulation Model for Evaluating the Performance of Urea Decomposition System in a Fertilizer Plant”, International Journal
of Industrial Engineering and Practices
(I.J.I.E.P.), Vol. 1(1), (2009), 10-14.
30. Wang Shuming and Watada Junzo, “Reliability optimization of a series-parallel system with fuzzy random lifetimes”, International Journal of Innovative Computing, Information and Control, Vol. 5, No. 6, (2009), 1547-1558.