METHODOLOGY
MowJoe: a method for automated-high
throughput dissected leaf phenotyping
Henrik Failmezger
1,2†, Janne Lempe
1†, Nasim Khadem
2, Maria Cartolano
1, Miltos Tsiantis
1*and Achim Tresch
1,3*Abstract
Background: Accurate and automated phenotyping of leaf images is necessary for high throughput studies of leaf form like genome-wide association analysis and other forms of quantitative trait locus mapping. Dissected leaves (also referred to as compound) that are subdivided into individual units are an attractive system to study diversification of form. However, there are only few software tools for their automated analysis. Thus, high-throughput image process-ing algorithms are needed that can partition these leaves in their phenotypically relevant units and calculate morpho-logical features based on these units.
Results: We have developed MowJoe, an image processing algorithm that dissects a dissected leaf into leaflets, petiolule, rachis and petioles. It employs image skeletonization to convert leaves into graphs, and thereafter applies algorithms operating on graph structures. This partitioning of a leaf allows the derivation of morphological features such as leaf size, or eccentricity of leaflets. Furthermore, MowJoe automatically places landmarks onto the terminal leaflet that can be used for further leaf shape analysis. It generates specific output files that can directly be imported into downstream shape analysis tools. We applied the algorithm to two accessions of Cardamine hirsuta and show that our features are able to robustly discriminate between these accessions.
Conclusion: MowJoe is a tool for the semi-automated, quantitative high throughput shape analysis of dissected leaf images. It provides the statistical power for the detection of the genetic basis of quantitative morphological variations.
© The Author(s) 2018. This article is distributed under the terms of the Creative Commons Attribution 4.0 International License (http://creativecommons.org/licenses/by/4.0/), which permits unrestricted use, distribution, and reproduction in any medium, provided you give appropriate credit to the original author(s) and the source, provide a link to the Creative Commons license, and indicate if changes were made. The Creative Commons Public Domain Dedication waiver (http://creativecommons.org/ publicdomain/zero/1.0/) applies to the data made available in this article, unless otherwise stated.
Background
Plant leaves are critical for survival as they are the pri-mary site of photosynthesis. Leaf shape and size show tremendous variation between species, which is assumed to be the result of adaptive evolutionary processes tinker-ing with leaf shape to allow best performance in particu-lar ecological niches [12, 14, 20, 23, 36]. Therefore, plant leaves have attracted scientists from diverse disciplines to study ecology, evolution, development and patterning mechanisms [5, 17, 21, 22, 27, 34, 40, 41].
Qualitative descriptions of leaf shape, traditionally used for species classification, are insufficient to characterize the developmental and genetic factors underlying phe-notypic variation. Rather, it is necessary to quantitatively
describe the geometric features of leaf shape and perform shape analysis [6, 26]. Easily accessible measures include length, width, perimeter and area. A more refined mor-phometric analysis, however, is based on the extraction of multivariate shape features. Typically these methods analyse the relative position of landmarks—homologous points identified in each leaf sample—or sequential posi-tions along the leaf outlines or combinaposi-tions of the two. These approaches are collectively referred to as geomet-ric morphometgeomet-rics. Examples of methods based on out-line analysis are Eigenshape analyses and elliptic Fourier analysis [19, 24, 31].
For the identification of loci controlling quantitative traits, phenotypic analysis of larger populations with proper randomization is necessary, for example in quan-titative trait locus (QTL) mapping or genome-wide asso-ciation (GWA) studies. Sizes of mapping populations and availability of genetic information on such largely increased with the advancement of sequencing tech-nologies and phenotyping has become the bottleneck.
Open Access
*Correspondence: [email protected]; [email protected] †Henrik Failmezger and Janne Lempe contributed equally to this work 1 Max Planck Institute for Plant Breeding Research, Carl-von-Linné-Weg 10, 50829 Cologne, Germany
Page 2 of 9 Failmezger et al. Plant Methods (2018) 14:27
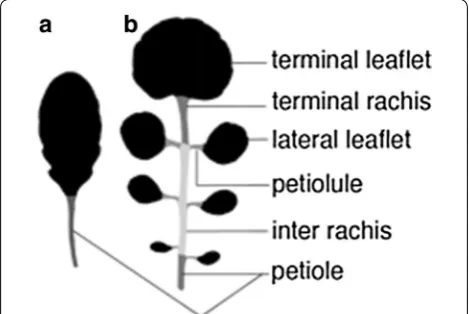
Whereas simple phenotypes can be determined by eye, more complex quantitative phenotypes need to be defined algorithmically. During the last years, sev-eral tools were developed which measure, e.g., leaf size [16, 29], or more complex shape parameters, and shape landmarks [2, 8, 9, 18, 40, 42]. Most of these tools calcu-late features for simple leaves, in which the leaf blade is entire (Fig. 1a), and they are well established for plants like Arabidopsis thaliana. However, dissected leaves, leaves that are divided into several units so called leaflets (Figs. 1b, 2a), move more and more into focus [3, 10, 22], as they allow the investigation of interesting questions on shape evolution, leaf patterning and development.
In order to perform quantitative shape analyses of dis-sected leaves in larger populations, we have developed the MowJoe analysis pipeline. As compared to entire leaves, the shape of dissected leaves is more challeng-ing to image processchalleng-ing algorithms. Instead of report-ing merely morphological features of the entire leaf, one needs to cut the dissected leaf into pre-defined, phenotypically meaningful parts beforehand. A recent approach [11] relies on the assumptions of circular leaf-lets and the symmetric positioning of leafleaf-lets along the rachis to build a leaf shape model. Leaflets are then seg-mented by Active Contours. Another approach searches for concavity points in the leaf and partitions the leaf based on these points [35] or deletes the rachis of the leaves by fitting a polynomial curve [1]. The drawback of these methods is their sensitivity to violations of leaflet convexity. These may occur naturally or through imaging
artifacts like fissures in the leaf produced by its fixation to a plain surface.
Recently, skeletonization of an image was combined with morphological operations in order to measure the length of the branches in rice panicles [13]. Informally, the skeleton is a reduced, one-dimensional representation of a leaf through its “central” points (see Fig. 2c). We use skeletonization to derive marker points on the skeleton of a leaf, which mark, e.g., its leaflets. In contrast to [13], we exploit the fact that skeleton points located within a leaflet have a larger distance to the outline of the leaf than skeleton points lying in the rachis or the petiolule. This allows the fast and reliable determination of the points on the skeleton which separate leaflets from petiolules and rachis. Based on this algorithm, we have developed MowJoe, a software tool that segments dissected leaves into phenotypically meaningful units and calculates mor-phological features for the whole leaf as well as for the individual leaflets, the petiolule, the inter-rachis, the peti-ole and the terminal rachis. Additionally, it determines landmarks and outlines of the terminal leaflet that can directly be used as input files for downstream shape anal-ysis software, such as MorphoJ [25], Eigenshape Analysis [32] and R shapes [15]. We apply MowJoe to two different accessions of the model plant species Cardamine hirsuta
[22] and demonstrate the potential of MowJoe to identify leaf shape variation in dissected leaves.
Results
Image segmentation
Image acquisition and binarization
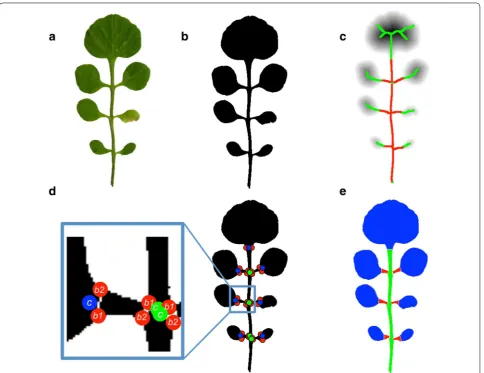
We obtained digitized 2D color images by scanning leaves of the fifth node. In order to improve the process-ing time, the images were rescaled by a factor of 25% using a bicubic interpolation (Fig. 2a).
Foreground pixels were extracted by using a method similar to [28]. The image was converted from RGB to HSV space and a 2-means clustering of the pixels in the saturation-value (SV) space was performed. This initial clustering gave an estimate of the intensity centroids of foreground and background pixels in SV space, which served as an initialization of a 2-multivariate Gauss-ian mixture model on the SV values of the image pixels. The covariance matrices of that model were initialized as scaled identity matrices, the scale chosen as the stand-ard deviation of the whole data set. From the resulting segmentation, the largest connected foreground (green) component was kept (Fig. 2b). The Gaussian mixture method outperformed other common methods such as Otsu thresholding [37] applied to the grey scale or the green component of an image (Additional file 1: Fig. S1). Fig. 1 Leaf architecture of simple leaves (a) and dissected leaves
Graph representation of a leaf
The binarized leaf is converted into a skeleton represen-tation. Skeletonization of a binary image is a standard procedure in image processing [39]. Informally, it cal-culates one-dimensional summary of a 2-dimensional binary image (Fig. 2c). Technically, a distance transform is applied to the image first. This operation assigns to every leaf pixel x the Euclidean distance d(x) to the near-est background pixel. The distance value d(x) can be thought of as the radius of the largest circle centered at x which touches the border of the leaf. Those points whose circle touches the border at least twice are the skeleton pixels (Fig. 2c).
Afterwards, the skeleton is pruned further by remov-ing small branches whose length falls below a threshold
of 25 pixels (corresponding to 4.5 mm. This value can be adjusted arbitrarily in the MowJoe GUI). The skeleton is then converted into a graph with one node for every skeleton pixel and one edge for every pair of neighboring pixels in the skeleton. This graph representation of the skeleton simplifies further processing.
Our next task was to segment the skeleton into rachis, petiolule and leaflet parts. To this end, we define a cut node as skeleton pixels in the petiolule neighboring to a leaflet pixel (blue points in Fig. 2d). Similarly, branch-ing nodes are defined as skeleton pixels on the rachis neighboring to a petiolule pixel (green points in Fig. 2d). Skeleton pixels in the leaflet are likely to have larger dis-tance transform values than skeleton pixels in petiolules or in the rachis. This property is exploited to find the Fig. 2 Leaflet segmentation. The scanned leaf (a) is scaled and converted to a binary image (b). The foreground pixels of the binary image are distance transformed (c). The darker the grey scale of a point, the larger its distance to the outline of the leaf. Skeleton pixels are classified according to their distance transform value (red = small, green = large). d Cut nodes (blue, c) are points on the skeleton that mark the border between leaflet pixels and petiolule pixels. Branching nodes (green, c) are points on the skeleton that mark the border between petiolule pixels and rachis pixels. e
Page 4 of 9 Failmezger et al. Plant Methods (2018) 14:27
cut nodes. The distance values of the skeleton pixels are clustered by 2-Gaussian mixture clustering. This gives a rough segmentation in leaflet pixels L (green points in Fig. 2c, having larger distance values) and petiolule/ rachis pixels R (red points in Fig. 2c, having smaller dis-tance values). Since this separation is not perfect and wrong labeling happens at leaflet nodes that are far from the rachis, we implemented a procedure that removes these errors and gives an optimal separation between leaflet and rachis/petiolule pixels. Note that the labeling of points (leaflet versus petiolule/rachis) should only switch once on a simple path from the rachis bottom towards extremal points in the leaflet (we call nodes in the graph that have only one neighbor extremal; unfor-tunately, the more common term “leaf node” has differ-ent meanings in biology and mathematics). We calculate all paths in the graph starting at the bottom node (end of the rachis) to the extremal leaf nodes. Given such a path, we enumerate the nodes on that path from 1 to N, start-ing with the bottom node. If node k was a cut point, then all points 1,. . .,k should be petiolule/rachis points, and all other points should be leaflet points. The number of
M(k) misclassifications according to our initial 2-Gauss-ian mixture clustering is then
This yields an easy criterion to robustly identify the correct cut point: it is the (first) node k which minimizes
M(k). There might be several paths ending in the same leaflet (e.g., see the terminal leaflet in Fig. 2c), possibly leading to different cut nodes for the same leaflet. How-ever in practice, these cut points always agreed. In case of disagreement, we suggest to use the cut point with the smallest value.
Dissection of leaf components
The cut nodes serve for the identification of individual leaf-lets in the binarized image. To define the boundary of a leaflet, we choose b1, the point on the image boundary at minimum distance to a given cut node c. Next, we define
b2 as the boundary point at minimum distance to c with respect to the constraint d(b1,b2) >d(c,b2), i.e., b2 lies on the “opposite side” of b1 (see Fig. 2d). The line between
b1 and b2 separates one leaflet from the rest of the leaf. This finally results in a separation of the leaf into petiole, rachis, petiolule and leaflets (see Fig. 2e). In order to verify the accuracy of our method, we manually measured the rachis and the petiolule of 5 leaves (Additional file 1: Fig. S2) and compared the results to MowJoe’s results. The mean peti-olule length was 26.3 pixels (4.6 mm) as measured manu-ally. The mean deviation between MowJow and manual measurements of petiolule length was 2.9 pixels (0.5 mm), corresponding to a mean relative deviation of 11%. For the
M(k)= |1,. . .k
∩L| + |k+1,. . .,N ∩R|.
rachis, the mean length was 368.4 pixels (64.8 mm), and the mean deviation was 2.6 pixels (0.46 mm), corresponding to a mean relative deviation of 0.7%. All in all, manual and MowJoe measurements were in good agreement and did not show any systematic differences.
Feature extraction
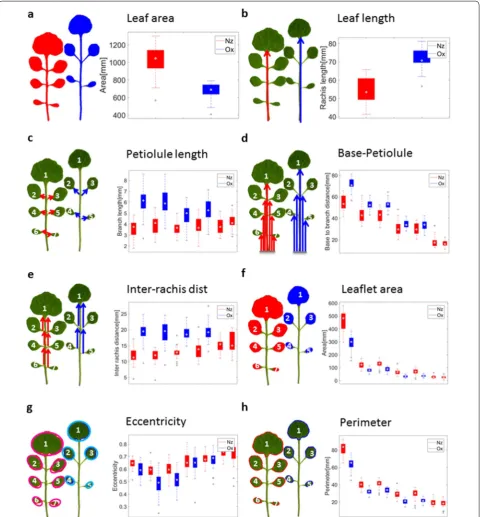
The segmentation of the leaf allows the calculation of global phenotypic features of the whole leaf as well as local fea-tures of the rachis, petiolules and leaflets. Such feafea-tures can potentially discriminate different accessions of C. hirsuta. We compared global and local features of two accessions of
C. hirsuta originating from New Zealand (Nz) and Oxford (Ox). For these accessions a global leaf feature like leaf area already provides a good separation (Fig. 3a; Additional file 1: Fig. S3A). While the Nz accession has a larger whole leaf area, Ox leaves have a longer rachis (Fig. 3b). Further, Ox leaves tend to have at most four leaflets whereas Nz have up to seven leaflets. However, local features offer higher dis-criminatory power and thus boost the discovery of morpho-logically relevant genes in genome-wide association studies. In order to facilitate the comparison of local features, leaf-lets were numbered according to their distance to the ter-minal leaflet and their position (left or right) relative to the rachis. The petiolule length, the number of pixels from leaflet branching node to leaflet cut node, discriminates unequivocally between the leaflets of the Nz and those of the Ox accession (Fig. 3c). Another local feature is the inter-rachis distance, the distance between two neighboring leaf-let crossing points (Fig. 3e). Similar to the petiolule lengths, leaves from the Ox accession tend to have larger inter-rachis distances (Fig. 3e). This is also true for a related measure, the distance from the leaflet base point to the leaflet branching points (Fig. 3d). Other interesting features are leaflet shape parameters derived from individual leaflets (Fig. 3f–h). We calculated several morphometric features that describe the shape of a leaflet: Leaflet area (number of pixels) and leaf-let perimeter, the length of the leafleaf-let major and minor axis, and leaflet eccentricity. Here, leaflet eccentricity models the pixels of a leaflet by an ellipse of similar shape and same size (formally, the ellipse is obtained from the empirical covari-ance matrix generated by the coordinates of the foreground pixels). The deviation from a circular shape is measured by the eccentricity, e=
Morphometric shape analysis
Morphometric shape analysis allows a quantitative description of shape additional to one dimensional size measures. This multivariate analysis makes use of
Page 6 of 9 Failmezger et al. Plant Methods (2018) 14:27
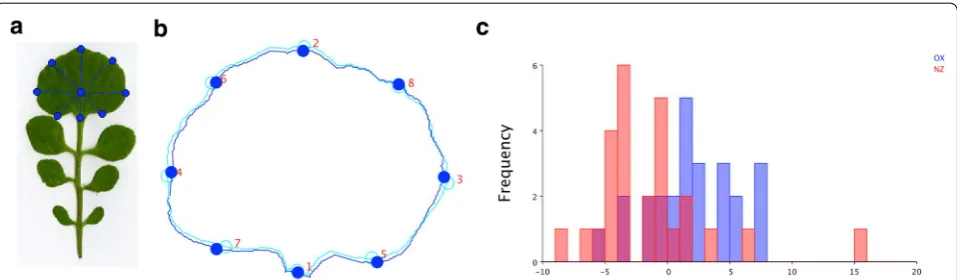
calculated the line from the leaf bottom node to the ter-minal leaf cut node. The intersection of this line with the terminal leaf outline determined the top point.
Two more landmarks were defined by searching for the longest perpendicular line, and by using the intersec-tion point of this line with the terminal leaflet outline. The lines that formed an angle of 45° to these lines deter-mined the rest of the landmarks (Fig. 4a). The landmarks of the terminal leaflets of all leaves that are exported by MowJoe were further analyzed by MorphoJ [25] (Fig. 4b). MorphoJ first performs a Procrustes fit which removes variation in position, orientation and size from the data. We tested the difference in mean shape between these two accessions in MorphoJ using Fisher’s discriminant function analysis (DFA). We observed a significant dif-ference for the terminal leaflet shape (Fig. 4c, P value: 0.0003).
For additional shape analysis, MowJoe generates out-put files that can be imported to Eigenshape analysis [32], or shape analysis implemented in the R package ‘shapes’ [15].
Comparison of combined leaf features
We generated a unified leaf representation for each accession, by an affine mapping of all the leaf’s marker points into one coordinate system. This transformation is defined by mapping the leaf base point (lower rachis end) to the origin of the 2d plane, and mapping the top point of the leaf to (0,1) on the y-axis. The overlay of all leaf images of one accession creates the so-called “metaleaf”, which provides an overview of the morphological variety of that accession (Fig. 5a). On the metaleaf, the differ-ence between the accessions becomes obvious (Fig. 5a). The Ox accession has larger distances between branching nodes and cut nodes but smaller distances between cut nodes and leaflet centers.
In order to define a low-dimensional Euclidean space that satisfactorily captures the morphological variety of entire leaves, we merged whole leaf features, like leaf area and leaf perimeter, with features derived from individual leaflets. We only included features of the first three leaf-lets, as the leaves have different numbers of leaflets and we wanted to keep the feature sets comparable. We then performed principal components analysis for further dimensionality reduction. The leaves of the two C. hir-suta accessions are clearly separated in this morphologi-cal leaf space, indicating that our features extract relevant information (Fig. 5b).
Discussion
Several tools for leaf size and shape measurements have been developed [2, 4, 7, 33, 42]. However, dissected leaves are more complex, they consist of several distinct mor-phological units that need to be identified accurately. We developed an image processing algorithm that is able to extract these units from the entire leaf.
It first identifies the leaf component, extracts its skel-eton and identifies potential cut nodes using the distance transformation, and in the end selects the optimal cut nodes by a loss function. We applied this algorithm to leaves of the plant C. hirsuta, a model organism for dis-sected leaf development that moved into focus due to its leaf shape and its close relationship to A. thaliana [22].
As the processing of a single leaf image takes only a few seconds, our method is applicable in high-throughput appli-cations where a large variety of measurements for thousands of leaves have to be taken. Based on the separation into the phenotypically interesting units we calculate several mor-phological measurements. These measurements include shape parameters of the leaflet, like leaflet area, eccentricity and perimeter. Additionally, our algorithm analyses the local position of a leaflet in the whole leaf, e.g. the distance of the
leaflet from the rachis (petiolule length) or the distance of the leaflet from the terminal leaflet (inter-rachis, terminal rachis length). This is a complete representation of all mor-phological features of a dissected leaf, which are useful for a
Page 8 of 9 Failmezger et al. Plant Methods (2018) 14:27
To test the power of our algorithm we applied it to the two C. hirsuta accessions Nz from New Zealand and Ox originating from Oxford. We show that entire leaf fea-tures as well as feafea-tures for individual leaflets are able to discriminate between the two accessions. Our open-source software is a versatile tool that enables QTL analysis of leaf morphological variation in large mapping populations.
Methods
Plant growth conditions
The two C. hirsuta accessions Ox and Nz were grown under long day conditions in the greenhouse. The leaf of the fifth leaf node was harvested at identical develop-mental state—at flowering when the inflorescence was 15 cm of height. It was digitized with the Epson V700 Photo scanner at 600 dpi.
Image processing and feature detection
Image skeletonization and Gaussian mixture clustering were applied using the particular methods in the Matlab image processing and statistics toolbox. Shape features for the whole leaf and the leaflets were calculated using the standard Matlab methods. In order to calculate the petiolule length, two points at the start and the end of the petiolule were calculated. These points were defined by the cut of the line between opposite border points b1 and
b2 and the skeleton. The petiolule was afterwards deter-mined by counting the number of skeleton pixels (graph nodes) between these points. The rachis length was cal-culated by counting the number of skeleton pixels from the bottom point to the intersection between terminal leaf border points and the skeleton as explained above. The inter-rachis distance was calculated by searching in the graph the nearest branching node with the same orientation in direction of the terminal leaflet. Shape analysis was carried out by MorphoJ [25]. Comparison of different accessions was performed using discriminant factor analysis in MorphoJ. Manual measurements were determined using the software ImageJ [38].
Performance and scalability
A set of 60 images was processed, consisting of 28 images of the Nz accession and 31 images of the Ox accession. The images had a resolution of 600 dpi, resulting in a image size of 4200×1200 pixel. Processing of an average image took in total about 14 s on a MacBook Pro (1.4 GHz Intel Core i5, 4 GB RAM). The segmentation of the whole leaf component of a single image by Gaussian Mixture cluster-ing took about 1.5 s. The identification of crosscluster-ing points and cut points and the segmentation of single leaflets took about 2 s. Calculation of the features and generation of the output plots took the remaining time (about 10 s).
Software and availability
All analysis steps were implemented in Matlab and are combined in the software MowJoe. This software tool provides a rudimental graphical user interface in which a folder with leaf images can be processed. The software tool, as well as the Matlab source code and raw and pro-cessed data were published according to [30] and can be found at https://github.com/Henrik86/Mow_Joe (https:// doi.org/10.5281/zenodo.1181810).
Authors’ contributions
HF, NK and AT developed the MowJoe software and analysed the data. JL and MC performed the experiments. AT and MT initiated the research and designed the experiments. HF, JL, AT, MT wrote the manuscript. All authors read and approved the final manuscript.
Author details
1 Max Planck Institute for Plant Breeding Research, Carl-von-Linné-Weg 10, 50829 Cologne, Germany. 2 Department of Biology, University of Cologne, Zülpicher Str. 47, 50674 Cologne, Germany. 3 Institute of Medical Statistics and Computational Biology, University of Cologne, Bachemer Strasse 86, 50931 Cologne, Germany.
Acknowledgements Not applicable.
Competing interests
The authors declare that they have no competing interests.
Availability of data and materials
The software MowJoe, all sourcecode and the raw andprocessed data is available at https://github.com/Henrik86/Mow_Joe (https://doi.org/10.5281/ zenodo.1181810).
Consent for publication Not applicable.
Ethics approval and consent to participate Not applicable.
Funding Not applicable.
Publisher’s Note
Springer Nature remains neutral with regard to jurisdictional claimsin pub-lished maps and institutional affiliations.
Received: 1 November 2016 Accepted: 13 March 2018
References
1. Arora A, Gupta A, Bagmar N, Mishra S, Bhattacharya A. A plant identifica-tion system using shape and morphological features on segmented leaf-lets: Team IITK, CLEF 2012. In: CLEF 2012 evaluation labs and workshop, Online Working Notes, Rome; 2012.
Additional file
2. Backhaus A, Kuwabara A, Bauch M, Monk N, Sanguinetti G, Fleming A. Leafprocessor: a new leaf phenotyping tool using contour bending energy and shape cluster analysis. New Phytol. 2010;187(1):251–61. 3. Barkoulas M, Hay A, Kougioumoutzi E, Tsiantis M. A developmental
frame-work for dissected leaf formation in the arabidopsis relative Cardamine hirsuta. Nat Genet. 2008;40(9):1136–41.
4. Bensmihen S, Hanna AI, Langlade NB, Micol JL, Bangham A, Coen ES. Mutational spaces for leaf shape and size. HFSP J. 2008;2(2):110–20. 5. Bilsborough GD, Runions A, Barkoulas M, Jenkins HW, Hasson A, Galinha
C, Laufs P, Hay A, Prusinkiewicz P, Tsiantis M. Model for the regulation of Arabidopsis thaliana leaf margin development. Proc Natl Acad Sci USA. 2011;108(8):3424–9.
6. Biot E, Cortizo M, Burguet J, Kiss A, Oughou M, Maugarny-Calès A, Gon-çalves B, Adroher B, Andrey P, Boudaoud A, Laufs P. Multiscale quantifica-tion of morphodynamics: morpholeaf software for 2D shape analysis. Development. 2016;143(18):3417–28.
7. Bylesjö M, Segura V, Soolanayakanahally RY, Rae AM, Trygg J, Gustafsson P, Jansson S, Street NR. Lamina: a tool for rapid quantification of leaf size and shape parameters. BMC Plant Biol. 2008;8:82.
8. Canales C, Barkoulas M, Galinha C, Tsiantis M. Weeds of change: Cardamine hirsuta as a new model system for studying dissected leaf development. J Plant Res. 2010;123(1):25–33.
9. Cao J, Wang B, Brown D. Similarity based leaf image retrieval using multi-scale r-angle description. Inf Sci. 2016;374:51–64.
10. Cartolano M, Pieper B, Lempe J, Tattersall A, Huijser P, Tresch A, Darrah PR, Hay A, Tsiantis M. Heterochrony underpins natural variation in Cardamine hirsuta leaf form. Proc Natl Acad Sci USA. 2015;112(33):10539–44. 11. Cerutti G, Tougne L, Mille J, Vacavant A, Coquin D. A model-based
approach for compound leaves understanding and identification. In: IEEE international conference on image processing; 2013.
12. Chitwood DH, Otoni WC. Divergent leaf shapes among passiflora species arise from a shared juvenile morphology. Plant Direct. 2017;1(5):e00028. 13. Crowell S, Falcao AX, Shah A, Wilson Z, Greenberg AJ, McCouch SR.
High-resolution inflorescence phenotyping using a novel image-analysis pipeline, PANorama. Plant Physiol. 2014;165(2):479–95.
14. Donovan LA, Ludwig F, Rosenthal DM, Rieseberg LH, Dudley SA. Pheno-typic selection on leaf ecophysiological traits in helianthus. New Phytol. 2009;183(3):868–79.
15. Dryden IL. shapes package. R Foundation for Statistical Computing, Vienna, Austria, 2015. Contributed package, Version 1.1-11. 16. Easlon HM, Bloom AJ. Easy leaf area: automated digital image
analy-sis for rapid and accurate measurement of leaf area. Appl Plant Sci. 2014;2(7):1400033.
17. Efroni I, Eshed Y, Lifschitz E. Morphogenesis of simple and compound leaves: a critical review. Plant Cell. 2010;22(4):1019–32.
18. Failmezger H, Jaegle B, Schrader A, Hülskamp M, Tresch A. Semi-auto-mated 3D leaf reconstruction and analysis of trichome patterning from light microscopic images. PLoS Comput Biol. 2013;9(4):e1003029. 19. Ferson S, Rohlf FJ, Koehn RK. Measuring shape variation of
two-dimen-sional outlines. Syst Zool. 1985;34(1):59–68.
20. Givinish TJ. Ecological aspects of plant morphology: leaf form in relation to environment. Theor Plant Morphol. 1978;27:83–142.
21. Hay A, Tsiantis M. The genetic basis for differences in leaf form between Arabidopsis thaliana and its wild relative Cardamine hirsuta. Nat Genet. 2006;38(8):942–7.
22. Hay AS, Pieper B, Cooke E, Mandáková T, Cartolano M, Tattersall AD, Ioio RD, McGowan SJ, Barkoulas M, Galinha C, Rast MI, Hofhuis H, Then C, Plieske J, Ganal M, Mott R, Martinez-Garcia JF, Carine MA, Scotland RW, Gan X, Filatov DA, Lysak MA, Tsiantis M. Cardamine hirsuta: a versatile genetic system for comparative studies. Plant J. 2014;78(1):1–15. 23. Klein LL, Caito M, Chapnick C, Kitchen C, O’Hanlon R. igital
morphomet-rics of two north american grapevines (vitis: Vitaceae) quantifies leaf
variation between species, within species, and among individuals. Front. Plant Sci. 2017;8:373.
24. Klingenberg CP. Evolution and development of shape: integrating quanti-tative approaches. Nat Rev Genet. 2010;11(9):623–35.
25. Klingenberg CP. MorphoJ: an integrated software package for geometric morphometrics. Mol Ecol Resour. 2011;11(2):353–7.
26. Krieger JD. Controlling for curvature in the quantification of leaf form. In: Elewa AMT, editor. Morphometrics for nonmorphometricians, volume 124 of lecture notes in Earth Sciences. Berlin: Springer; 2010. p. 27–71. 27. Kuchen EE, Fox S, de Reuille PB, Kennaway R, Bensmihen S, Avondo J, Calder GM, Southam P, Robinson S, Bangham A, Coen E. Generation of leaf shape through early patterns of growth and tissue polarity. Science. 2012;335(6072):1092–6.
28. Kumar N, Belhumeur PN, Biswas A, Jacobs DW, Kress WJ, Lopez IC, Soares JVB. Leafsnap: a computer vision system for automatic plant species iden-tification. In: Fitzgibbon A, Lazebnik S, Perona P, Sato Y, Schmid C, editors. Computer vision – ECCV 2012. Lecture notes in computer science, vol. 7573. Berlin: Springer; 2012. p. 502–16.
29. Liu N, Kan J. Improved deep belief networks and multi-feature fusion for leaf identification. Neurocomputing. 2016;216:460–7.
30. Lobet G. Image analysis in plant sciences: publish then perish. Trends Plant Sci. 2017;22(7):559–66.
31. Lohmann GP. Eigenshape analysis of microfossils: a general morphomet-ric procedure for describing changes in shape. J Int Assoc Math Geol. 1983;15(6):659–72.
32. MacLeod N. Generalizing and extending the eigenshape method of shape space visualization and analysis. Paleobiology. 1999;25(1):107–38. 33. Maloof JN, Nozue K, Mumbach MR, Palmer CM. LeafJ: an ImageJ plugin for semi-automated leaf shape measurement. J Vis Exp. 2013;71:e50028. 34. Monteiro LR, Nogueira MR. Adaptive radiations, ecological specialization,
and the evolutionary integration of complex morphological structures. Evolution. 2010;64(3):724–44.
35. Mzoughi O, Yahiaoui I, Boujemaa N, Zagrouba E. Multiple leaflets-based identification approach for compound leaf species. In: Vrochidis S, Karat-zas KD, Karppinen A, Joly A, editors. Proceedings of the 1st international workshop on environmental multimedia retrieval co-located with ACM international conference on multimedia retrieval, EMR@ICMR 2014, Glas-gow, volume 1222 of CEUR Workshop Proceedings. CEUR-WS.org, 2014. p. 53–60
36. Nicotra AB, Leigh A, Boyce CK, Jones CS, Niklas KJ, Royer DL, Tsukaya H. The evolution and functional significance of leaf shape in the angio-sperms. Funct Plant Biol. 2011;38(7):535–52.
37. Otsu N. A threshold selection method from gray-level histograms. Auto-matica. 1975;11(285–296):23–7.
38. Rueden CT, Schindelin J, Hiner MC, DeZonia BE, Walter AE, Arena ET, Eliceiri KW. ImageJ 2: ImageJ for the next generation of scientific image data. BMC Bioinform. 2017;18(1):529.
39. Saeed K, Tabedzki M, Rybnik M, Adamski M. K3m: a universal algorithm for image skeletonization and a review of thinning techniques. Int J Appl Math Comput Sci. 2010;20(2):317–35.
40. Scharr H, Minervini M, French AP, Klukas C, Kramer DM, Liu X, Luengo I, Pape J-M, Polder G, Vukadinovic D, Yin X, Tsaftaris SA. Leaf seg-mentation in plant phenotyping: a collation study. Mach Vis Appl. 2016;27(4):585–606.
41. Vlad D, Kierzkowski D, Rast MI, Vuolo F, Ioio RD, Galinha C, Gan X, Hajheidari M, Hay A, Smith RS, Huijser P, Bailey CD, Tsiantis M. Leaf shape evolution through duplication, regulatory diversification, and loss of a homeobox gene. Science. 2014;343(6172):780–3.