S O F T W A R E
Open Access
Development of an interactive web-based
tool to conduct and interrogate
meta-analysis of diagnostic test
accuracy studies: MetaDTA
Suzanne C. Freeman
1,2*, Clareece R. Kerby
2, Amit Patel
2, Nicola J. Cooper
1,2, Terry Quinn
1,3,4and Alex J. Sutton
1,2Abstract
Background:Recommended statistical methods for meta-analysis of diagnostic test accuracy studies require relatively complex bivariate statistical models which can be a barrier for non-statisticians. A further barrier exists in the software options available for fitting such models. Software accessible to non-statisticians, such as RevMan, does not support the fitting of bivariate models thus users must seek statistical support to use R, Stata or SAS. Recent advances in web technologies make analysis tool creation much simpler than previously. As well as accessibility, online tools can allow tailored interactivity not found in other packages allowing multiple perspectives of data to be displayed and information to be tailored to the user’s preference from a simple interface. We set out to: (i) Develop a freely available web-based“point and click”interactive tool which allows users to input their DTA study data and conduct meta-analyses for DTA reviews, including sensitivity analyses. (ii) Illustrate the features and benefits of the interactive application using an existing DTA meta-analysis for detecting dementia.
Methods:To create our online freely available interactive application we used the existing R packages lme4 and Shiny to analyse the data and create an interactive user interface respectively.
Results:MetaDTA, an interactive online application was created for conducting meta-analysis of DTA studies. The user interface was designed to be easy to navigate having different tabs for different functions. Features include the ability for users to enter their own data, customise plots, incorporate quality assessment results and quickly conduct sensitivity analyses. All plots produced can be exported as either .png or .pdf files to be included in report
documents. All tables can be exported as .csv files.
Conclusions:MetaDTA, is a freely available interactive online application which meta-analyses DTA studies, plots the summary ROC curve, incorporates quality assessment results and allows for sensitivity analyses to be conducted in a timely manner. Due to the rich feature-set and user-friendliness of the software it should appeal to a wide audience including those without specialist statistical knowledge. We encourage others to create similar applications for specialist analysis methods to encourage broader uptake which in-turn could improve research quality.
Keywords:Diagnostic test accuracy, Meta-analysis, Application
© The Author(s). 2019Open AccessThis article is distributed under the terms of the Creative Commons Attribution 4.0 International License (http://creativecommons.org/licenses/by/4.0/), which permits unrestricted use, distribution, and reproduction in any medium, provided you give appropriate credit to the original author(s) and the source, provide a link to the Creative Commons license, and indicate if changes were made. The Creative Commons Public Domain Dedication waiver (http://creativecommons.org/publicdomain/zero/1.0/) applies to the data made available in this article, unless otherwise stated. * Correspondence:[email protected]
1
NIHR Complex Reviews Support Unit, University of Leicester & University of Glasgow, Glasgow, UK
2Biostatistics Research Group, Department of Health Sciences, University of
Leicester, Leicester LE1 7RH, UK
Background
Background to meta-analysis of diagnostic test accuracy studies
Diagnostic tests are routinely used in healthcare settings for confirming or excluding diagnoses. They generally comprise of a measure which splits individuals into healthy or diseased. Diagnostic tests in primary care can generally be done on any patient and are normally quick and painless. In hospital settings, diagnostic tests can be more invasive and expensive, and are often only carried out on specific populations of individuals where the tests may be necessary to determine treatment pathways [1]. Diagnostic tests have been around for a long time. However, as our understanding of biology and disease has increased, along with advances in technology, many new diagnostic tests have emerged and there is now a plethora of diagnostic tests available [1]. For example, with some conditions, such as cancer, studies aim to identify a new diagnostic test that is still as accurate as the standard test, yet less costly or invasive. Diagnostic tests are rarely 100% accurate so rigorous testing is re-quired [1]. There can be many aspects to evaluating a diagnostic test including ability to measure the desired parameter, cost-effectiveness and accuracy. In this paper we focus on assessing the accuracy of diagnostic tests.
To assess accuracy, a diagnostic test is compared to the“gold standard”test which is assumed to provide the true diagnosis of individuals. The value used to split the population into healthy or diseased is known as the threshold or cut-off value. The results of a diagnostic test are often reported in a 2 × 2 table, as in Table1. The true positive (TP) rate is the number of patients cor-rectly identified as having the disease by the diagnostic test. The true negative (TN) rate is the number of pa-tients correctly identified as not having the disease by the diagnostic test. The false positive (FP) rate is the number of patients who do not have the disease but have a positive test result. The false negative (FN) rate is the number of patients who have the disease but have a negative test result. There are two parameters which are often used to assess the accuracy of diagnostic tests; sen-sitivity and specificity. Sensen-sitivity is the ability of the diagnostic test to correctly identify patients with the dis-ease amongst patients who have the disdis-ease (i.e. TP/TP + FN). Specificity is the ability of the diagnostic test to correctly identify the healthy individuals amongst patients who do not have the disease (i.e. TN/FP + TN).
A meta-analysis (MA) of diagnostic test accuracy (DTA) studies synthesises both sensitivity and specificity from multiple studies to evaluate the performance of a diagnostic test. DTA MA should take into account the correlation between sensitivity and specificity and is often performed using either the bivariate or hierarchical summary receiver operating characteristic (HSROC) models, and the results presented either around a mean accuracy point or as a summary receiver operating char-acteristic (SROC) curve [2–4]. The SROC curve plots sensitivity on the y-axis against 1-specificity on the x-axis illustrating how sensitivity and specificity vary for different thresholds of a test.
Static versus interactive graphs
Conventionally, SROC curves are published as static graphs. Static graphs can be limiting as they must display all of their elements on the same surface at the same time. Otherwise, to represent all the dimensions of the data and illustrate the necessary perspectives, mul-tiple static graphs must be produced [5]. An alternative to static graphs is to consider interactive graphs. Inter-activity allows multiple perspectives of the data to be seen and can be made up of layers, allowing one space to be used for describing multiple types of analyses where each layer is only visible when the user selects it [6]. Importantly, interactivity allows users to explore the data themselves and can provide a useful tool to aid sensitivity analyses. A trade-off exists between static and interactive graphs between the time it takes to generate the new image and the space needed to present the many static graphs necessary to illustrate the same point [6].
Why is an interactive online application needed?
Cochrane publish a number of diagnostic test accuracy reviews each year. A search of the Cochrane Database of Systematic Reviews on the 7th September 2018 identi-fied 99 reviews of type ‘diagnostic’ published between October 2009 and August 2018. However, the Cochrane software RevMan [7] uses the Moses-Littenburg method [8, 9] for DTA MA which does not properly take into account random effects and the correlation between sen-sitivity and specificity [10]. Therefore, using bivariate or HSROC models is more appropriate for MA of DTA studies [2]. To properly conduct DTA MA in RevMan other programs such as Stata, SAS, R or WinBUGS are needed to conduct the statistical analysis and then the HSROC parameters are ‘fed back’ into RevMan to pro-duce SROC plots. Furthermore, feedback from Cochrane review teams highlighted frustrations with the complex-ity of existing DTA MA software approaches. We set out to develop an interactive application which could be used by both researchers familiar with the DTA MA Table 1Illustration of a 2 × 2 table of diagnostic test results
Gold standard
Positive Negative
Index test Positive True Positives (TP) False Positives (FP)
process, but who don’t necessarily have the statistical expertise to use specialist software such as Stata or R, and statisticians, to allow a comprehensive analysis of their data and publication quality figures to be con-ducted in a single package.
Sensitivity analysis is an essential part of any statistical analysis. It allows examination of both data and assump-tions. In MA sensitivity analysis is often conducted excluding any particularly large or extreme studies, or studies deemed to be of low quality to assess the robust-ness of the parameter estimates from the primary analysis. In software such as RevMan excluding one trial involves running a new analysis. We set out to encour-age sensitivity analyses within the application by allow-ing trials to be excluded in an easy interactive manner.
A 2008 review investigating how diagnostic informa-tion was graphically presented concluded that often multiple graphs are needed to in order to provide both a detailed overview of the results and to communicate the information needed to inform clinical practice [11]. Fur-thermore, effective interactive tools need to have appro-priate statistical functioning, alongside high quality graphics to provide a pleasant experience for the user [12]. We considered graphical design alongside statistical analysis to develop a user-friendly intuitive application allowing users to explore their data, conduct sensitivity analyses and assess the impact of assumptions on the parameter estimates.
Objectives
We set out to develop a freely available web-based “point and click” interactive online application which allows users to input their own data and conduct meta-analyses of diagnostic test accuracy study data including sensitivity analyses. We illustrate the benefits of the interactive application using an existing DTA MA on assessing protein in cerebrospinal fluid to identify pa-tients with mild cognitive impairment who would develop dementia.
Implementation
We built MetaDTA, an interactive application to facilitate analysis and aid understanding for researchers, clinicians and students, focusing on the SROC plot.
Software
To create our online freely available interactive applica-tion we used the statistical software R [13] and the existing packages Shiny [14] and lme4 [15]. Shiny is a package that allows R users to create web applications with interactive user interfaces without prior knowledge
of web development languages such as HTML,
JavaScript and CSS [14]. lme4 is a package that fits generalised linear mixed effect models [15]. MetaDTA is
hosted on the shinyapps server which makes it available to any user with a web browser, without requiring any specialist statistical software. The application is available athttps://crsu.shinyapps.io/dta_ma/.
Statistical analysis
The random effects bivariate binomial model of Chu & Cole [4] is fitted as a generalised linear mixed effect model using the glmer function from the package lme4 [15, 16]. Sensitivity and specificity are jointly modelled and the estimates from each study are assumed to vary but come from a common underlying distribution with an unstructured between-study covariance matrix [16].
The bivariate model has been shown to be mathemat-ically identical to the HSROC model [17]. Therefore the HSROC parameters are estimated using the bivariate model parameters and the equivalence equations of Harbord et al. [17]. The SROC plot is drawn using the resulting HSROC parameters. Positive and negative like-lihood ratios and the diagnostic odds ratio are calculated directly from the estimates of logit sensitivity and logit specificity. The R package msm is used to implement the delta method to calculate the standard errors of the likelihood ratios and diagnostic odds ratio to allow calculation of the confidence intervals [18].
Data on the quality of the primary diagnostic accuracy studies, evaluated using the QUADAS-2 tool [19], can be incorporated within SROC plots in MetaDTA. The QUADAS-2 tool consists of four domains i) patient se-lection, ii) index test, iii) reference standard, and iv) flow of patients through the study and timing of the index test(s) and reference standard. All domains are assessed in terms of risk of bias, and domains i) to iii) in terms of concerns regarding applicability to the review question [19].
User Interface
The user interface was designed to be user-friendly and intuitive and follows the process of conducting an ana-lysis: Load Data, Meta-Analysis and Sensitivity Analysis. All pages have been constructed with a sidebar on the left displaying the options available for the user to select. A fourth page, References, includes some of the key ref-erences for the statistical methods and default datasets used within MetaDTA.
Fig. 1Data for Analysis tab on the Load Data page. Data displayed is from the inbuilt dataset on assessing dementia
accessed by selecting ‘Yes’to the question‘Use a dataset with quality assessment data?’under the‘Default dataset options’on the sidebar. Default datasets are overwritten when users choose to upload their own dataset. The tab ‘Data for Analysis’ will always display the dataset being analysed (Fig.1).
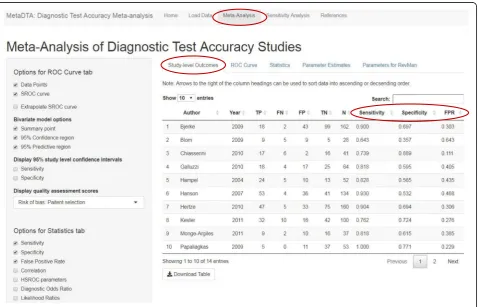
The Meta-Analysis page consists of five tabs: Study-level Outcomes, ROC curve, Statistics, Parameter Estimates and Parameters for RevMan. The ‘Study-level Outcomes’tab presents estimates of the sensitivity, spe-cificity and false-positive rate for each trial (Fig. 2). Throughout MetaDTA all tables can be downloaded as .csv files and all figures can be downloaded as either .png or .pdf files.
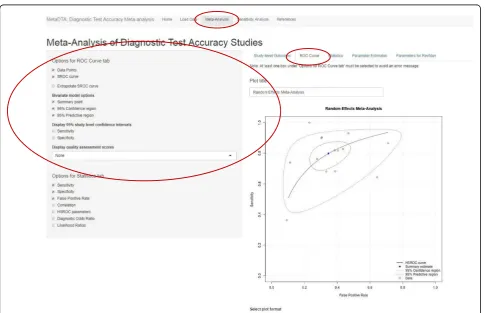
On the ‘ROC curve’ tab users are able to choose whether to display the data point from each trial, the SROC curve, summary point, 95% confidence region, 95% predictive region and 95% confidence intervals for sensitivity and specificity of each data point. When SROC curve is selected users may also choose to ex-trapolate the SROC curve. Users are able to specify their own title for the plot. Additional functionality includes
displaying the sensitivity and false-positive rate below the graph for the appropriate study when a data point is clicked on. For datasets in the thirteen column format an additional drop down menu contains the individual domains from the QUADAS-2 tool. When a domain is selected the data points on the ROC plot are coloured dependent on their quality assessment score: green for low risk of bias/applicability, red for high risk of bias/ap-plicability and grey for unclear (Fig. 3). Choosing one of two further options in the drop down menu,‘Risk of bias (all)’ or ‘Applicability concerns (all)’, will display pie charts on the ROC plot summarising all domains of QUADAS-2 concerning either risk of bias or applicabil-ity respectively. In addition, when either of these options is chosen and the user clicks on the middle of the pie chart for a particular study a larger version of the pie chart is displayed below the ROC plot.
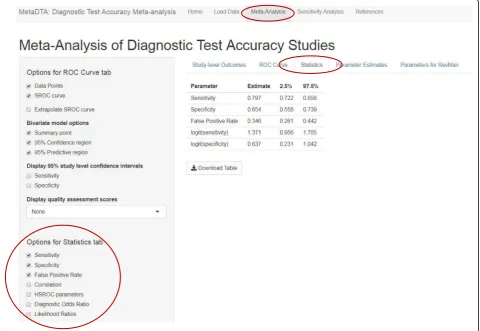
The ‘Statistics’ tab tabulates point estimates and 95% confidence intervals for the statistics selected by the user from the list in the sidebar on the left (Fig.4). The‘ Par-ameter Estimates’ tab provides the bivariate normal dis-tribution for mean sensitivity and specificity on the logit
scale which may be useful for further modelling such as the inclusion of test accuracy in a decision modelling framework (Fig. 5). The ‘Parameters for RevMan’ tab provides the parameter values required by RevMan to allow construction of plots in the ROC space for users who wish to include the analysis results as part of a Cochrane review (Fig.6).
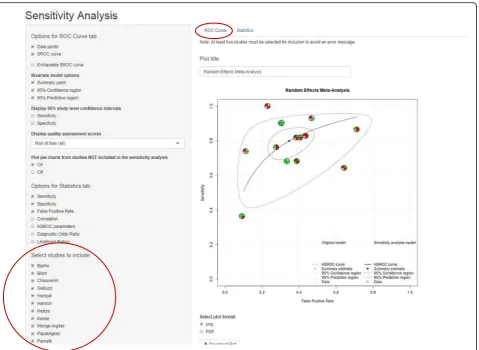
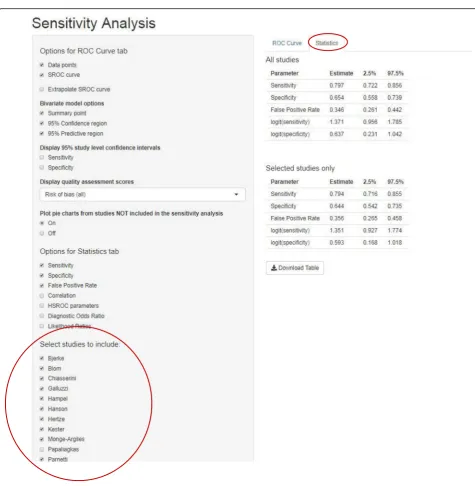
The Sensitivity Analysis page is similar in format to the Meta-Analysis page, with an additional option in the sidebar on the left which allows users to select which studies they would like to include in their sensi-tivity analysis. The‘ROC curve’tab displays in grey esti-mates from studies included in the main analysis but excluded from the sensitivity analysis. The overall pooled estimate from the main analysis is also displayed in grey. Estimates from the studies included in the sensitivity analysis are displayed in black with the overall pooled estimate from these studies in blue. For datasets in the thirteen column format, if selected as an option, pie charts summarising risk of bias or applicability concerns are displayed in grey for studies excluded from the
sensitivity analysis (Fig. 7). The ‘Statistics’ tab displays two tables: estimates from the sensitivity analysis and es-timates from the analysis of all trials (Fig.8).
Results
Illustrative example using dementia data
The dataset used to illustrate MetaDTA is taken from a meta-analysis assessing protein in cerebrospinal fluid to identify patients with mild cognitive impairment who would develop Alzheimer’s disease dementia or other forms of dementia [21]. The dataset consists of fourteen studies. Figure2shows the estimates of sensitivity, speci-ficity and false-positive rate from each trial.
Across the fourteen studies the pooled estimate of sen-sitivity was 79.7% (95% confidence interval (CI): 72.2, 85.6%) and the pooled estimate of specificity was 65.4% (95% CI: 55.8, 73.9%) (Figs.3&4). From Fig.2it can be seen that the Papaliagkas study has zero false negative observations giving a sensitivity equal to 1. We chose to conduct a sensitivity analysis to determine how influ-ential this perfect sensitivity is on the mean estimates.
Removing the Papaliagkas study had little effect on the pooled estimates of sensitivity and specificity. The pooled estimate of sensitivity reduced slightly to 79.4% (95% CI: 71.6, 85.5%) whilst the false positive rate reduced slightly to 64.4% (95% CI, 54.2, 73.5%) (Figs. 7 & 8).
Decision making context
In England and Wales, the National Institute for Health and Care Excellence (NICE) are responsible for determining which treatments are available on the NHS. Evidence synthesis feeds into economic evaluations which inform clinical decision-making by NICE. Bujkiewicz et al. demonstrated the feasi-bility and usefulness of interactive applications during a NICE Technology Appraisal meeting [22]. They developed an interactive Excel application,
Transparent Interactive Decision Interrogator
(TIDI), to allow for real-time sensitivity analyses which was used during a NICE Technology Ap-praisal meeting [22]. An Excel-based interface was constructed including graphical controls which allowed a range of assumptions to be explored.
Statistical analyses were conducted ‘behind the
scene’ using R and WinBUGS. Whilst the
Excel-based interface provided a familiar
user-interface, the application required the installa-tion of both R and WinBUGS on the computer be-ing used. Furthermore, the application required statistical expertise as re-programming was needed for each new dataset. However, a survey of com-mittee members following the meeting found that the application was viewed in a positive manner providing support to decision makers by allowing a range of scenarios and assumptions to be explored in real time and speeding up the decision making process [22].
An advantage of MetaDTA is that, unlike TIDI, it does not require knowledge of any specialist statistical software packages such as Stata, R or WinBUGS to use. Furthermore, MetaDTA has the potential to be developed further to aid in the de-cision making process. MetaDTA already provides the estimated parameters of the bivariate normal distribution required for probabilistic sampling for
stochastic decision modelling based on the
correlated mean estimates of accuracy from the meta-analysis.
Further work could include the development of an interface between MetaDTA and associated economic decision models which could be used within meetings to conduct real-time sensitivity analyses on a range of scenarios and assumptions. Countries across the world are using and/or developing their own formal decision making processes (e.g. Canada, Australia, Brazil). There-fore, the need for an online application to conduct real-time analyses will continue to increase as the number of countries adopting formal decision making processes increases. Creating and sharing online re-sources such as this app, which can be used worldwide with just an internet browser, may minimise duplication and effort across countries.
Discussion
We created MetaDTA, an online interactive‘ point-and--click’ application for meta-analysis of DTA studies. MetaDTA allows users to upload their own data, ana-lyses the data and presents the results in downloadable formats. We developed a user-friendly intuitive user interface which allows users to explore their data and the analysis. The application uses the statistically
rigorous bivariate model to analyse the data and much of the data and results can be presented graphically via an interactive SROC plot. There are many options avail-able allowing users to customise the graphs to suit their needs including the option to incorporate quality assess-ment results from the QUADAS-2 tool. In addition, all statistical parameter estimates are presented in tables with uncertainty. All tables and figures can be down-loaded from the application. Furthermore, we encourage the use of sensitivity analyses by allowing users the option to remove trials from the analysis.
We believe that sensitivity analysis is the key to ensur-ing that an analysis is robust. However, some published meta-analyses of DTA studies may hypothesise about how their results could be affected by certain studies but don’t always conduct sensitivity analyses. Sensitivity analyses can be time-consuming and may involve ‘going back to the start’ and creating a new dataset excluding influential studies and running the analysis again. MetaDTA avoids this allowing users to remove a study through one click of a button and presenting the results alongside the original analysis so that the impact of re-moving a study can be seen visually in both figures and Tables. A key element of sensitivity analyses is to assess the impact of study quality on the DTA MA results.
MetaDTA allows the results of quality assessment from the QUADAS-2 tool to be included in the uploaded data file. An assessment of how the DTA MA results change when low quality studies are excluded can then be easily conducted by removing the low quality studies with re-sults displayed visually in both figures and tables. We believe that MetaDTA which allows customisable and statistically informative graphics could improve the con-duct of sensitivity analyses.
MetaDTA was developed by statisticians at the UK National Institute of Health Research Complex Reviews Support Unit (CRSU) with direct input from end-users. MetaDTA was first presented at a CRSU workshop in April 2018. Feedback from the meeting was positive and requests for additional functionality, such as estimates for the HSROC model, were incorporated into the appli-cation. We are aware of several other standalone R pack-ages which can be used to conduct the statistical analyses required to meta-analyse DTA studies [16]. However, we are only aware of one R package which
both fits a bivariate model to synthesise DTA studies and provides a user interface [23]. The package meta4diag fits a Bayesian bivariate normal model and provides an interactive graphical interface so that the full functionality of the package can be accessed without requiring any R programming. However, meta4diag requires users to have R installed on their device and the results are presented as R output requiring the user to have some R knowledge. We believe MetaDTA has advantages over meta4diag as the only software needed is an internet browser and that the direct input from end-users has resulted in an applica-tion that is truly user-friendly for both statisticians and non-statisticians. As with all forms of statistical analysis, we encourage users unfamiliar with the statistical method-ology to seek statistical support to ensure correct inter-pretation of the results.
Building on the concept of explorable explanations first proposed by Bret Victor in 2011 [24] a further advantage of this application is the potential to encapsulate a specific data-set within the application. For example, as part of the online
supplementary material for a journal paper a link could be placed which when followed takes the user to a version of this application which contains the data reported in the jour-nal paper. Explorable explanations enable and encourage the reader to become an active participant in the learning process allowing text to be used as an environment to think in [25]. In this case, the user would be able to explore the dataset themselves, repeat the analyses re-ported in the paper, assess the impact of modelling assumptions and conduct their own sensitivity ana-lyses scrutinising any concerns they may have.
Conclusion
We built a freely available interactive online application which meta-analyses DTA studies, produces the SROC plot, incorporates quality assessment results and allows for sensitivity analyses to be conducted in a timely man-ner. MetaDTA will allow a wide range of users to carry out specialised analyses without needing software beyond an internet browser. We encourage others to create similar applications for specialist analysis methods to encourage broader uptake which in-turn could im-prove research quality.
Availability and requirements
Project name: MetaDTA (Diagnostic Test Accuracy
Meta-Analysis).
Project home page:https://crsu.shinyapps.io/dta_ma/
Operating system(s):Platform independent.
Programming language:R.
Other requirements:Internet browser.
License:Not applicable.
Any restrictions to use by non-academics:None.
Acknowledgements
We would like to thank Rhiannon Owen, Yiqiao Xin, Yemisi Takwoingi and Christopher Partlett. We would like to thank the participants from the CRSU & Cochrane workshop (26th April 2018) for testing the application and their feedback and the Methods in Meta-Analysis meeting attendees (19th June 2018) for their feedback.
Funding
The Complex Reviews Support Unit is funded by the National Institute for Health Research (project number 14/178/29). AP is funded by a National Institute for Health Research Systematic Review Fellowship. The views and opinions expressed herein are those of the authors and do not necessarily reflect those of the NIHR, NHS or the Department of Health. The NIHR had no role in the design of the study and collection, analysis, and interpretation of data and in writing the manuscript.
Availability of data and materials
The datasets on unhealthy alcohol use and dementia are available to download from MetaDTA. The R code for MetaDTA is available from the corresponding author on reasonable request. The application can be accessed fromhttps://crsu.shinyapps.io/dta_ma/.
Authors’contributions
AS, NC and TQ conceived the project. SF, CK and AP created the interactive online application. All authors contributed to the design of the application. SF drafted the manuscript which was revised by all authors. All authors read and approved the final manuscript. All authors take responsibility for the accuracy and integrity of the work.
Ethics approval and consent to participate Not applicable.
Consent for publication Not applicable.
Competing interests
The authors declare that they have no competing interests.
Publisher’s Note
Springer Nature remains neutral with regard to jurisdictional claims in published maps and institutional affiliations.
Author details 1
NIHR Complex Reviews Support Unit, University of Leicester & University of Glasgow, Glasgow, UK.2Biostatistics Research Group, Department of Health
Sciences, University of Leicester, Leicester LE1 7RH, UK.3Institute of
Cardiovascular and Medical Sciences, University of Glasgow, Glasgow G12 8QQ, UK.4Cochrane Dementia and Cognitive Improvement Group, Oxford, UK.
Received: 8 November 2018 Accepted: 31 March 2019
References
1. Thompson M, Van den Bruel A. Diagnostic Tests Toolkit. Heneghan C, Perera R, Badenoch D, editors. Chichester, West Sussex, UK: Wiley-Blackwell; 2011.
2. Reitsma JB, Glas AS, Rutjes AW, Scholten RJ, Bossuyt PM, Zwinderman AH. Bivariate analysis of sensitivity and specificity produces informative summary measures in diagnostic reviews. J Clin Epidemiol. 2005;58(10):982–90. 3. Rutter CM, Gatsonis CA. A hierarchical regression approach to meta-analysis
of diagnostic test accuracy evaluations. Stat Med. 2001;20(19):2865–84. 4. Chu H, Cole SR. Bivariate meta-analysis of sensitivity and specificity with
sparse data: a generalized linear mixed model approach. J Clin Epidemiol. 2006;59(12):1331–2 author reply 2-3.
5. Murray S. In: Blanchette M, Demarest R, editors. Interactive data visualization for the web. Sebastopol: California: O'Reilly Media; 2013.
6. Yi J, Kang Y, Stasko J, Jacko J. Toward a deeper understanding of the role of interaction in information visualization. IEEE Trans Vis Comput Graph. 2007;13(6):1224–31.
7. Barrett JK, Farewell VT, Siannis F, Tierney J, Higgins J. Two-stage meta-analysis of time-to-event data from individual participants using percentile ratios. Stat Med. 2012;26:3681–99.
8. Littenberg B, Moses L. Estimating diagnostic accuracy from multiple conflicting reports: a new meta-analytic method. Med Decis Mak. 1993;13:313–21.
9. Moses L, Shapiro D, Littenberg B. Combining independent studies of a diagnostic test into a summary ROC curve: data-analytic approaches and some additional considerations. Stat Med. 1993;12:1293–316.
10. Macaskill P, Gastonis C, Deeks JJ, Harbord R, Takwoingi Y. Chapter 10: Analysing and presenting results. In: Deeks JJ, Bossuyt P, Gastonis C, editors. Cochrane handbook for systematic reviews of diagnostic test accuracy version 1. The Cochrane collaboration. Available from:http://srdta.cochrane.org/; 2010. 11. Whiting PF, Sterne JA, Westwood ME, Bachmann LM, Harbord R, Egger M,
et al. Graphical presentation of diagnostic information. BMC Med Res Methodol. 2008;8:20.
12. Gelman A, Unwin A. Infovis and statistical graphics: different goals, different looks. J Comput Graph Stat. 2013;22(1):2–28.
13. R Core Team. R: A language and environment for statistical computing: R Foundation for Statistical Computing, Vienna, Austria.https://www.R-project. org/;2017.
14. Chang W, Cheng J, Allaire J, Xie Y, McPherson J. Shiny: web application framework for R. R package version 1.0.5.https://CRAN.R-project.org/ package=shiny. 2017.
15. Bates D, Maechler M, Bolker B, Walker S, Haubo Bojesen Christensen R, Singmann H, et al. lme4: Linear Mixed-Effects Models using 'Eigen' and S4. R package version 1.1-18-1.https://CRAN.R-project.org/package=lme4. 2018. 16. Partlett C, Takwoingi Y. Meta analysis of test accuracy studies in R: a
summary of user-written programs and step-by-step guide to using glmer. Version 1.0 august 2016. Available from: https://methods.cochrane.org/sdt/ software-meta-analysis-dta-studies. 2016.
17. Harbord RM, Deeks JJ, Egger M, Whiting P, Sterne JA. A unification of models for meta-analysis of diagnostic accuracy studies. Biostatistics. 2007;8(2):239–51.
18. Jackson C. msm: Multi-state Markov and hidden Markov models in continuous time. R package version 1.6.6.https://CRAN.R-project.org/ package=msm. 2018.
19. Whiting P, Rutjes A, Westwood M, Mallett S, Deeks JJ, Reitsma JB, et al. QUADAS-2: a revised tool for the quality assessment of diagnostic accuracy studies. Ann Intern Med. 2011;155:529–36.
20. Kriston L, Hölzel L, Weiser A, Berner M, Härter M. Meta-analysis: are 3 questions enough to detect unhealthy alcohol use? Ann Intern Med. 2008;149:879–88.
21. Ritchie C, Smailagic N, Noel-Storr AH, Takwoingi Y, Flicker L, Mason SE, et al. Plasma and cerebrospinal fluid amyloid beta for the diagnosis of Alzheimer's disease dementia and other dementias in people with mild cognitive impairment (MCI). Cochrane Database Syst Rev.
(2014, 6):CD008782.
22. Bujkiewicz S, Jones HE, Lai MC, Cooper NJ, Hawkins N, Squires H, et al. Development of a transparent interactive decision interrogator to facilitate the decision-making process in health care. Value Health. 2011;14(5):768–76. 23. Guo J, Riebler A. meta4diag: Bayesian bivariate meta-analysis of diagnostic
test studies for routine practice. J Stat Softw. 2018;83(1):1–31.
24. Victor B. Explorable Explanations. Available from:http://worrydream.com/ ExplorableExplanations/, Accessed 11th May 2018.