Commercial Building Energy Benchmarking
and Disclosure Policies in the United States
Rebecca Ruff
Willamette University, Philosophy Department, 900 State St, Salem, OR 97301 Corresponding author: [email protected]
Keywords: Energy Policy; United States; Benchmarking; Disclosure; Buildings.
Executive Summary: Benchmarking is the process of measuring a building’s energy use over time and comparing it to that of similar buildings. Benchmarking is useful because often the only information building owners and operators have about their building’s energy use is their energy bills, which typically only include a building’s monthly energy cost and energy use intensity (EUI). By benchmarking, building owners and operators can determine if they are performing well compared to similar buildings, and if they are not performing well they have the option to take steps to improve their energy performance. By reducing their energy use they can then lower their energy bill, reduce greenhouse gas emissions, improve air quality, and gain recognition for being energy efficient.
Since 2008, 14 local and two state governments have implemented benchmarking policies for commercial buildings to track those buildings’ energy consumption. These policies contain both minimum square footage requirements and reporting and disclosure policies, including whether the benchmarking data must be supplied to the government, to potential lessees and buyers, and/or to the general public. However, these policies are not currently standardized.
Commercial buildings represent a significant portion of the greenhouse gas emissions in the United States. Since 2008, the average building that benchmarked their buildings using Energy Star Portfolio Manager, the benchmarking platform used in all existing policies, was able to create an annual energy savings of 2.4% a year. This reduction in energy usage was resilient over time, as buildings that benchmarked with Energy Star saw a reduction of annual energy usage of 7.2% over 3 years.
Benchmarking policies are directly correlated with owner investments in efficiency improvements that reduce buildings’ utility bills and decrease greenhouse gas emissions. However, benchmarking policies could strain government and business relations as they require commercial building owners to provide potentially competitive information that could be shared publicly. Also, benchmarking policies would extend the role of the government into the marketplace, which could be seen as intrusive by business owners who think the government is trying to dictate to them how they should run their business.
giving prospective buyers more information about buildings’ energy efficiency and transforming the market.
I. Introduction
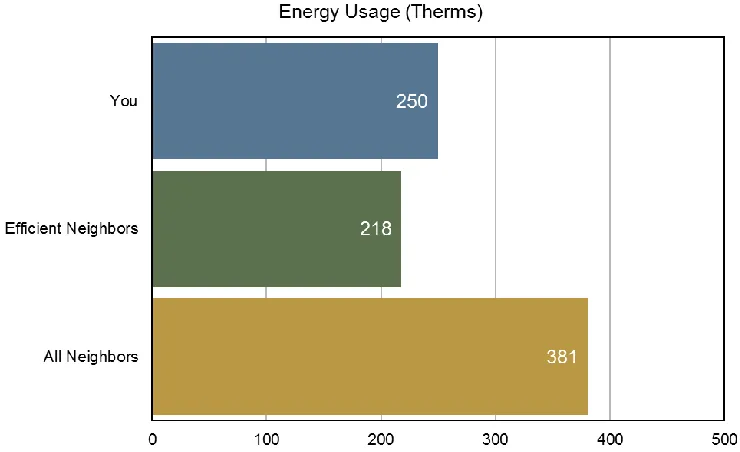
Benchmarking is the process of measuring a building’s energy use over a one-year period and comparing that energy use to similar buildings’ energy use, as well as to local and national targets. Local governmental targets often take the form of a 10% or 20% reduction of energy use from present levels over the course of 5 or 10 years. An example of a federal energy use reduction target is the Energy Policy Act of 2005, which was expanded under the Energy Independence and Security Act of 2007, which requires that all new and existing federal buildings reduce their energy use 30% compared with 2003, by 2015 (Doris et al. 2009). A common non-profit target that is included are the ASHRAE targets, which are for high performing buildings. To participate in benchmarking, a building operator or owner would upload their utility consumption and information about their building characteristics (e.g. size, use, occupancy) into a benchmarking software platform. The benchmarking platform will compare the building’s energy use to a dataset of other buildings that are of a similar size, use, and in similar weather conditions. Then, the benchmarking platform can display the building performance and provide this information to the building operator or owner. There are options for choosing which information to provide when benchmarking. Buildings may be compared to buildings in the immediate vicinity, or in the same climate zone (Fig.
1). Targets for energy efficiency may be displayed along with benchmarking data (Fig. 2). These options will be discussed further. Building owners will then submit the benchmarking information to the government entity requiring the information who, depending on the policy, will disclose the information to the public or to potential lessees, renters or buyers. There are advantages and disadvantages to the various levels of disclosure that will be discussed at length later.
Benchmarking and disclosure policies can have the greatest effect on the least energy efficient buildings, giving lower performers a chance to catch up to their better performing peers. When a building is shown to perform poorer than its peers, often a simple change in building management, such as turning the lights off at night, making changes to building scheduling, or purchasing more energy efficient products, can significantly impact a building’s performance and reduce energy bills.
Benchmarking a building’s energy use is a good first step in understanding how a building is performing compared to itself over time, to similar buildings, or to national targets. The next step is up to the building operator’s discretion. The additional information provided by benchmarking allows building owners to identify building with high energy use and identify needed changes to the building’s operations or equipment. This provides an opportunity to use their building in a more energy
efficient way and reduce their energy bill and associated greenhouse gas emissions.
Once a building is benchmarked and if there is a policy in place that requires disclosure, there are opportunities for market transformation. City, state or federal governments can choose to either not disclose the benchmarking data or require the information to be made public. If the information is made available to lessees/buyers then the market may shift to rewarding better performing buildings (e.g., increasing occupancy rates or rents relative to less energy efficient buildings) and building owners will have more incentive to improve their energy use intensity. If the information is made available to the public, then poorer performing buildings can be targeted by companies specializing in energy
efficiency improvements and energy service companies will start to grow in the area where the benchmarking and disclosure policy is in place.
There are advantages and disadvantages associated with implementing benchmarking policies. An advantage for building operators is that more information about a building helps them make more informed decisions, which in turn may help them lower their energy use and reduce carbon emissions. For the market, the energy efficiency sector is made more robust since building operators will invest in more energy efficient products and tools, or retrofits of their equipment and operations. Research shows that the largest challenge jurisdictions face in requiring benchmarking is that reluctance of commercial building operators to disclose sensitive information about their buildings, since it could be used by competitors to undermine their business. Another possible disadvantage is that the government becomes involved in the market, instead of letting the market itself decide that energy use information will benefit potential lessees or buyers, and savvy green potential lessees or buyers naturally prefer building owners who disclose this information. These will be discussed at length later in the paper.
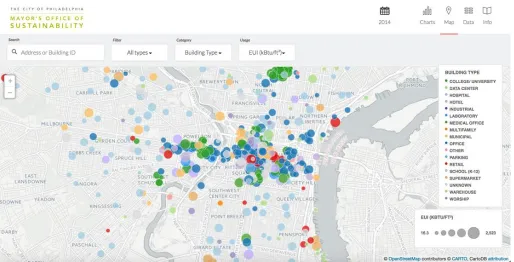
If a commercial building energy benchmarking and disclosure policy is implemented nationwide the next step would be to look at public, residential, and industrial building benchmarking and disclosure policies. Another possible next step is benchmarking visualization (Fig. 3).
II. Research justification
Climate change is a threat to the world’s human population (EPA: Climate Change Impacts; Union of Concerned Scientists). Policies that are associated with reductions in greenhouse gas emissions, which contribute to climate change, should be investigated. Figure 2 - Your target reduction is 29% to reach the ASHRAE goal.
EUI is Energy Use Intensity and it is “expressed as energy per square foot per year. It’s calculated by dividing the total energy consumed by the building in one year (measured in kBtu or GJ) by the total gross floor area of the building” (EPA). ASHRAE Targets are the standard for efficient buildings of your use and climate zone. This figure is modeled after Oregon State Agency
There is evidence that benchmarking and disclosure policies are correlated with reductions in building energy usage, which results in fewer greenhouse gas emissions (discussed at length later in the paper). Mayors of over 500 cities in the United States signed the U.S. Mayors Climate Protection Agreement in which they agreed to try to strive to meet or beat the Kyoto Protocol targets, which includes a 7% reduction in greenhouse gas emissions from 1990 levels. Benchmarking policies could help move towards the Kyoto Protocol targets and the U.S. Mayors Climate Protection Agreement targets, and aligns with the nation’s stated goals (United States Conference of Mayors 2008). Also, more recently, the United States signed the Paris Agreement. The Paris Agreement holds that “climate change represents an urgent and potentially irreversible threat to human societies and the planet and… deep reductions in global emissions will be required” (United Nations 2015). A national benchmarking and disclosure policy would further these efforts.
III. Policy background
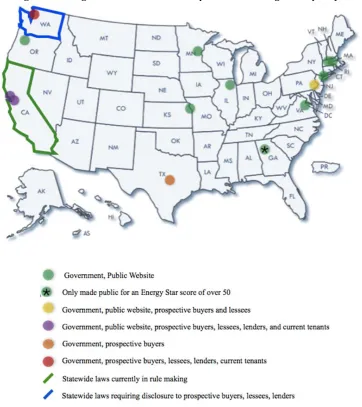
Nationwide, 14 cities have adopted commercial building energy benchmarking and reporting policies, as well as two states – California and Washington.
The 14 cities that have commercial building benchmarking and disclosure policies are Atlanta, Austin, Berkeley, Boston, Cambridge, Chicago, District of Columbia, Kansas City, Minneapolis, New York City, Philadelphia, Portland, OR, San Francisco, and Seattle (Fig. 4). The city-wide policies are similar in that they require benchmarking of commercial buildings’ energy use, but they vary in terms of the minimum building size that is required to participate, enforcement, and whether building owners are required to make their building data public, or are required to share it with potential lessees or buyers.
In 2007 California passed Assembly Bill 1103 (AB 1103) requiring energy benchmarking and disclosure for non-residential (i.e. commercial and industrial buildings), but the bill was repealed in 2015. California passed Assembly Bill 802 (AB 802) in September 2015 and the bill is set to go into effect in January 2017, as such there will not be a required benchmarking and reporting law in California for 2016. The largest difference between AB 1103 and AB 802 is AB 802 makes it easier to collect energy consumption data from utility companies, which was a major implementation problem of AB 1103. AB 802 requires public transparency of commercial and multifamily building energy performance. On May 8, 2009, Washington enacted Senate Bill 5854 (SB Figure 3- Graphic Citation: “2015 Building Energy Benchmarking,” Mayor’s Office of Sustainability, accessed July 24, 2016,
5854) which is a law that requires commercial building energy rating and disclosure. Also required are performance standards and retrofits if necessary for public buildings. Both California and Washington use the Energy Star Portfolio Manager platform for rating and disclosing commercial buildings energy use.
The Pacific Coast Collaborative (an agreement signed by the Governors and Premier of Alaska, California, Oregon, Washington and British Columbia that created targets and set aside funds to meet those goals, though Alaska is not an active participant in benchmarking), identified benchmarking and disclosure policies as a way of reducing existing buildings’ energy use and is developing policies for the jurisdictions in an effort to reduce the region’s greenhouse gas emissions.
With regards to benchmarking and disclosure policies that involve buildings other than commercial buildings, including residential and industrial buildings, a few states and cities across the United States have adopted policies, but they are neither coordinated nor standardized (Keicher 2015).
IV. Methods
The largest component of this policy analysis is a literature review of current policies across the United States and studies by non-profits, cities, states and national organizations that have gathered and analyzed data on benchmarking policies in the United States. Then, the possible difficulties with enacting benchmarking policies more broadly will be presented, along with policy recommendations
for the future.
V. Policy analysis
The most obvious effect of the existing benchmarking policies has been that since 2008, the average building that benchmarked using Energy Star Portfolio Manager shows an annual energy savings of 2.4% a year (EPA 2012). This reduction in energy usage was repeated over time, as buildings that benchmarked with Energy Star saw a reduction of annual energy usage of 7.2% over 3 years.
The reason why buildings that benchmarked with Energy Star reduced their energy use is difficult to determine. One speculation holds that when people begin understanding their energy bills, and receive more information about how their building is performing, they have more reason to actively think about their building’s energy use. They are also more inclined to consider how it could be improved, either simply by turning off electronic devices or improving control of heating and cooling systems, or in larger ways such as retrofitting a building with more insulation or more energy efficient appliances. Another possibility is that when building operators benchmark their building, and they compare their energy use to similar building’s energy use, they decide to improve their buildings in the spirit of competition. Also, it is possible that the Hawthorne Effect affects people, since once they know that they are being observed they decide to change their behavior. Finally, it is possible people improve their energy efficiency in an effort to gain recognition that they are being fiscally responsible or trying to reduce greenhouse gas emissions.
According to a survey conducted by the Institute for Market Transformation of customers that participated in utility benchmarking programs, more than half agreed that benchmarking leads to more energy efficient measures for their buildings. Also, global organizations that regularly track their energy use have implemented three times more energy efficiency measures than global organizations that do not track their energy use (IMT: Energy Benchmarking and Transparency Benefits 2015).
Buildings are a large part of the United States’ energy use, comprising roughly 20% of total energy consumption and consequently greenhouse gas emissions in the United States (Burr et al. 2012). Buildings use 40% of United States primary energy, including 72% of U.S. electricity consumption, and
36% of natural gas consumption (Doris et al. 2009). Commercial buildings make up almost half of building’s energy use (Burr et al. 2012). As of December 2011, over 260,000 buildings across the United States have tracked their energy use, representing over 28 billion square feet and nearly 40% of the commercial market (EPA 2012). The Pacific Coast Collaborative calculated the possible energy savings, using past trends, if California, Oregon and Washington had state wide commercial building energy benchmarking policies. If all three Pacific coast states implemented benchmarking policies for all commercial buildings over 10,000 square feet 82 trillion BTU’s of energy could be saved per year by 2028. This energy reduction would result in a reduction of 6.5 million metric tons of carbon dioxide equivalent per year (Pacific Coast Collaborative). In other words, the annual reduction of greenhouse gas emissions would be equal to the annual energy use of 597,052 homes, or the annual energy use of 1,201,758 passenger vehicles.
With regards to the similarities and dissimilarities of existing policies, all 14 cities and California and Washington have chosen a minimum size of commercial building that will be affected by the policy. See Table 1. All jurisdictions chose a minimum square footage of between 10k square feet and 50k square feet (Keicher 2015). Many of the policies begin with only large buildings required to report, and then they ratchet down over a number of years. For example, Portland, OR has recently adopted a benchmarking policy which will require annual reporting for all commercial buildings over 50,000 square feet for the calendar year of 2015, and over 20,000 square feet for the calendar year of 2016.
form of penalty for non-compliance, there are other means of enforcement. In Minneapolis, the city can revoke a building owner’s certificate of commercial building registration or business license for noncompliance.
Reporting and disclosure is another part of benchmarking policies that is not standardized across the United States (Fig. 4, Table 1). In Atlanta, the city will electronically make available the disclosed benchmarking information if the property performed better than or equal to the national median. In Berkeley, the state of California, Philadelphia, Seattle and Washington State the building energy data must be made available to prospective lessees and buyers. In Austin the building energy data must be provided to potential buyers, but not lessees. In Atlanta, Berkeley, Boston, Chicago, District of Columbia, Kansas City, Minneapolis, New York City, San Francisco and Philadelphia the building data is made available to the public. Kansas City’s director will make publicly available all building data, and can arrange for annual reviews to verify the accuracy of the energy performance data. In addition to benchmarking, San Francisco requires annual energy audits. The benchmarking data itself and proof of an energy audit, but not the energy audit itself must be submitted to San Francisco Department of Energy (IMT: Guide to State and Local Energy Performance Regulations 2015)
In terms of additional requirements, the State of California, the state of Washington, Chicago, and New York City require that utility companies be able to upload building data directly to Energy Star Portfolio Manager. This makes benchmarking much easier for building owners who have many buildings, or building operators who do not have time to manually upload their building’s data. Another additional requirement that Atlanta, New York City and San Francisco have is that ASHRAE level I or II audits must be performed every 10 years, every year or every 5 years, respectively. ASHRAE level I audits are walk-through, preliminary audits. ASHRAE level II audits are more intensive and give recommendations for no or low cost EEM (energy efficiency measures). ASHRAE level III audits, which no city or state requires, are the most intensive and give suggestions for large EEM projects.
California is currently in rule making. This means that they have passed Assembly Bill 802 and the California Energy Commission is in charge of
determining the rules of the bill, i.e. the reporting and disclosure requirements, enforcement and additional requirements.
There are a number of building data sets that one can use to manually benchmark a building’s energy data including the Commercial Buildings Energy Consumption Survey (CBECS) and the Buildings Performance Database (BPD). CBECS is a carefully conducted survey of buildings energy use in the United States by the U.S. Energy Information Administration, and they provide a representative sample of buildings’ energy use from the national sample. The BPD., on the other hand, is a broader database that accepts building data from various providers. The BPD., therefore, could have a better comparison for a specific building type, size, or region, but the comparison may not be as representative of the national building set.
There are multiple utility tracking platforms, but many jurisdictions are now standardizing to one primary data collection and benchmarking platform, Energy Star Portfolio Manager. The advantage of using a single platform is that it allows one buildings’ energy use to be compared to the national data sets (such as those provided by CBECS and BPD) in an automated fashion as opposed to manually comparing one building to the national data set. Utility Manager is no longer a supported system, so this is probably not an option moving forward. Energy Star allows for tracking one buildings’ energy use over time and it automatically compares a building to other buildings in CBECS of a similar size, use, weather conditions, etc. Also, Energy Star Portfolio Manager updates its building data set automatically as their data set changes. Another advantage of Energy Star Portfolio Manager is that it has a sharing feature which could be very useful for building operators to report their building energy information with their city, county, state, etc.
There are some private market platforms that are complimentary to Energy Star Portfolio Manager, such as Energy Cap and Ecova. Energy Cap and Ecova allow for data aggregation, bill pay, etc.
basic property information such as gross floor area, operating hours, and number of workers. Then, they would upload energy and water use for each meter (information which can be found on a utility bill). The building’s energy use will then be analyzed, and compared to other buildings of a similar size, use, number of occupants, weather conditions, etc. and the building will then be given an Energy Use Intensity score, and possibly an ENERGY STAR score between 1 and 100, where 100 is the best. A score of 75 or above could be eligible for an ENERGY STAR certification.
There are multiple advantages of all cities/states using the same platform to track their energy use. Although CBECS compares buildings against a dataset that is a representative sample of buildings, the only way to know the exact energy use and change in energy use of the buildings in the United States is to get a complete sample of the entire population. The larger the stock of buildings in the database, the more accurate the data on energy use for a particular sort of building in the United States will be. Another advantage is that if all cities/states use the same platform and dataset, it will be easier to compare cities and states against each other so they can determine how well they are doing, and possibly encourage friendly competition.
Other, more broad, advantages of benchmarking policies have been market transformation towards more energy efficient products and services. One way that building energy use data can be utilized by the market is that energy service companies can reach out to underperforming buildings, and help them decrease their energy use, which could be a good investment for the building operator. Examples include in San Francisco, where Pacific Gas and Electric Company use benchmarking data to streamline outreach to buildings that could use energy efficiency services. Another example is in Massachusetts, where the Low-Income Energy Affordability Network, Massachusetts Utilities and WegoWise used benchmarking data to target buildings for improvement. Other skilled local workers who could benefit from benchmarking policies would be people who provide energy efficiency services such as engineers, energy auditors, architects, facility managers, and construction workers (IMT: Energy Benchmarking and Transparency Benefits 2015).
In addition to the direct benefit to the buildings’ owners, who could reduce their energy bills, there is
evidence that for every million dollars spent on energy efficiency improvements, five to fifteen jobs are created (EPA 2009). Also, for cities that have adopted mandatory benchmarking and disclosure policies, the cities have seen a 30% increase in energy efficiency businesses (Burr et al. 2011).
When building owners and buyers/tenants have more information about buildings’ energy use, the market will change with this new input. Owners and operators will determine that their buildings are worth more if they are maintained well and are energy efficient, and savvy buyers/tenants will seek out and regard more highly buildings that are performing better. The push from owners and pull from buyers will move the market towards more energy efficient buildings (U.S. Department of Energy 2015).
One feature that some cities (Boston, Chicago, Philadelphia and New York), are working on is creating benchmarking visualization after the first year of benchmarking data is made available to the public, so that buyers/tenants can more easily access benchmarking information. This will solidly place energy efficiency within the marketplace. Usually, visualization takes the form of an interactive map where potential tenants can click on buildings and see their benchmarking data. Usually the buildings will also be colored in a manner such that one can easily see whether their energy efficiency is good or bad (Fig. 3).
Governments can use the benchmarking data by requiring the building owners hire a consultant to help them manage their energy use if their energy use intensity is too high or their Energy Star score is too low. Another option is buildings that are low performing could be eligible to receive grants to perform energy audits, or help them with low cost ways of reducing their energy use, or even with retrofitting their building.
Another advantage of having the information shared publicly, besides catalyzing building operators to work on their buildings, is that it is easier to track how cities, states and the nation are either improving or not with regards to commercial building energy use. Cities could even have friendly competition and try to reduce the energy use of their public or commercial buildings compared to their neighbors.
need for the government to step into the business realm. Since the EPA Energy Star Portfolio Manager is a free online tool, it is possible that building owners could start to publicize their energy star scores for potential lessees and buyers and green, savvy buyers could begin to prefer well rated buildings, thus drawing the market to include building energy data without the intrusion of government into the market. Also possible is a non-government entity such as non-profits, renewable or standard energy or utility companies, or energy audit companies could provide benchmarking information and support to aid businesses with benchmarking without the government, and they will be as successful as the market allows. However, there are two downsides of pursuing market-based approaches to benchmarking instead of government intervention. The first downside is that benchmarking policies often help the least well performing buildings by giving them more information about their buildings so that they can improve their energy efficiency. If buildings are allowed to pursue energy efficiency scores at their leisure, worst performing buildings may simply decide not to participate. The second downside is that if the government is not involved with benchmarking they cannot offer grants to least well performing buildings, and rewards such as acknowledgments of achievement to best performing buildings.
Another disadvantage of benchmarking policies is that businesses might view their energy efficiency as competitive information that could be used against them. Another possibility is that a building operator could view their energy use as private information, and be resistant to the idea of sharing their information with a government agency. The largest disadvantage to benchmarking policies is building owners would need to allocate time and resources to inputting their building’s information, understanding the data, and possibly changing how they use their building. Time, personnel and money are all constraints on a building owner that this policy strains.
The advantages outweigh the potential disadvantages with regards to benchmarking policies, but the disadvantages need to be considered carefully. Wariness of competition and intrusion may be lessened since only the building operator would have access to the specific information regarding their exact energy usage and
energy bills. Only the building’s comparison to other buildings is made public. This allows the advantages of the policy without the disadvantages. Also, the most popular route (11 of the 14 cities) is to allow one year between when the policy is enacted to when the data must be published publicly or to potential lessees or buyers so that building owners can improve their building’s energy efficiency if they wish. For example, Portland’s commercial building energy benchmarking policy, which will begin required compliance of all commercial and residential buildings over 50,000 sq ft by April 22, 2016, will require all commercial buildings to post publicly the results of their energy benchmarking reports on October 1, 2017.
It is good practice for local jurisdictions to implement internal, municipal benchmarking requirements for city buildings before they require benchmarking commercial buildings. This helps the local jurisdictions understand the nuts and bolts of the policy, and decide if it would be a good policy for their locale.
VI. Conclusion and policy recommendations For commercial building benchmarking policies, the most common platform for reporting and analyzing building data is the USEPA’s Energy Star Portfolio Manager. In the interest of standardization, and because Energy Star Portfolio Manager automatically compares a building data to CBECS, and because of its convenient sharing feature, this should be the platform with which the national policy is constructed.
While a smaller square footage requirement would encompass more buildings and be a more effective policy, there are some advantages to having the first year of required benchmarking reporting encompass fewer buildings so that the method of collecting and analyzing data can be determined and streamlined. As was mentioned previously, several of the existing benchmarking policies begin with fewer buildings affected, for instance, 100,000 sq ft and greater, and then ratchet down over several years, encompassing more buildings.
potential lessees, buyers and lenders they would have to compile and give that information themselves, which also is unnecessary because in most cases the information is required to be posted online. However, benchmarking data being provided to potential lessees, buyers and lenders is important for energy transparency and for giving savvy buyers more information about a building’s energy use. Also, giving potential buyers more information is what will bring energy efficiency into the market place and make it an aspect of a building worth considering. Most of the existing policies have a one year grace period after the policy is enacted during which benchmarking data is not made public so that building owners have time to improve their energy efficiency before it is made public. Overall, jurisdictions will have to weigh the advantages and disadvantages of reporting requirements and decide what will work best for their area.
In terms of enforcement, existing policies both do and do not have penalties associated with failing to report a building’s energy use. Again, while the policy will work best if everyone engages with it, in the end the benefit of benchmarking is to the building owner and operator and if they do not want to comply, perhaps that should be their choice. Penalties, again, should be determined by local jurisdictions.
Ideally, high performing buildings should receive an award for their commitment to energy efficiency
and greenhouse gas reduction. Low performing buildings should be eligible for grants to reduce the cost of an energy audit, energy efficient projects, or retrofitting.
It makes data collection much easier if utilities are required to upload building data, and required ASHRAE level I and II audits further the information about energy efficiency and ability for building owners and operators to reduce their energy use, but both of these measures are optional and should be included in a benchmarking policy at a jurisdiction’s discretion.
In conclusion, given the advantages and disadvantages of benchmarking policies, and the success of existing benchmarking policies in reducing energy use and therefore greenhouse gas emissions, I recommend local jurisdictions implement commercial building energy benchmarking and disclosure policies. It is good practice that first, there should be internal policies of public building benchmarking and reporting, so that the results of energy use reduction can be used to show that the policy is good for building operators. Afterward local jurisdictions implement a commercial building benchmarking and disclosure policies, there should be residential and then industrial policies. Eventually, there should a nationwide benchmarking and disclosure policy.
Table 1:
Atlanta Austin Berkeley Boston California Cambridge Chicago District of
Columbia
Legislation Title
Atlanta Commercial Buildings Energy Efficiency Ordinance
Energy Conservatio n
Audit & Disclosure (ECAD) Ordinance
Building Energy Saving Ordinance
Boston Energy Reporting and Disclosure Ordinance
Assembly Bill 802
Building Energy Use Disclosure Ordinance
Chapter 18-14. Building Energy Use Benchmarki ng Ordinance
Clean and Affordable Energy Act of 2008
Size of building affected (sq ft)
Disclosure require-ment Gov’t, public website (for E.S. score of 50+) Gov’t, buyers Gov’t, public website, buyers, lessees, current tenants Gov’t, public website Gov’t, public website (California is currently in rule making) Gov’t, public website Gov’t, public website Gov’t, public website Enforce- ment
$1,000 fine Fine up to $2,000 Fine not exceeding $1000, and/or imprisonme nt not exceeding 6 months, or fine determined by enforcemen t officer For 50,000 sq ft+, a fine of up to $200 per day. For 35,000 sq ft to 50,000 sq ft, up to $75 fine per day. For tenants, up to $35 per day. None to exceed $3000. Fine, determined by California Energy Comm-ission (California is currently in rule making)
For the first violation, a written warning. For subsequent violations, a fine of $300
$100 fine for first violation, and a fine of $25 for subsequent violations Not complying is a violation. A person will be fined not more than $10,000 Additional require- ments ASHRAE level II audits every 10 years Energy report every 5 years for large buildings, every 8 years for small and medium buildings Periodic energy assess- ments and/or actions Data must be able to be uploaded by utilities Verification of bench-marking data 1st year and then every 3 years. Data must be able to be uploaded by utilities Kansas City Minnea-polis New York City Philadel-phia Portland, OR San Francisco Seattle Washing-ton Legislation Title Energy Empowerm ent Ordinance Chapter 47.190. Commercial Building Rating and Disclosure Ordinance Local Law 84 (additional requirement s in LL 87, LL 88) §9-3402 of the Philadelphia Code Energy Performanc e Reporting Policy Existing Commercial Buildings Energy Performanc e Ord.
CB 116731 Senate Bill 5854
Size of building affected (sq ft)
Disclosure require-ment Gov’t, public website Gov’t, public website Gov’t, public website Gov’t, public website, buyers, lessees Gov’t, public website Gov’t, public website, buyers, lessees, lenders, current tenants Gov’t, buyers, lessees, lenders, current tenants Prospective buyer, lessee, or lender Enforce- ment First violation is a written warning. After 60 days, for each day there will be a fine between $50 and $500. Total fines not to exceed $2000 annually First violation is a written warning with 45 days to comply. Afterwards, civil fines determined by city council. Commercial building license may be denied or revoked $500 fine. Additional fines quarterly Initial $300 fine for first 30 days. Each day after is a fine of $100
First violation is a written warning, followed by an up to $500 fine for each subsequent 90 day period First violation is a written warning. After 45 days, if noncomplia nce continues, for 50,000 sq ft+, fines of $100 per day for 25 days in 1 year. For 49,000 sq ft-, $50 per day for 25 days in 1 year $150 for first violation, $500 for subsequent violations Additional require- ments ASHRAE level II audits & RCx (LL 87), lighting upgrades & sub-metering (LL 88). Data must be able to be
uploaded by utilities
ASHRAE level I or II audits or RCx every 5 years
Data must be able to be
uploaded by utilities
References
Burr, Andrew and Amanda Kolson Hurley. 2011. “Building Energy Disclosure Laws Push Companies to Hire.”
Institute for Market Transformation.
Burr, Andrew, Narel, Tracy and Cody Taylor. 2012. “Energy
Benchmarking, Rating, and Disclosure for Local
Governments.” SeeACTION, May 23.
U.S. EPA. 2016. “Climate Change Impacts.” Accessed July
24. https://www3.epa.gov/climatechange/impacts/.
Doris, Elizabeth, Cochran, Jaquelin, and Martin Vorum.
2009. “Energy Efficiency Policy in the United States:
Overview of Trends at Different Levels of Government.”
National Renewable Energy Laboratory, December.
IMT. 2015. “Energy Benchmarking and Transparency
Benefits.” Institute for Market Transformation.
IMT and Commercial Real Estate Services, Worldwide.
2015. “Guide to State and Local Energy Performance
Regulations.” Guide to State and Local Energy
Performance Regulations.
Keicher, Caroline. 2015. “Comparison of U.S. Commercial
Building Energy Benchmarking and Transparency
Policies.” Institute for Market Transformation,
September.
Keicher, Caroline. 2015. “Map: U.S. Building Benchmarking
and Transparency Policies.” Institute for Market
Pacific Coast Collaborative, “PCC Mandatory Benchmarking
and Disclosure - Executive Summary.”
Union of Concerned Scientists. 2016. “Global Warming
Impacts.”
U.S. Department of Energy. 2015. “Benchmarking &
Transparency Policy and Program Impact Evaluation Handbook,” May.
U.S. EPA. 2012. “Benchmarking and Energy Savings:
DataTrends,”October.
U.S. EPA. 2009. “Rapid Deployment Energy Efficiency
(RDEE) Toolkit: Planning & Implementation Guides,”
May 1.
United Nations. 2015. “Adoption of the Paris Agreement.”
Paper presented at the Framework Convention for Climate Change, Paris, France, December 12.
United States Conference of Mayors. 2005. “U.S. Conference
of Mayors Climate Protection Agreement.” Paper
presented at the 73rd Annual U.S. Conference of Mayors meeting, Chicago, Illinois.
Author Bio –Rebecca Ruff is a senior undergraduate at Willamette University, the Benchmarking and Disclosure Intern at Oregon Department of Energy, and a fellow at Oregon Climate. Most of Rebecca’s work has been in domestic and local energy policy analysis.