International Journal of Science Technology
Management and Research
Available online at: www.ijstmr.com
IJSTMR
©
2018 | All Rights Reserved 14Indian Traffic Sign Detection Using a Cascade Method
and Saliency Test with Machine Classification
Aditya Nagare
Department of Computer Engineering Late G.N. Sapkal COE
Nashik, MH, India
Shoeb Inamdar
Department of Computer Engineering Late G.N. Sapkal COE
Nashik, MH, India
Mohini Kajale
Department of Computer Engineering Late G.N. Sapkal COE
Nashik, MH, India
Pramila Jadhav
Department of Computer Engineering Late G.N. Sapkal COE
Nashik, MH, India
Abstract: The system provides detection of traffic signs for driver assistance. The system provides a fast detection of traffic signs based on a cascade method. The system also provides real-time detection of signs using machine learning. To further increase speed, we also have used a saliency test based on mid-level features to pre-prune background windows. Experiments on Indian public traffic sign data sets show that the system detects and achieves competing performance and runs 2∼7 times as fast as most of the state-of-the-art methods. The system also provides classification of traffic signs with the help of machine vision.
Keywords: Traffic sign detection, cascade system, Saliency test, machine learning, Machine vision, object detection.
I. INTRODUCTION
TRAFFIC sign detection and recognition plays an important role in intelligent transportation such as driver assistance systems, road maintenance and automated driving. It has industrial potential in Driver Assistant System and Intelligent Autonomous vehicles. Although signs are designed with distinct color and simple shape, automatic detection is still challenging in complex scenes, because the background and illumination are changing, signs may be distorted in conspicuous color and regular shape, and sometimes, partially occluded. It helps attract human drivers attention s as to be easily captured by human drivers. There are many difficulties for identifying traffic signs by computer algorithms due to illumination changes, color deterioration, motion blur, cluttered background and partial occlusion, etc In addition, the image undergoes motion blur when the vehicle moves fast. A traffic sign detection method should be designed to overcome these problems. It shows high accuracy and reliability. Moreover, detection should be fast to satisfy real-time applications such as driver assistance systems. Traffic sign detection has been studied eagerly in the past decades and many approaches have been proposed. Early methods usually utilize the color or geometric information of traffic signs. Since the famous Viola-Jones detector was successfully used in face detection, sliding window and machine learning based methods have become frequent. Recently, some sliding window based methods achieved high performance in the competition of Germany Traffic Sign Detection Benchmark (GTSDB). Nevertheless, these methods are computationally expensive. We decided to design a fast traffic sign detection system to maintain the performance advantage of sliding window based methods with significant speedup. There are three main benefactions in this work.
We propose a cascade framework with neighboring scale awareness for fast traffic sign detection. The system has only one free parameter to control the tradeoff between detection speed and accuracy, while the multiple thresholds are selected by a data driven approach.
We design an approximation approach for fast feature extraction, which leads to additional speedup.
We propose a novel saliency test based on mid-level features, which is demonstrated to be robust and effective in pre pruning windows.
IJSTMR
©
2018 | All Rights Reserved 15 in the next stage with a stronger classifier. We use linear classifiers for the first three stages and a nonlinear classifier for the last stage. The used features also have increasing Computation difficulty or dimensionality from one stage to another stage. The early stages with fast and simplified features run fast to eliminate apparent non-sign windows while preserving signs with high recall rate. The latter stages, based on more representative features that are computed more accurately with more information, provide better discrimination. The saliency test before the cascade can preclude a portion of windows from evaluation by the cascaded classifiers.We also demonstrated the promise of the proposed method on the Swedish Traffic Signs Dataset (STSD). A preliminary version of the proposed method was presented in a conference paper.
Since then, the work has been extended in several ways:
The method is simplified by eliminating the utilization of multi-resolution models in the first two stages, which effects in reducing artificial parameters.
A data-driving approach is proposed to optimize the thresholds in the system, leaving only one free parameter to select.
Experimental evaluation is enhanced with detailed analysis and an additional dataset. The rest of this paper is organized as follow.
Fig. 1. The pipeline of the proposed traffic sign recognition system. (a) Original image. (b) Probability maps (red + blue). (c) Proposals. (d) Detection result. (e) Classification.
II. METHDOLOGIES USED
A. Flow of the System:
Following is the flow of the system, the system uses various methods described in further sections. Using these methods road traffic signs can be detected and classified into categories. It also possible to train the system for detecting the signs in real-time.
IJSTMR
©
2018 | All Rights Reserved 16B. Fast Feature Extraction
Our HHVCas system uses several different HOG variants, including integral HOG [45] and its compressed version, HOG [46] and color HOG.
1) HOG: First, the gradient of each pixel in the image is quantized according to orientation. The image plane is then partitioned into a dense grid of rectangular cells. In each cell, the pixel-level features (values of N orientation channels)are accumulated to obtain cell-based histograms of oriented gradients, where each pixel contributes to the cells around it by bilinear interpolation. The cell-based features are further normalized in larger spatial regions called blocks. Typically, blocks include 2 × 2 cells and overlap by one cell. Hence, each cell is normalized by four factors corresponding to four blocks which it belongs to, producing a 4 × N-dimensional feature vector for the cell. In a detection window, the cell based features are concatenated into a long feature vector for evaluation.
2) Compressed Integral HOG: The high dimensionality of integral HOG leads to expensive window evaluation, so we introduce a condensed version. Unlike in integral HOG that the N-dimensional histograms of each cell are normalized by four different factors to form a 4 × N-dimensional vector, we can obtain a compressed vector of 4+ N-dimension, by summing over both the four normalized values for a fixed orientation and the N orientations for a fixed normalization factor.
4) Color HOG: For each color channel of image, HOG feature is calculated for each cell as in the above procedure, and histograms of different channels of all cells in a detection window are concatenated into a long feature vector. The parameters for the HOG variants used in our system are summarized in Table I. Since each window is partitioned into 5×5 cells, the feature dimensionality is 800 for HOG and integral HOG, 2400 for color HOG, and 300 for compressed integral HOG.
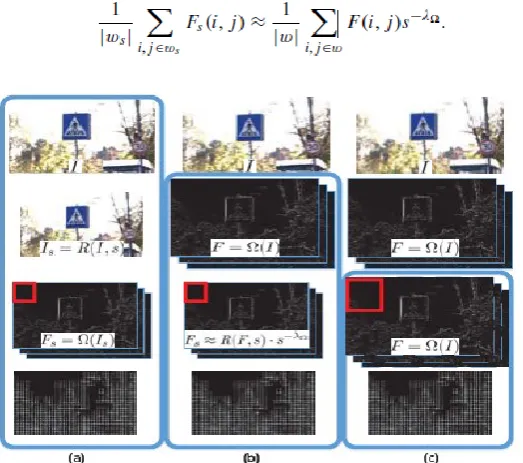
In our system, the integral HOG feature is calculated a multiple scales for Stage I and Stage II evaluation. To construct such an integral HOG pyramid is computationally expensive due to the calculation of oriented gradients for each pixel. Inspired by the method in [48], we propose a fast strategy by sharing orientation channels among neighboring scales. Let I denote an m × n image, Is denote the scaling of I with a factor s, R(I, s) specify the sampling of I with factor s, and F denote the maps of extracted features of an image. Suppose we have computed F = _(I ), e.g. N gradient orientation maps.
The scaled maps Fs can be obtained by
Fs = _(Is) = _(R(I, s)). Alternatively, Dollár et al. [48] proposed the approximation
Fs ≈ R(F, s) · s−λ_,
where λ_ is a feature-related parameter. Equation (2) shows that the N orientation maps of Is can be approximated by those maps of I . We propose a further acceleration technique by considering the relation between F and Fs with scaled cell
w = ws · s:.
Fig. 3. Strategies for calculating integral HOG of different scales. (a) Ordinary method: oriented gradient maps of different scales are calculated independently. (b) Approximation of [48], oriented gradient maps of Is are obtained by resampling those of I. (c) Integral HOG for Is are approximated from the N orientation channels
of I with a scaled cell w = ws · s.vector.
IJSTMR
©
2018 | All Rights Reserved 17 To saving feature calculation by approximating feature maps from neighbouring scales as described, we also use neighboring scale awareness to save window evaluation. We speed up detection by exploiting the correlation between the detection windows in neighboring scales.D. Parameter Optimization:
The HHVC as detector involves thresholds for both per stage classifier rejection and neighboring scale awareness based pruning. We optimize the thresholds jointly using an unsupervised data-driven optimization approach, as inspired by the work for a soft cascade. We consider the thresholds for the first three stages Hk in HHVC as, since the threshold in the last stage is variable for tradeoff the precision and recall rate.
E. Saliency Test:
Preceding the cascade detector with a pre-pruning module based on saliency test can further speed up detection. We propose a robust saliency test based on mid-level features (such as HOG) instead of on low-level features in common saliency based detection. This is intuitive that a mid-level representation is more discriminative than a low-level one to locate candidate sign regions, while a low-level representation may not prune non-sign regions reliably though it runs fast.
F. ANN:
ANN is a two-layer feed forward neural network. The sigmoid transfer function is applied in the hidden layer, and this is been used with output layer. For the training of multiple layer ANN, a systematic method is applied with the back propagation learning algorithm to the network.
G. Machine learning:
Machine learning phase, various traffic signs were used to train the classifier. Various features were extracted from these images to create a master feature vector. This master feature vector is then fed to the classifier as an input to construct the classification model. In recognition or classification phase, a traffic sign is detected from the image, then features are extracted from the detected image to convert the detected sign into a feature vector.
III. SYSTEM OVERVIEW
Following is the overview of the system with help of screenshots:
IJSTMR
©
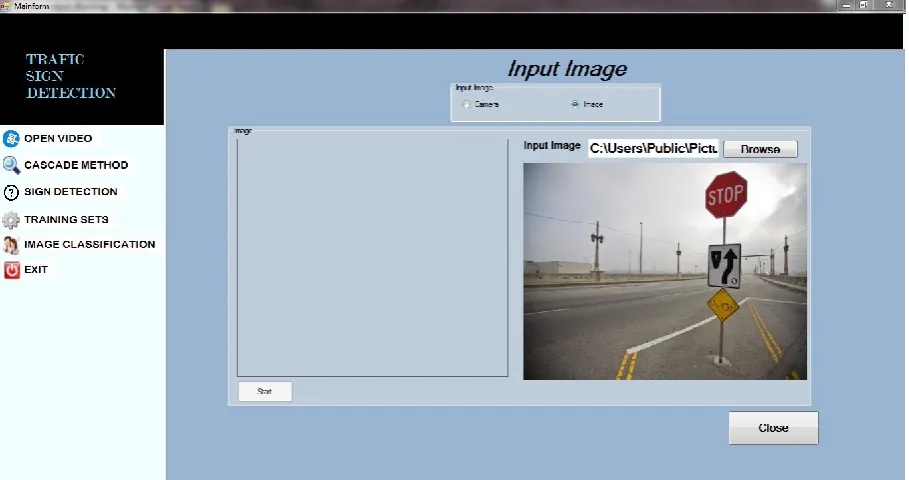
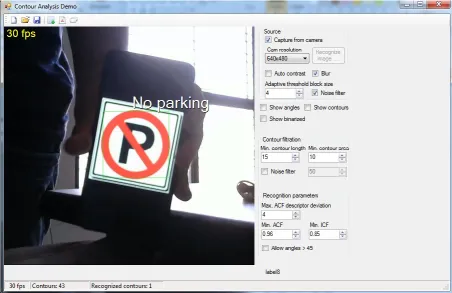
2018 | All Rights Reserved 18Fig. 5.Input to The System
IJSTMR
©
2018 | All Rights Reserved 19Fig. 7. Saliency Test for Sign Detection
Fig. 8. Mapping of Sign
IJSTMR
©
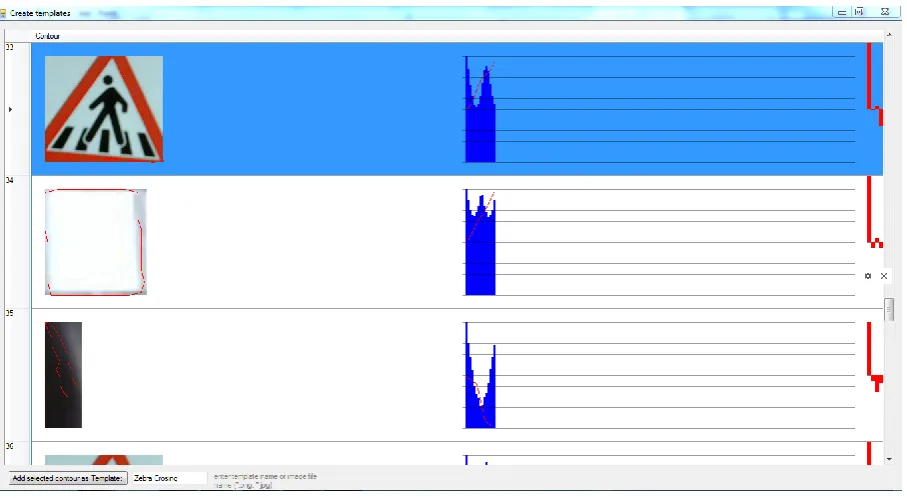
2018 | All Rights Reserved 20Fig. 10. Training the System for Classification
IJSTMR
©
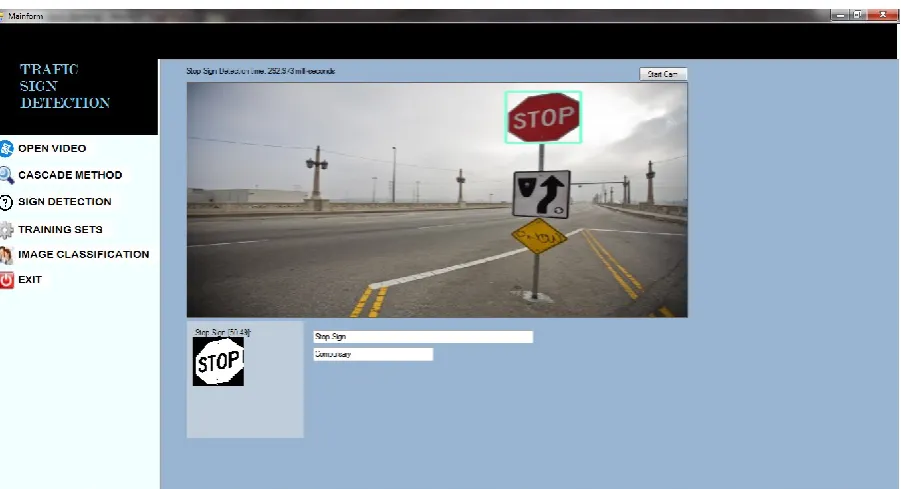
2018 | All Rights Reserved 21Fig. 12. Real Time Traffic Detection after training the system.
CONCLUSION
Hence, in this way we have implemented a system for detection of Indian Road Traffic Signs by using Cascade Method and Saliency Test. Our system provides manual input detection of the traffic signs and the system detects the traffic signs in real time using machine vision.
REFERENCE
1. A. Møgelmose, M. M. Trivedi, and T. B. Moeslund, “Vision-based traffic sign detection and analysis for intelligent driver assistance systems:Perspectives and
survey,” IEEE Trans. Intell. Transp. Syst., vol. 13, no. 4, pp. 1484–1497, Dec. 2012.
2. S. Houben, “A single target voting scheme for traffic sign detection,” in Proc. IEEE Intell. Veh. Symp., Jun. 2011, pp. 124–129.
3. P. Viola and M. J. Jones, “Robust real-time face detection,” Int. J. Comput. Vis., vol. 57, no. 2, pp. 137–154, 2004.
4. M. Mathias, R. Timofte, R. Benenson, and L. Van Gool, “Traffic sign recognition—How far are we from the solution?” in Proc. IEEE Int.Joint Conf. Neural
Netw., Aug. 2013, pp. 1–8..
5. G. Wang, G. Ren, Z. Wu, Y. Zhao, and L. Jiang, “A robust, coarse-tofine traffic sign detection method,” in Proc. IEEE Int. Joint Conf. Neural Netw., Aug. 2013,
pp. 1–5.
6. M. Liang, M. Yuan, X. Hu, J. Li, and H. Liu, “Traffic sign detection by ROI extraction and histogram features-based recognition,” in Proc.IEEE Int. Joint Conf.
Neural Netw., Aug. 2013, pp. 1–8.
7. S. Houben, J. Stallkamp, J. Salmen, M. Schlipsing, and C. Igel, “Detection of traffic signs in real-world images:The German traffic sign detection benchmark,”
in Proc. IEEE Int. Joint Conf. Neural Netw., Aug. 2013, pp. 1–8.
8. Y. Yang, H. Luo, H. Xu, and F. Wu, “Towards real-time traffic sign detection and classification,” IEEE Trans.Intell. Transp. Syst., vol. 17,no. 7, pp. 2022–2031,
Jul. 2016.
9. F. Larsson and M. Felsberg, “Using Fourier descriptors and spatial models for traffic sign recognition,” in Proc.Scandin. Conf. Image Anal.,2011, pp. 238–249.
10. D. Wang, S. Yue, J. Xu, X. Hou, and C.-L. Liu, “A saliency-based cascade method for fast traffic sign detection,” in Proc. IEEE Intell.Veh. Symp., Jun. 2015, pp.
180–185.