B. Venkateswara Reddy
Department of Pharmaceutics, School of Pharmacy, Monad University, Hapur, U.P, India.
E-mail: [email protected]
Address for correspondence
B. Venkateshwara Reddy et al. / Journal of Global Trends in Pharmaceutical Sciences 5(2)-(2014) 1706 – 1715
PREPARATION AND CHARACTERIZATION OF POLYMERIC AND ADHESIVE MATRIX
DIFFUSIONAL TRANSDERMAL DRUG DELIVERY DEVICE OF ATENOLOL
INTRODUCTION:
The age-old theory that imparted the status of “dead, impermeable barrier devoid of biological activity” to skin had already been challenged by the development of pioneering transdermal product1, but a less than impressive commercial growth in this sector had raised some doubts about the feasibility of this route as an efficient device of drug delivery. The journey of transdermal research had commenced with a lots of enthusiasm, as it heralded the promise of noninvasive cutaneous application. The projected advantages were publicized so much that the target consumers were prepared to accept the product even if they were costlier alternatives to the conventional therapy. This acceptability factor had encouraged researchers and industries alike to take up challenging project in this particular area. For the last two decades, it remained an area of vital research interest, and data was generated for almost every available drugs.2
Transdermal dosage forms, though a costly alternative to the conventional formulations, are becoming popular because of some unique advantages. Controlled zero order absorption, simple administration mode and the option of easy removal in case of adverse manifestations make them particularly desirable in
cardiovascular therapy. Nitroglycerine and Isosorbide dinitrate, the two antiischaemic drugs; and the Clonidine, an antihypertensive molecule, are being extensively used in the transdermal form. Studies that compared with the established dosage forms had shown that though patches were costlier than conventional prescription products they reduced the occurrence of hospitalization and diagnostic cost. Currently numbers of antihypertensive drugs are under investigation for transdermal administration. Antihypertensive is group of cardiovascular agents that had generated excitement amongst the transdermal scientists, specifically the β-adrenergic receptor antagonist. These drugs have a multiple utilities and are administered in hypertension, ischaemic heart disease including certain types of arrhythmias. Since antihypertensive suffer from the disadvantages of extensive first pass metabolism and variable bioavailability, they were considered ideal transdermal candidate.3
Atenolol, a β-adrenergic receptor antagonist, has been shown to be safe and effective in the treatment of patients with hypertension. It has a mean plasma half-life of 6 hrs and only 45% of the orally administered drug reaches the circulation due to hepatic metabolism. A model reported predicts that mean plasma Atenolol concentration of 43, 99 and 175 ng/ml are required to produce a 20%, 30%, and 40% reduction in blood pressure respectively.4 This concentration can be achieved by preparing matrix diffusion controlled transdermal drug delivery system. Atenolol, a The present study was aimed at the development of polymeric and adhesive matrix diffusional transdermal drug delivery system of Atenolol using various polymers. Specific strategies like use of penetration enhancers shall be employed to meet systematic requirement of drug. Different formulation variable shall be studied and optimized to achieve the desired release profile. In the present investigation, the influence of various grades and concentration of polymers were studied. P o l y m e r i c Matrix type transdermal patches containing Atenolol were prepared using different polymers such as Ethyl Vinyl Acetate, ERS100, ERL100, Ethyl Cellulose, Poly Vinyl Pyrollidone and Hydroxy propyl methyl cellulose. Study was carried out to formulate an elegant product exhibiting desired therapeutic performance, from a small and cute dosage form. Finally selected devices shall be evaluated for in vitro study using human live skin. The delivery device was subjected to accelerated stability study as per ICH guideline. Results of stability study suggested a shelf life of 82 weeks (polymeric matrix) a n d 75 weeks (adhesive matrix) stored at room temperature.
Keywords: Transdermal drug delivery system; Penetration enhancers; Ethyl vinyl acetate; Accelerated stability studies.
ABSTRACT
B. Venkateswara Reddy*,
S. Satyanandam
Department of Pharmaceutics, School of Pharmacy, Monad University, Hapur, U.P, India
Journal of Global Trends in Pharmaceutical Sciences
Journal home page: www.jgtps.com
ISSN: 2230-7346
hydrophilic drug, with a relatively high effective concentration was less investigated compare to other β- blockers. Limited data available on the permeation studies shows that permeation increases in presence of chemical enhancers.5
Matrix diffusion controlled release transdermal drug delivery systems are monolithic systems which are the simplest and least expensive means of controlling the release of an active agent. Here the active agent is physically blended with the polymer agent. The release rate is governed by Higuchi equation. Parameter influencing the release characteristics of monolithic devices can be classified as solute dependent factors like solubility, partition co-efficient and diffusion coefficient of drug in the polymer matrix. The solute independent parameters are systems variables like geometry, tortuosity, pores, concentration, volume fraction and diffusion layer etc. in the present investigation solute related factors were considered to fabricate the devices using different polymer matrix. Polymer matrices employed were of n o n p o l a r a n d hydrophobic nature.
Adhesive matrix diffusion controlled release transdermal drug deliver systems are monolithic systems which are the simplest and least expensive means of controlling the release of an active agent. Here the active agent is physically blended with the adhesive agent.6 The release rate is governed by Higuchi equation.7 The release in such system is proportional to square root of time and release is available until approximately 60% of the loaded drug is released from the matrix.8 Thereafter release is related exponentially to time, exhibiting first order release. With perception to above objective, it is necessary to modify current solid dosage forms in to controlled transdermal drug delivery system. A first step in this process is to illustrate how formulation and process
variables could give drug release through skin. The aim of present investigation is to formulate and optimize the Atenolol matrix diffusion controlled transdermal drug delivery system. In the present investigation, the influence of various grades and concentration of polymers were studied. Study was carried out to formulate an elegant product exhibiting desired therapeutic performance, from a small and cute dosage form.
In order to achieve this goal, following criteria were set • The dosage form should remain intact for a period
of 24hr.
• Drug is delivered in a controlled manner.
• The size of dosage form should be small with a view to enhance convenience of patient as well as compliance to therapy.
• Plasma concentration should achieve within short period of time.
A. Preparation of polymeric matrix device
Matrix – type transdermal patches containing Atenolol were prepared using different polymers (Table. 1). The polymers were weighed in requisites ratios keeping the total polymer weight 800 mg, and dissolved in a given solvent. Di-n-butyl Phalate (30% w/w of polymer composition) were used as a plasticizer. Atenolol (533.33mg) was added and mixed using a mechanical stirrer. The uniform dispersion of polymeric solution of drug (10 ml) was poured on the mercury pool. Solvent was evaporated at room temperature, and matrices were carefully lifted. Laminates were punched out to have a 3.14 cm2area. Laminates were affixed on polyethylene coated aluminum foil backing. The release face of medicated laminate was covered with peelable silicone liner. The devices were stored in desiccators, at room temperature until further used.9
Table 1: Composition of prepared films
Formulation
code Polymers
Plasticizers (30% w/w of
polymer composition) Solvent
F1 EVA (VA 40%) copolymer -- 2ml acetic acid and 10 ml toluene
F2 ERS100 DBP Methanol
F3 ERL100: ERS100(1:1) DBP Methanol
F4 EC:PVP (2:3) DBP Methanol
F5 ERL 100:HPMC (2:3) DBP Methanol
B. Preparation of matrix moderated Transdermal drug delivery device of Atenolol
Matrix – type transdermal patches containing Atenolol were prepared using different ratios of polymer (Table.2). The polymer were weighed in requisite ratios and dissolved in 10 ml mixture of acetone: methanol (7:3). Atenolol (15 mg/cm2) and plasticizer Di-butyl phalate (30 %w/w of polymer weight) was added and mixed slowly with a mechanical stirrer. The uniform dispersion of polymeric
Table 2: Composition of various formulations of
Atenolol
Formulation code
Polymeric blend (10%w/v)
Ratio of polymer
Amount of drugs
( mg/cm2)
C1 ERL 100 : ERS
100 1:4 15
C2 ERL 100 : ERS
100 2:3 15
C3 ERL 100 : ERS
100 1:1 15
C4 ERL 100 : ERS
100 3:2 15
C5 ERL 100 : ERS
100 4:1 15
Table 3: Composition of prepared adhesive matrix films
of Atenolol
Formulation code
Adhesive (mg/cm2)
Atenolol (mg/cm2)
F1 15 5
F2 15 10
F3 15 15
C. Preparation of adhesive matrix device of Atenolol
The transdermal therapeutic system comprised a backing membrane, an adhesive layer containing drug and a release liner. Adhesive matrix – type transdermal patches containing Atenolol were prepared using different ratios of drug to adhesive (Table.3). Atenolol was accurately weighed and dissolved in very small quantity of alcohol. This solution was mixed with natural rubber adhesive (Readymade received – Beta surgical, Rajkot). The uniform dispersion of drug and adhesive was spreaded on a drug impermeable polyethylene coated aluminum foil (5x3.5 cm2) with the help of TLC kit spreader to form a thin medicated adhesive layer and dried at room temperature. After 24h, the films were cut into a 3.14 cm2 area and covered with pellabel silicone protective liner. Dosage forms were kept in desiccators until further used.
Physiochemical evaluation of polymeric matrix device Thickness
The thickness of the laminate was assessed at six different points of the prepared medicated film using thickness gauge micrometer (0.001mm, Mitutoyo, Japan). For each formulation, three randomly selected laminated were used.
Weight variation
The weight variation for each batch was determined using Sartorius electronic balance (Model CP-224 S), Shimadzu, Japan. Six patch from each batch were weighed individually and the average weight was calculated.
Drug content
Drug content of the matrices was carried out to ascertain that the requisite amount of drug is loaded in the formulation. The prepared film formulations were dissolved in 10 ml mixture of Acetone: Methanol (7:3) in a 100 ml volumetric flask and the volume was adjusted up to 100 ml using Acetone: Methanol (7:3). The amount of drug present was determined by measuring the absorbance spectrophotometrically at 282.0 nm using mixture of Acetone: Methanol (7:3) as a blank.
Flatness
The flatness was measured manually for the prepared films. Longitudinal strips were cut out from each film, one from the center and two from either side. The length of each strip was measured and the variation in the length because of non uniformity in flatness was measured by determining percentage constriction, considering 0% constriction is equivalent to 100 % flatness.5 Flatness was determined using below given formula:
% Constriction = [(l1 – l2)/ l2] * 100
Where, l1 = Initial length of each strip l2 = Final length of each strip
The flatness for Diltiazem matrices was measured in triplicate and average reading was considered.
Folding endurance
The folding endurance was measured manually for the prepared films. The folding endurance of the films was determined by repeatedly folding a strip measuring 2x2 cm size at same place till it break.10 The number of times the film could be folded at the same place without breaking gave the value of folding endurance.
Moisture content (Loss on drying)11
The inherent moisture presents in material may influence the stability of dosage forms, especially if it contains a drug that is sensitive to water. The absolute method is employed to determine the moisture content which gives a weight loss registered during process.
Three patches from each batch were weighed individually and the average weight was calculated. This weight was considered as an Initial weight. Then all the patches were kept in a desiccators containing activated Silica at normal room temperature for 24hr. The final weight was noted when there was no further change in the weight of individual patch. The percentage moisture absorption was calculated as a difference between initial and final weight with respect to final weight.
% Moisture content = [(Initial weight – Final weight)/ Final weight]* 100
Moisture absorption12
Three patches from each batch were weighed individually and the average weight was calculated. This weight was considered as an Initial weight. Then all the patches were kept in a desiccators containing 200 ml saturated solution of Sodium chloride (Relative humidity of 75%) at normal room temperature for 72h. The final weight was noted when there was no further change in the weight of individual patch. The percentage moisture absorption was calculated as a difference between final and initial weight with respect to initial weight. The % Moisture absorption was determined using below formula:
% Moisture absorption = [(Final weight – Initial weight)/ Initial weight]* 100
Water vapor transmission rate (%WVTR)13, 14
For this study vials of equal diameters were used as transmission cells. These cells were washed thoroughly and dried in oven, about 1 gm of activated silica was taken in cells and the polymeric films were fixed over the brim with the help of an adhesive. The cells were weighed accurately and initial weight was recorded, and then kept in a closed desiccators containing 200 ml saturated solution of potassium chloride. The cells were taken out and weighed after 6, 12, 24, 36, 48 and 72 hr of storage. The amount and rate of water vapor transmitted was calculated by the difference in weight using below given formula:
% Water vapor transmission rate = (Final weight- Initial weight)/ time * Area
In Vitro Diffusion Study of Atenolol Loaded Matrix
Diffusional Films
The release rate determination is one of the most important study to be conducted for all controlled release delivery systems. The diffusion studies of patches are very crucial, because one needs to maintain the drug concentration on the surface of stratum corneum consistently and substantially greater than the drug concentration in the body to achieve a constant rate of drug permeation.15
An in vitro diffusion study of Atenolol from various matrices was studied using modified Keshary-Chien diffusion cell. The effective permeation area of the diffusion cell and receptor cell volume was 3.14cm2 and 40 ml, respectively. The temperature was maintained at 37 ±0.5°C. The receptor compartment contained 40 ml of 0.01N HCl stirred by magnetic stirrer. Samples (2 ml) were withdrawn and replaced with the same volume of fresh receptor solution, through the sampling port of the diffusion cell at different time intervals. The absorbance of the withdrawn samples were measured using UV VIS spectrophotometer at 273.5 nm using 0.01N HCl as a blank. The experiments were done in triplicate. Amount of drug released per square centimeter of patch were plotted against function of square root of time for different formulations. The release rate Q/√T was determined by simple regression analysis of steady state data.
Stability study of matrix diffusion controlled device
The stability of pharmaceutical p r e p a r a t i o n s h o u l d b e e v a l u a t e d b y a c c e l e r a t e d stability studies. The objective of accelerated stability studies is to predict the shelf life of a product by accelerating the rate of decomposition, preferably by increasing the temperature. The optimized formulation of Atenolol matrix patch was subjected for the stability study. The accelerated stability study was carried out according to ICH guideline by storing the samples at 25°C / 60% RH, 30°C/ 65% RH and 40°C/ 75% RH for 90 days in a stability chamber (Thermo Lab., Mumbai, India). These samples were analyzed by UV Spectrophotometer method and checked for changes in physical appearance and drug content at an interval of 15 days.
RESULT AND DISCUSSION A) Polymeric Matrix Device
The present investigation deals with the development of Atenolol loaded polymeric and adhesive matrix using different polymers. The preliminary screening was carried out for the selection of best polymer. A diffusion mediated matrix controlled transdermal drug delivery system for Atenolol was successfully prepared using different polymers using mercury subtract method and all matrices were evaluated.
Thickness
These results revealed that thickness was found to increase as hydrophobic portion of polymer increases. The results of thickness measurements also indicate uniform distribution of the drug and polymer over the mercury surface. The rank order of thickness of Atenolol loaded polymeric matrices was EVA (40% VA) copolymer > ERS 100 > ERL100:ERS100 (1:1)> EC: PVP (2:3) >ERL 100: HPMC (2:3).
Weight variation
The weight of 3.14 cm2film ranged from 50.30
± 0.100 mg to 58 ± 0.500 mg. The weight of the patches
was found to be uniform among different batches. The average p e r c e n t a g e d e v i a t i o n o f a l l formulations was found to be within the limit, and hence all the formulation passed the test for weight variation as per official requirements. All the formulations showed acceptable pharmaco-technincal properties. From the results obtained, it was clear that there was proper distribution of Atenolol in the film formulations. Hence it was concluded that drug was uniformly distributed in all the formulation, with small deviation.
Flatness
The results of the flatness study showed that none of the formulations had the differences in the strip length before and after t h e i r cuts. It indicates
100% flatness observed in the formulated patches. Thus,
Folding endurance
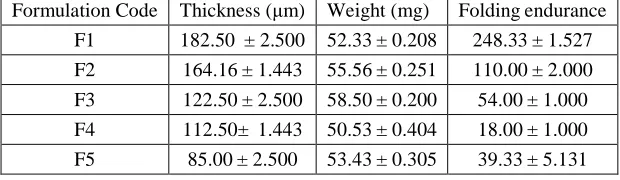
Here formulation F1, F2 and F3 shows good folding endurance as compare to formulation F4 and F5.
Moisture content (Loss on drying)
The result revealed that the moisture content was found to increase with increasing concentration of hydrophilic polymers. The small moisture content in the formulations helps them to maintain texture.
The rank order of % moisture content of Atenolol loaded polymeric matrices was EVA (VA 40%) copolymer < ERS 100 < ERL100:ERS100 (1:1) < EC: PVP (2:3)>ERL 100: HPMC (2:3)
Moisture absorption
The moisture absorption in all the formulations was found to be low and ranged from 0.7400 ± 0.0360 to
5.8734 ± 0.1706. The results revealed that the moisture absorption was found to increase with increasing concentration of hydrophilic polymers. The rank order of % moisture absorption for Atenolol loaded matrices was EVA (VA 40%) copolymer < ERS 100 < ERL100:ERS100 (1:1) < EC: PVP (2:3) <ERL100: HPMC (2:3)
Water vapor transmission rate (%WVTR)
Atenolol films containing ERL100: HPMC showed higher % WVTR as compared to other polymers. This may be due to the hydrophilic nature of ERL 100 and HPMC. Formulation F1 and F2 showed less % WVTR as compared to F4 and F5. The rank order of % water vapor transmission rate for Atenolol loaded polymeric matrices was EVA (VA 40%) copolymer < ERS 100 < ERL100:ERS100 (1:1) < EC: PVP (2:3) <ERL100: HPMC (2:3)
Table 4: Results of physiochemical parameters
Formulation Code Thickness (µm) Weight (mg) Folding endurance
F1 182.50 ± 2.500 52.33 ± 0.208 248.33 ± 1.527
F2 164.16 ± 1.443 55.56 ± 0.251 110.00 ± 2.000
F3 122.50 ± 2.500 58.50 ± 0.200 54.00 ± 1.000
F4 112.50± 1.443 50.53 ± 0.404 18.00 ± 1.000
F5 85.00 ± 2.500 53.43 ± 0.305 39.33 ± 5.131
In Vitro Diffusion Study:
The results of diffusion study of Atenolol released from polymeric matrix, formulated using various polymers are presented in Table 5. The release rate
Q/√T (µg/cm2 √hr) was determined by simple
regression analysis of steady state data. The release of Atenolol from all the matrices followed square root law. The rank order of release was EVA (VA 40%) copolymer < ERS 100 < ERL100:ERS100 (1:1) < EC: PVP (2:3) < ERL100: HPMC (2:3)
Table 5: In vitro diffusion profiles of Atenolol from different polymer matrix
Time (hr ½)
Cumulative amount of drug release from device (µg/cm2) Formulation code
F1 F2 F3 F4 F5
0.707 473.34 ± 25.67 726.48 ± 29.40 1060.46 ± 35.78 1120.23 ± 39.56 1210.39 ± 42.56 1 571.56 ± 25.46 990.49 ± 35.78 1370.89 ± 55.39 1459.23 ± 55.29 1678.34 ± 60.43 1.414 731.22 ± 31.56 1320.40 ± 51.34 1870.45 ± 60.99 1953.34 ± 61.64 2169.90 ± 71.34 1.732 890.56 ± 35.67 1570.30 ± 55.78 2241.36 ± 71.64 2321.90 ± 71.56 2541.20 ± 80.43 2 1025.89± 40.79 1810.37 ± 59.88 2564.90 ± 79.45 2659.86 ± 79.40 2958.68 ± 100.50 2.236 1136.30± 64.99 1950.34 ± 64.99 2863.94 ± 90.57 3045.75 ± 80.38 3245.46 ± 106.34 2.449 1200.13 ± 51.34 2160.80 ± 70.01 3090.34 ± 101.45 3320.00 ± 48.67 3458.95 ± 78.46
Q/√T (µg/cm2 √hr) 434.45 810.72 1220.90 1265.00 1337.80
R 0.9958 0.9989 0.9917 0.9963 0.9936
In vitro release kinetic
The release data was fitted into various mathematical models using software to know which mathematical model will best fit to obtained release profiles. The obtained R values for various models are given in Table.6.
Table 6: Data of various parameters of model fitting of formulations
FormulationZero orderFirst order Higuchi’s
F1
0.9804
0.9470
0.9962
F2
0.9836
0.9440
0.9985
F3
0.9836
0.9404
0.9998
F4
0.9935
0.9606
0.9968
The in vitro release profile could be best expressed by Higuchi’s equation for the permeation of drug from the matrix. Initial “burst release” was observed in patches F4 and F5. This may be because of the much higher % of hydrophilic polymer. This hydrophilic components allow faster release of drug exhibiting small “time lag” to establish a concentration profile in the patches resulting in a “burst effect” in diffusion studies. Formulation F1 and F2 gave the slowest release.
Stability study of matrix diffusion controlled device
Diffusion study was carried out and it was observed that formulation stored at 40°C exhibited higher Q/√T release rate as compared to those stored at
25°C and 30° C. The release rate at 30°C was altered but it was in order. The product stored at 25°C exhibited no change in release rate. The degradation was higher at an elevated temperature. The first order rate constant of
degradation for room temperature was 1.280 x 10⁻³
w e e k -1
. The self life calculated was 8 2 w e e k . Results o f s t a b i l i t y s t u d y i n d i c a t e d s t o r a g e o f p r o d u c t a t r o o m temperature.
B) Matrix Moderated Transdermal Drug Delivery Device of Atenolol
Thickness
These results revealed that thickness was found to increase as hydrophilic portion of polymer increased. The results of thickness measurement also indicated uniform distribution of the drug and polymer over the mercury surface.
Weight variation
The weight of 3.14 cm2 film ranged from 0.187 ± 0.002 gm to 0.215 ± 0.01gm. The weight of the patches was found to be uniform among different batches.
Drug content
The films were found to contain 98.22% - 101.21 % of the labeled amount of Atenolol
indicating uniformity of drug content. The average percentage deviation of all formulations was found to be within the limit, and hence all the formulation passed the test for content uniformity as per official requirements.
Flatness
The results of the flatness study showed that none of the formulations had the differences in the strip length before and after their cuts. It indicates 100% flatness observed in the formulated patches. Thus, no amount of constriction was observed in the film of any formulation and it indicates smooth flat surface of the patches and thus they could maintain a smooth surface when applied on to the skin.
Folding endurance
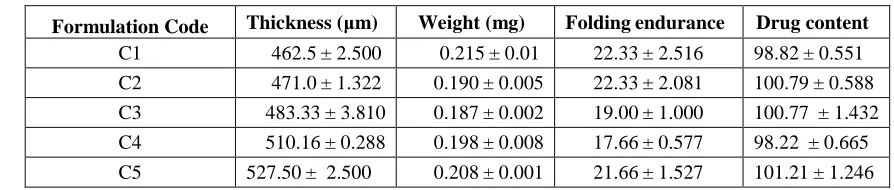
Results of folding endurance are given in Table.7. Here formulation C1 and formulation C2 showed good folding endurance as compare to formulation C3 and C4.
Moisture content (Loss on drying)
The moisture content in all the formulations was found to be low and ranged from 0.8023 ± 0.0525 to 4.6970 ± 0.1006 %. The result revealed that the moisture content was found to decrease with increasing concentration of hydrophilic polymer ERL 100.
Moisture absorption
The moisture absorption in all the formulations was found to be low and ranged from 3.049 ± 0.0669 to 7.833 ± 0.0550 %. The result revealed that the moisture absorption was found to increases with increasing concentration of hydrophilic portion of polymer. Rank order of moisture absorption for the formulation was C5 > C4 > C3 > C2 > C1.
Water vapor transmission rate (%WVTR)
The % water vapor transmission rate of each film was determined and rank order of water vapor transmission for Atenolol containing matrices was C1 > C2 > C3 > C4 > C5. The water vapor transmission influences the permeation of the drug from the barriers.
Table 7: Results of physiochemical parameters
Formulation Code Thickness (µm) Weight (mg) Folding endurance Drug content
C1 462.5 ± 2.500 0.215 ± 0.01 22.33 ± 2.516 98.82 ± 0.551
C2 471.0 ± 1.322 0.190 ± 0.005 22.33 ± 2.081 100.79 ± 0.588
C3 483.33 ± 3.810 0.187 ± 0.002 19.00 ± 1.000 100.77 ± 1.432
C4 510.16 ± 0.288 0.198 ± 0.008 17.66 ± 0.577 98.22 ± 0.665
C5 527.50 ± 2.500 0.208 ± 0.001 21.66 ± 1.527 101.21 ± 1.246
In vitro diffusion profile
Release rates Q/√T were derived from simple regression analysis of steady state diffusion data. The
Table 8: In vitro diffusion profiles of Atenolol from blend of polymer matrices
Time (hr ½)
Cumulative amount of drug release from device (µg/cm2) Formulation code
C1 C2 C3 C4 C5
0.707 731.22 ± 29.47 884.20 ± 35.39 1060.46 ± 39.67 1141.34 ± 45.32 1180.11 ± 50.29
1 990.49 ± 35.34 1121.24 ± 41.56 1370.89 ± 45.37 1492.39 ± 42.56 1631.15 ± 62.56
1.414 1350.92 ± 41.23 1543.98 ± 46.89 1870.45 ± 52.34 2035.30 ± 28.46 2232.24 ± 72.42
1.732 1579.46 ± 55.45 1833.50 ± 55.67 2241.36 ± 58.39 2531.59 ± 65.34 2604.56 ± 78.56
2 1920.59 ± 67.89 2142.30 ± 60.93 2564.90 ± 70.30 2842.50 ± 69.80 2901.32 ± 67.38
2.236 2064.68 ± 69.50 2371.10 ± 71.45 2863.94 ± 35.67 3051.49 ± 75.29 3160.45 ± 97.40
2.449 2353.90 ± 71.85 2664.20 ± 78.56 3090.34 ± 89.40 3301.11 ± 90.40 3581.54 ± 105.37
Q/√T
(µg/cm2√hr) 909.56 1014.1 1220.9 1258.5 1309.1
Correlation
coefficient 0.9949 0.9969 0.9917 0.9962 0.9940
Release rate Q/√T increased with increasing concentration of Atenolol in ERL100: ERS100 matrix. The rank order of Q/√T release rate for formulation was
C1 < C2 < C3 < C4 < C5. The formulations C5
exhibited the greatest (1309.1µg/cm2h) release values,
which were significantly different, compared to the
lowest values in the formulation C1 (909.56 µg/cm2 h).
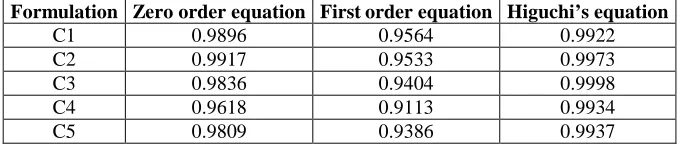
Table 9: Data of various parameters of model fitting of formulations Containing Atenolol
Formulation Zero order equation First order equation Higuchi’s equation
C1 0.9896 0.9564 0.9922
C2 0.9917 0.9533 0.9973
C3 0.9836 0.9404 0.9998
C4 0.9618 0.9113 0.9934
C5 0.9809 0.9386 0.9937
In our experiment, the in vitro permeation profiles of all formulations could be best expressed by
Higuchi’s equation (R2 = 0.9922 to 0.9998) for the
permeation of drug from a polymeric matrix. Various parameters of diffusion kinetics of Diltiazem released
from device across excised human live skin are presented in Table 10. The parameters listed in this table are useful for biopharmaceutical and pharmacokinetic of the matrix diffusional system evaluated.
Table 10: Parameters of diffusion kinetic of Atenolol from Atenolol matrix diffusion controlled TDDS
Sr. No. Parameters Value
1 Skin flux Jss 68.73 µg/cm2 hr
2 Time lag (tL) 1.06 hr 3 Skin thickness (µ m) 140 µm
4 Diffusion coefficient 3.081 x 10⁻⁵ cm2/sec
5 Solubility of drug in skin
(Cs) 31.230 mg/cm3
Formulation of final patch
As per British J. clinical Pharm.14 steady state plasma concentration built up after administration of 25mg, 50mg and 100 mg Atenolol orally in human volunteers are recommended to develop peak plasma concentration of 126 ng/ml, 219 ng/ml and 390 ng/ml respectively to control varied dose dependent physiological cardiac complains. Transdermal controlled drug delivery system is recommended as an alternative
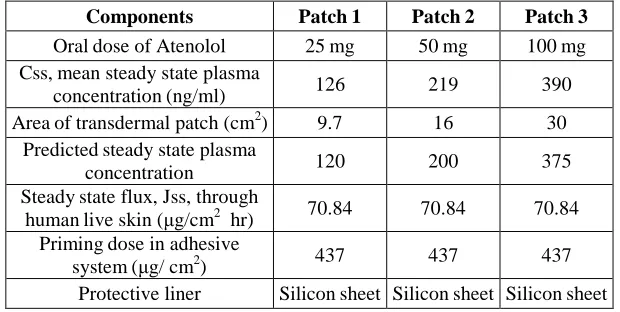
Table 11: composition of final Atenolol matrix moderated transdermal devices
Components Patch 1 Patch 2 Patch 3
Oral dose of Atenolol 25 mg 50 mg 100 mg Css, mean steady state plasma
concentration (ng/ml) 126 219 390 Area of transdermal patch (cm2) 9.7 16 30
Predicted steady state plasma
concentration 120 200 375
Steady state flux, Jss, through
human live skin (µg/cm2 hr) 70.84 70.84 70.84 Priming dose in adhesive
system (µg/ cm2) 437 437 437 Protective liner Silicon sheet Silicon sheet Silicon sheet
Area of transdermal drug delivery device is directly related to mean steady state plasma concentration that b u i l d s u p a f t e r a d m i n i s t r a t i o n o f d e v i c e . The above formulations are 24 hour (once a day) devices. The specific size matrix formulation having area 9.7, 16 and 30 cm2 are affixed over polyethylene coated aluminum foil backing. The formulations are to be provided with priming dose incorporated in natural rubber adhesive as follow. The amount of Atenolol retained in skin need to be incorporated in contact adhesive to serve as prompt dose. For preparation of above devices containing peripheral adhesive system a 0.583 % w/v Atenolol in natural rubber adhesive solution is to be layered surrounding 4 mm rim of the delivery device, providing 437 µg Atenolol per cm2area of the adhesive system giving a 10 µ m thick adhesive layer. The finally fabricated devices are to be provided with silicone sheet as a protective liner and to be stored at room temperature.
C) Adhesive Matrix Device of Atenolol Thickness
The results of thickness measurements are given in Table 12. The results indicate that there was no much difference in the thickness within the formulations. Thickness in the different formulations was in the range of 122.5 ± 2.5 µm to 141.6 ± 2.886
µm. The results indicated uniform distribution of the adhesive.
Weight variation
In a weight variation test, the pharmacopoeial limit for the percentage deviation of all the f i l m s o f l e s s t h a n mg i s ± 1 0 %. The a v e r a g e p e r c e n t a g e d e v i a t i o n o f a l l formulations was found to be within the limit, and hence all the formulation passed the test for weight variation as per official requirements. All the formulations showed acceptable pharmaco-technincal properties.
Drug content
The films were found to contain 96.02 % - 98.78 % of the labeled amount of Atenolol indicating uniformity of drug c o n t e n t . The average percentage deviation of all formulations was found to be within the limit, and hence all the formulation passed the test
for content uniformity as per official requirements. All the formulations showed acceptable pharmaco-technincal properties. From the results obtained, it was clear that there was proper distribution of Atenolol in the film formulations. Hence it was concluded that drug was uniformly distributed in all the formulation.
Moisture content (Loss on drying)
The moisture content in all the formulations was found to be low. The result revealed that the moisture content was found to increases with increasing concentration of Atenolol. The % Moisture content of each device was determined, the rank order of moisture absorption was F1 < F2< F3.
The result revealed that the moisture was present in the formulation due to presence of adhesive material. Small moisture content in the formulations helps to maintain the texture of the formulation also prevents the dosage form being brittle.
Moisture absorption
The result revealed that the moisture absorption was found to increase with increasing concentration of Atenolol. The % Moisture absorption of each film was determined, the rank order of moisture absorption was F3 > F2 > F1.
Table 12: Results of physiochemical parameters
Formulation Code
Thickness (µm)
Weight variation
(mg)
Drug content
F1 122.5 ±
2.500 45.88 ± 0.650
98.78 ± 0.589
F2 132.5 ±
2.500 59.69 ± 0.641
96.56 ± 0.587
F3 141.6 ±
2.886 75.42 ± 0.919
96.02 ± 0.761 In vitro drug diffusion study
(1469.90µg/cm2√h) release rate, which was significantly different, compared to the lowest value in the formulation
F1 (512.65 µg/cm2√h). The formulation F2 exhibited
995.25 µg/cm2√h release rate.
Table 13: Data of various parameters of model fitting for
Atenolol adhesive matrix formulations
Formulation Zero order equation
First order equation
Higuchi’s equation
F1 0.9785 0.9250 0.9987
F2 0.9850 0.9377 0.9969
F3 0.9698 0.9195 0.9959
The in vitro release profile could be best expressed by Highuchi’s equation for the permeation of drug from the matrix.
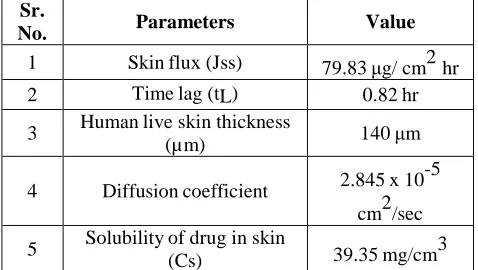
Various parameters of diffusion kinetics of Atenolol released from device across human live skin are presented in Table 14.
Table 14: Parameters of diffusion kinetics of Atenolol
from drug adhesive matrix patch through human live skin
Sr.
No. Parameters Value
1 Skin flux (Jss) 79.83 µg/ cm2 hr
2 Time lag (tL) 0.82 hr
3 Human live skin thickness
(µ m) 140 µm
4 Diffusion coefficient 2.845 x 10 -5
cm2/sec
5 Solubility of drug in skin
(Cs) 39.35 mg/cm3
Adhesive matrix device containing Atenolol
provided 79.83 µg/ cm2 hr skin flux. The time lag (tL)
for devices is 0.82 hr. The diffusion coefficient, D of
Atenolol was determined using D = h2/6 tL
r e l a t i o n s h i p , where skin thickness h was 1 4 0 x 1 0 -4
cm. The amount of Atenolol retained by skin area used for permeation was calculated by dividing flux with gradient of diffusivity and it was found to be
39.35 mg/cm3 of skin.
Formulation of final patch
As per British J. of clinical Pharm.7 steady state plasma concentration built up after administration of 25mg, 50mg and 100 mg Atenolol orally in human volunteers are recommended to develop peak plasma concentration of 126 ng/ml, 219 ng/ml and 390 ng/ml respectively to control varied dose dependent physiological cardiac complains in the human.
Transdermal controlled drug delivery system compared to conventional administration is recommended as a safe alternative with better compliance to therapy by the patient, with reduced frequency of administration, leading to better disease management. Following t h r e e p a t c h e s o f d i f f e r e n t c o n f i g u r a t i o n w e r e formulated as an alternative to above oral administration, to meet requirement of desired steady state plasma concentration for varied cardiac condition. Table 15 shows the parameters of the formulations.
Table 15: Parameters of final Atenolol adhesive matrix
transdermal device
Components Patch 1 Patch 2 Patch 3
Oral dose of Atenolol 25 mg 50 mg 100 mg Css, mean steady state
plasma concentration
(ng/ml) 126 219 390
Area of transdermal
patch(cm2) 8.5 14.2 26.6 Predicted steady state
plasma concentration 120 200 375 Steady state flux, Jss,
through human live skin
(µg/cm2 hr) 79.83 79.83 79.83
Protective liner Silicon sheet
Silicon sheet
Silicon sheet
The above formulations are 24 hour (once a day) devices. The drug loaded adhesive matrix was layered on specific dimension of polyethylene coated aluminum foil backing. For the preparation of final adhesive matrix diffusion controlled drug delivery device peripheral plain adhesive was used for good adherence of device on the skin. The release face was covered with peelable protective liner.
Stability study
The stability study was carried out at 25°C / 60 % RH, 30°C/ 65 % RH and 40°C/ 75 % RH for 90 days. Diffusion study was carried out and it was observed that formulation stored at 40°C exhibited higher Q/√T release rate as compared to those stored at 25° C and 30° C. The initial release of drug was higher due to decreased viscosity at an elevated temperature. Release rate at 30°C was altered but it was in order. The product stored at 25° C exhibited no change in release rate. The degradation was higher at an elevated temperature. The first order rate constant of degradation for room
temperature was 1.4 x 10⁻³ week-1. The self life calculated was 75 week.
CONCLUSIONS:
successfully. Among different polymers evaluated
ERL100:ERS100 in ratio of 1:1 containing 15 mg/cm2 of Atenolol provided a medicated matrix, which was stable, non-irritant and non-sensitizing to skin and was safe. It complied with official and non-official p h a r m a c o t e c h n i c a l specification. The matrix device evaluated for Atenolol release in vitro into infinite sink and across human live skin, enabled to provide adequate rate of Atenolol, meeting requisite pharmacokinetic requirement of steady state plasma concentration for 24 hours, giving once a day drug delivery system. Alternative to three oral conventional doses (25mg, 50mg and 100mg) devices
were provided by fabricating 9.7 cm2, 16 cm2 and 30
cm2 matrix diffusional controlled transdermal drug delivery system of Atenolol respectively, as once a day drug delivery systems. In vitro evaluation o f a d h e s i v e m a t r i x d i f f u s i o n a l controlled d r u g d e l i v e r y d e v i c e f o r Atenolol release from device across human live skin provided zero order release rate 79.83
µg/cm2hr. The flux was adequate to meet pharmacokinetic requirement of steady state plasma concentration for 24 hours, giving once a day drug delivery system of Atenolol. Alternatives to three oral conventional doses (25mg, 50mg and 100mg) devices
were provided, by fabricating 8.5cm2, 14.2cm2 and
26.6cm2 adhesive matrix diffusional transdermal drug delivery system of Atenolol, respectively as once a day drug delivery system.
REFERENCES:
1. Chien Y.W., In; C h i e n Y . W ., E d s . Transdermal controlled systemic medication, 31, Marcel Dekker Inc., N. Y., U.S.A., 1987, 14. 2. Shaw J.E., Chandrasekaran S.K., Campbell J.,
Invest. Dermatol., 67, 1976, 677.
3. Colins V.R., Dowse G.K., Cabealawa S., Int. J. Epedemiol, 25, 1996, 59.
4. Wan S.H., Koda R.T., Maronde R.F., Pharmacology of Atenolol and effect of renal
disease, Br. Pharm. Soc., 2009, 570.
5. Amery A., Lijnene P., Atenolol and plasma rennin concentration in hypertensive patients, Postgrad. Med. J., 53(3), 1977, 116-119.
6. Pfister W.R., Silicone adhesive for transdermal drug delivery system, Drug cosmetic Ind., 143, 1988, 44-52.
7. Higuchi W.I., Analysis of data on the medicament release from ointment, J. Pharm. Sci., 51, 1962, 802-804.
8. Higuchi T., Rate of release of medicament from ointment bases containing drugs in suspension, J. Pharm. Sci., 50, 1961, 874-875.
9. Agrawal S.S., Munjal P., Permeation studies of Atenolol and Metoprolol Tartrate from three different polymer matrices for transdermal delivery, Indian J. Pharm. Sci., 2007, 535.
10. Khanna R., Agrawal S.P., Ahuja A., Preparation and evaluation of mucoadhesive buccal films of Clotrimezole for oral candida infection., Indian J. Pharm. Sci., 56,1997, 299-305.
11. Gupta R., Mukhrjee B., Development and in vitro evaluation of Diltiazem Hydrochloride transdermal patches based on povidione- ethyl cellulose matrices., Drug Dev. Ind. Pharm., 29, 2003, 1-7.
12. Baichwal R.W., Advances in drug delivery systems. Bombay: MSR foundation, 1983, 136-147.
13. Dang P.M., Manavi F.V., Gadag A.P., Mastiholimath V.S., Jagdeesh T., Formulation of transdermal drug delivery device of Ketotifen Fumarate, Ind. J. Pharm. Sci., 65(3), 2003, 239-243.
14. Raghsvendra K., Doddayya H., Marihasl S.C., Patil C.C., Habbu P.V., Comparative evaluation of polymeric films for transdermal application. The Easterm Pharmacist., 43 (516), 2000, 109-111.
15. Sood A., Panchangula R., Role of dissoliution studies in controlled release drug Delivery system, STP Pharm. Sci., 9, 1999, 157-168.
How to cite this article:
B. Venkateswara Reddy*, S. Satyanandam: Preparation and Characterization of Polymeric and Adhesive Matrix Diffusional Transdermal Drug delivery device of Atenolol, 5(2): 1706-15. (2014)