ISSN 2324-805X E-ISSN 2324-8068 Published by Redfame Publishing URL: http://jets.redfame.com
Self-Efficacy for Science Teaching Scale Development: Construct
Validation with Elementary School Teachers
Selami Yangin1, Sabri Sidekli2
1Recep Tayyip Erdoğan University, Turkey 2Muğla Sıtkı Koçman University, Turkey
Correspondence: Sabri Sidekli, Muğla Sıtkı Koçman University, Turkey.
Received: June 24, 2016 Accepted: July 12, 2016 Online Published: August 5, 2016 doi:10.11114/jets.v4i10.1694 URL: http://dx.doi.org/10.11114/jets.v4i10.1694
Abstract
The measurement of teacher self-efficacy has a history of more than 30 years. The purpose of this research is to evaluate the development and validation of a new scale to measure the science teaching self-efficacy of elementary school teachers. Therefore, a scale has been created to measure elementary teachers’ science teaching self-efficacy and the evidence for validity of the scale is presented in this study. Data collection for this study occurred during 2014-2015 academic year. Measurement tool applied to 135 science teachers in elementary school. All of these participants completed the Self-Efficacy for Science Teaching Scale (SSTS) in January 2015 and again in June 2015. “The Self-Efficacy for Science Teaching Scale (SSTS)” was developed and has undergone revisions to the original version through processes defined in this study. The SSTS is comprised of three parts: “Science Teaching Self-Efficacy (STSE), Efficacy for Understanding Science Content (EUSC) and Efficacy for Teaching Science Content (ETSC)”. Reliability for each part of the SSTS was found to be acceptable for both versions of the scale. Evidence of reliability and validity were collected to determine if the SSTS is an adequate scale to measure science teaching self-efficacy of teachers. Findings indicate that reliability and validity of the scale is adequate. Finally, theoretical implications for elementary school teachers’ science teaching self-efficacy are discussed.
Keywords: science teaching, self-efficacy, elementary school, science teachers, scale development
1. Introduction
The traditional or constructivist conceptions of teaching and learning (Chan & Elliott, 2004), referring to the beliefs held by teachers regarding their preferred ways of teaching and learning, are associated with two models: traditional and constructivist. Beliefs play a critical role in influencing the instructional practices of teachers (Pajares, 1992). Teachers’ beliefs about how science should be taught and how they are actually teaching science may not be aligned, especially if teachers believe that external or contextual factors beyond their control are impacting their ability to teach science (Lumpe, Haney, & Czerniak, 2000; Haney, Lumpe, Czerniak, & Egan, 2002). A strong sense of teaching efficacy could influence effective teaching and student achievement in the field of education (Henson, Kogan, & Vacha-Haase, 2001).
1.1 Science Teaching Self-efficacy for Teachers
A central issue in science education is preparing elementary school teachers to successfully teach science in their classrooms. However, to be effective one must not only have high self-efficacy about the content, but also high self-efficacy on how to use the tools and skills to apply the knowledge of the content. In this context, the idea of self-efficacy stems from Bandura’s social cognitive theory. Bandura described two components of self-efficacy: personal self-efficacy and outcome expectancy. Personal self-efficacy is the belief in an individual’s ability to perform the behavior and outcome expectancy is the belief that the behavior will lead to desirable outcomes. Self-efficacy is commonly understood as domain- and context-specific; an individual can have different levels of self-efficacy beliefs in different domains or for particular situations of functioning. Teachers’ self-efficacy beliefs may vary from subject to subject, so that a teacher with high self-efficacy for teaching mathematics might not have the same high self-efficacy for science teaching (Bandura, 1977).
ability to influence student learning related to science. Like general teaching efficacy beliefs, this construct is composed of two specific types of beliefs: “Personal Science Teaching Efficacy” (PSTE) and “Science Teaching Outcome Expectancy” (STOE). PSTE refers to a teacher’s belief in his or her own ability to effectively teach science, while STOE reflects the extent of a teacher’s belief that students will learn science if provided with effective instruction by any teacher.
Several studies have directly focused on these four sources of efficacy as they relate to the development of teacher efficacy, while others have found additional factors influencing efficacy beliefs that are more indirectly related to these sources.
1.2 Measuring Teachers’ Science Teaching Self-efficacy
The measurement of teacher self-efficacy has a history of more than 40 years. Over the years, Rotter’s theory has laid the groundwork for many studies and scales, including the first measure of TSE in the 1970s (Tschannen-Moran & Woolfolk Hoy, 2001). The terms “teacher efficacy” were first used in two reports of RAND Corporation (Research ANd Development) evaluations of projects funded by the Elementary and Secondary Education Act (Berman, McLaughlin, Bass, Pauly, & Zellman, 1977). These two studies evaluated the concept of teacher efficacy by computing a total score for responses to two, 5-point Likert-type items: (a) When it comes right down to it, a teacher really can’t do much
because most of a student’s motivation and performance depends on his or her home environment and (b) If I try really hard, I can get through to even the most difficult or unmotivated students (Tschannen, Hoy, & Hoy, 1998; Woolfolk & Hoy, 1990).
It is unclear whether the RAND researchers intended to specifically measure teacher self-efficacy using those two items or whether the inclusion of these items was incidental. These two items sparked great interest in educational research because teacher efficacy had never been examined before. Attention became focused on the use of self-efficacy as a predictive factor related to student academic achievement (Tschannen & Hoy, 2001).
Since its introduction by Riggs and Enochs (1990), the construct of science teaching efficacy beliefs has developed into a popular area of research in science education, particularly in examining the beliefs of preservice elementary teachers. The number of studies focusing on science teaching self-efficacy from the past year and a half alone demonstrates the popularity of this topic (e.g. Batiza, Gruhl, Hagedorn, Zhang, Herman, & Nelson, 2011; Bayraktar, 2011; Bursal, 2010; Buss, 2010; Cantrell, Cantrell, & Patch, 2011; Cartwright & Smith, 2011; Deniz, Orgil, & Carroll, 2011; Gunning & Mensah, 2011; Hechter, 2011; Kazempour, 2011; Lakshmanan, Heath, Perlmutter, & Elder, 2011; McDonnough & Matkins, 2010; Rethlefsen & Park, 2011; Sackes, Hilson, Trundle, & Krissek, 2010; Swars & Dooley, 2010).
1.3 Validating of a Scale Development
Since this study concerns the validation of a new scale designed to measure the science teaching self-efficacy of elementary science teachers, some discussion on related literature is important. There are several facets of the knowledge base concerning scale construction and validation that must first be understood. First, to construct a new scale it is vital to understand the mechanism for the delivery of items and the items themselves. These skills are a delicate balance between psychometric understanding of the cognitive processes that one is attempting to capture through item creation and the construction of a scale in a way that captures measurable correlates to those internal processes. The understanding of a conceptual and theoretical framework is crucial to creating a psychologically based scale. Secondary to this is a deep understanding of the procedures that can be used to show evidence of reliability and validity. These evidences are based firmly in statistical procedures but cannot be conducted without first having a clear understanding of measurement tool construction and delivery. The careful consideration of methodology in which to compose a measurement tool leads one to consider the survey as a viable template. Survey research is a necessary and valuable method of collecting data in educational research (Ebel, 1980). Information obtained through survey methodology is used to draw conclusions and can help educational leaders make decisions. In an age of accountability, survey research has the ability to answer some of education’s most pressing questions.
A technically-adequate survey instrument must pass several rigorous tests to be considered useful for the purpose in which it was intended. Survey instruments must show evidence of validity, a property of the meaning of data obtained through a survey or test. Validity ensures that the interpretation of a survey outcome, or score, is accurate. It also ensures that the intended theoretical constructs are supported and that conclusions drawn from the survey are accurate and reliable.
1.4 Rationale and Purpose for This Study
teacher’s belief system surrounding science is complex (Ernest, 1989). Although several instruments have been used in an attempt to measure self-efficacy for teaching science, fail to use over-generalized statements out of context of the criteria task (Gibson & Dembo, 1984; Pajares, 1997). Other researchers have used locus of control instead of
self-efficacy constructs to measure self-efficacy, and this has not proven fruitful either (Henson, 2001). Another issue with current measures of teacher self-efficacy, including “The Teacher’s Sense of Efficacy Scale” (TSES), is the lack of specificity to a teacher’s grade level (elementary, middle, or high school). Because education is different at each of these grade levels, expectations of a classroom teacher and sub-tasks associated with teaching content are different. In an effort to measure context-specific self-efficacy, elementary education is the setting of this study. Elementary teachers are often expected to be able to expertly teach all subjects to their students, but this may not be how they view their abilities. The self-efficacy is context specific, teachers often have varied beliefs toward different aspects of teaching science. Some teachers feel highly efficacious in their knowledge of content but less efficacious in their ability to teach science concepts to students. This study considers the elementary science content and context with regard to teachers’ science teaching self-efficacy. The purpose of this study is to show evidence of reliability and validity for a new scale that measures the science teaching self-efficacy of elementary school teachers. The following research questions are of interest:
1. What is the reliability of the scale? 2. What is the structure of the scale?
3. What evidence exists regarding validity of the scale?
This study focused on determining the structure of a scale in an attempt to align that structure to Bandura’s theories of self-efficacy. This study also focused primarily on two types of reliability: test/retest reliability and internal consistency. Test/retest reliability implies that each time a participant completes a survey or test they should score approximately the same. Internal consistency implies that the questions intended to measure the same concept do so on a consistent basis and in a consistent way (Colosi, 1997). Subsequently, content validity and construct validity, specifically concurrent and criterion-related validity were of interest in this study.
In fact, the main aim of this study was to determine the structure of the measurement tool was prepared through literature (Aerni, 2008; Dembo & Gibson, 1985; Lardy, 2011; McGee, 2012; Riggs & Enochs, 1990). There exist only a few valid and reliable instruments for measuring teachers’ self-efficacy. The most widely used and accepted instrument for this purpose is the Teacher’s Sense of Efficacy Scale (TSES) (Tschannen & Hoy, 2001). In the pursuit of measuring content-specific self-efficacy, some researchers have created instruments to measure teacher self-efficacy in mathematics and science (Enochs, Smith, & Huinker, 2000; Riggs & Enochs, 1990). Other self-efficacy instruments that have been created since teacher self-efficacy began to be studied either failed to be accepted by the profession or failed to be valid over time (Tschannen, Hoy, & Hoy, 1998; Swackhamer, 2010). Therefore, a new scale has been created to measure elementary school teachers’ science teaching self-efficacy and the evidence for validity of the scale is presented in this study.
2.Methods
2.1 Participants
Data collection for this study occurred during 2014-2015 academic year. Measurement tool applied to 135 teachers (4. and 5. class) in twenty-nine elementary school in Rize city. Fifty-four of the participants were female (40.2%) and eighty-one were male (59.8%). Twenty-two (16.1%) of the participants have 1-3 years of professional experience. Thirty-one teachers (23.2%) have 4-7 years of professional experience. Thirty-nine teachers (28.6%) have 8-11 years of professional experience and fourty-three teachers (32.2%) have professional experience for more than 14 years and more. Twenty-six (19.6%) of the participants taught third grade, 24 (17.9%) taught fourth grade, 22 (16.1%) taught fifth grade, 23 (17%) taught sixth grade, 19 (14.3%) taught seventh grade, and 21 (15.1%) taught eighth grade. All of these participants completed “The Self-efficacy for Science Teaching Scale (SSTS)” in January 2015 and again in June 2015.
2.2 Research Design
months. In Phase III, the researcher met with an elementary science expert from the university in June 2015 to revise science content items on the SSTS in order that they aligned better to the state this study. Items were also revised to clarify the content being assessed and to shorten the survey length if possible. The basis for this change was also influenced by output from an Exploratory Factor Analysis (EFA).
In addition, a group of five elementary school teachers from participants in January 2015 to discuss the items on the scale. A logical initial step in developing a scale for a specific population is to test the instrument with members of that population through pilot testing. A pilot test can consist of as few as three or four people completing the questions and providing feedback. These testers, or group members, should provide feedback about commission and omission as well as how items are interpreted. Having the group examine the completeness of the survey is one way to examine content validity (Gay, Mills, & Airasian, 2009). The group provided feedback to the researcher regarding item wording. Only one item was suggested to be revised. These participants responded to items on the scale as a pre-test measure in January 2015. One hundred thirty-five measurement tools were distributed. This set of data was used to conduct a Confirmatory Factor Analysis (CFA) on the Self-efficacy for Science Teaching Scale.
2.3 Self-efficacy for Science Teaching Scale Development
Within the literature there exist both general and context specific instruments exist that are intended to measure teacher self-efficacy. The most widely accepted measure of general teacher self-efficacy, the TSES (Tschannen & Hoy, 2001), is deemed valid and reliable based on empirical research from several studies. The issue with the TSES for some purposes is that it only measures general self-efficacy and lacks the specificity that is preferred when accurately measuring self-efficacy for a specific task or within a specific context (Pajares, 1997). Therefore, the purpose of this study was to examine evidence of validity for a developed measurement tool that measures the science teaching self-efficacy of elementary school teachers entitled the, “Self-Efficacy for Science Teaching Scale (SSTS).” The SSTS was first created in January 2015. The SSTS was developed using three measurement tools as a framework for the creation of items. The TSES (Tschannen & Hoy, 2001) was used to guide work on the SSTS because it is the most widely accepted measure of general teacher self-efficacy. The short form of the TSES contains 12 questions that address three constructs: efficacy in student engagement, efficacy in instructional strategies and efficacy in classroom management. Another measurement tools entitled “The Self-Efficacy for Teaching Mathematics Instrument (STMI)” developed by McGee (2012) and “The Science Teaching Efficacy Belief Instrument (STEBI)” by developed Riggs and Enochs (1990) were also used as a guide for the SSTS.
Because classroom management is not one of the purposes of this research, those items from the TSES were not used in any form on the SSTS (TSES items 1, 3, 6, 8, and 11). In addition, the creators of the TSES (Tschannen and Hoy, 2001) acknowledge that classroom management was not a construct they originally considered to be part of self-efficacy for teaching but was a third construct that was added through subsequent validation studies because some of their focus groups suggested that those items be added. The questions on the TSES associated with this construct are also very specific to managing only disruptive student behavior. Taking the context of this study and the theoretical framework for self-efficacy into consideration, Part One of the SSTS, science teaching self-efficacy (STSE), uses items 2, 4, 5, 7, 9, 10 and 12 from the TSES short form. These items were modified to be science teaching specific. One additional item for SSTS Part One comes from Riggs and Enochs’s (1990) scale and another was added at the request of science expert. Part Two of the SSTS, efficacy for understanding elementary science content (EUSC), asks teachers to rate their confidence level for their understanding of science content specific to elementary school (i.e. characteristics of living things (i.e. cellular structure, chemical composition, reproduction, DNA, adaptation, organization), light, sound sources and spread, biodiversity and ecosystems). Part Three of the SSTS, efficacy for teaching science content (ETSC), asks teachers to rate their confidence in their ability to teach students the same science concepts. Parts Two and Three of the SSTS were developed using Aerni’s (2008) content specific items as a guide and revisedelementary school science and technology course curriculum. Content experts were consulted to be sure that items communicated clearly. Any needed revisions to the SSTS were reviewed by a group of elementary science teachers. These elementary teachers were selected randomly. The review of items by content expert during each phase of this study provided evidence for content validity.
Prior to an Exploratory Factor Analyses, the SSTS was expected to measure three constructs: Science teaching self-efficacy (STSE) (items 1-9), efficacy for understanding elementary science content (EUSC) (items 10 through 24), and efficacy for teaching science content (ETSC) (items 25 through 39).
2.4 Materials and Procedure
Factor structure of the SSTS was then examined using an Exploratory Factor Analysis (EFA). For participants that chose two responses to an item on the SSTS, the midpoint of the two responses was used as their response (e.g. 2 and 3 were selected, 2.5 was computed). Principal Component Analysis (PCA) was utilized in the EFA and VARIMAX rotation was used. The anticipated number of factors was not set prior to the analysis. Three separate EFA’s were conducted because of the structure of the SSTS in three parts. The TSES items were also on a nine-point scale while the items in SSTS Parts Two and Three were on a likert type 5-point scale.
Concurrent validity was examined by correlating Parts Two (EUSC) and Three (ETSC) of the SSTS to Part One (STSE). Part One of the SSTS, by containing items from the TSES, has strong, positive, and statistically significant correlations between the two constructs present: efficacy for student engagement in science (items 1, 2, 4, and 7) and efficacy for science instructional strategies (items 3, 5, 6, 8, and 9) (r=.75). These two constructs combined are second-order factors comprising the construct science teaching self-efficacy (STSE). Part One of the SSTS is used in this manner as an already existing, valid measure of teacher self-efficacy because items come directly from the TSES, a valid and reliable measure of teacher self-efficacy. Pearson’s r was the statistical measure used to ensure concurrent validity is present. See Tables 1, 2, and 3 for item correlations.
Phase II of the study included an evaluation of test-retest reliability. Test-retest reliability was examined by correlating participant responses from two administrations (January 2015 and June 2015). Pearson’s r was used as the correlation coefficient. Phase III of the study included an examination of possible revisions to the instrument. After the EFA was conducted, the factor structure was analyzed and some revisions were made to the SSTS in an effort to limit the number of constructs in the model. Specific revisions are detailed in Tables 6 and 7. An effort was made to keep the scale at reasonable length while also ensuring that adequate items per construct were maintained. The item scaling on Part One as nine-points was modified to be a five-point scale in Final Version so that the entire instrument was on the same scale. In addition, in Phase III of this study, a Confirmatory Factor Analysis (CFA) was conducted using data from teachers. One hundred thirty-five measurement tools were distributed and all were completed. The specified model contained three constructs (STSE, EUSC and ETSC) and their relevant observed variables as mentioned above, for other statistical analyses, the error variance of the three latent variables (STSE, EUSC and ETSC) was set to be free. The three latent variables were also set as second-order factors under the main factor self-efficacy for teaching science (SSTS). For the CFA, LISREL was used. Model modifications that were suggested were only considered if they fell within the specified theoretical framework.
3. Results
The purpose of this study was to show evidence of reliability and validity for a measurement tool that was developed to measure the science self-efficacy of elementary teachers. The SSTS was administered to two same participant groups. Statistical procedures were performed on the scale as it was under development. Those procedures are highlighted in this chapter of study as evidence of reliability and validity of the scale.
3.1 Development of SSTS
Based on a review of the literature, the SSTS was developed using available instruments as a foundation, along with Bandura’s ideas about self-efficacy from Social Cognitive Theory, literature about science beliefs and applications, and input from content experts. Items from “The Science Teaching Efficacy Belief Instrument (STEBI) (Riggs & Enochs, 1990)”, “The Teacher’s Sense of Efficacy Scale (TSES) (Tschannen & Hoy, 2001)” and “The Self-efficacy for Teaching Mathematics Instrument (McGee, 2012)” were used, along with the researcher’s creation of items, to develop the SSTS in January 2015. For the SSTS (First Version), there were three expected constructs prior to further analysis of data:
science teaching self-efficacy (STSE) (items 1-9), efficacy for understanding elementary science content (EUSC) (items 10 through 24), and efficacy for teaching science content (ETSC) (items 25 through 39).
3.2 Reliability
Data collection from elementary science teachers was used to establish reliability of the SSTS. One hundred thirty-five measurement tools were distributed and completed. Reliability was explored using Cronbach’s alpha. For STSE, the reliability is .83; for EUSC, the reliability is .76 and for ETSC, the reliability is .87. These are acceptable reliability values and indicate moderately strong reliability of the scale. Because the reliability of the scale was deemed to be acceptable, further examination of the factor structure was conducted.
Table 1. Reliability and descriptive statistics of the constructs (first, N=135; final, N=112)
First Version Final Version
α M SD α M SD
STSE .83 6.17 1.01 .86 3.68 .53
EUSC .76 3.68 .51 .82 3.25 .61
ETSC .87 3.54 .48 .92 3.49 .62
Note. First Version of the SSTS had a rating scale from 1 to 9 whereas the rating scale of Final Version was 1 to 5.
3.3 Factor Structure of the SSTS (First Version)
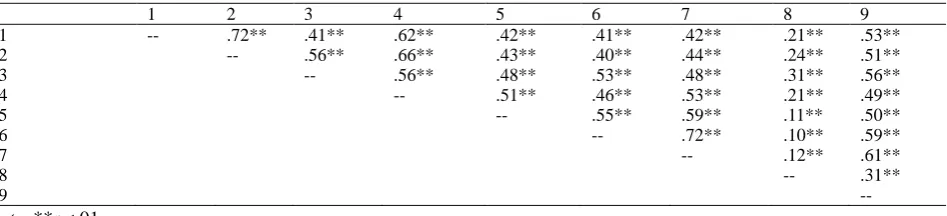
Due to the construction of the SSTS as containing three distinct parts, three separate factor analyses were conducted using SPSS version 17. It was determined a priori that any item with a factor loading greater than .40 would be considered. This is based on the suggestion of Comrey and Lee (1992) that loadings in excess of .71 are considered excellent, .63 very good, .55 good, .45 fair and .32 poor. Loadings less than .32 (less than 10% overlapping variance) are usually not interpreted. Exploratory Factor Analysis (EFA) was used to determine the factor structure of the data. Principal Component Analysis and Varimax rotation were used. Scree plots were also examined. Two principal components emerged from Part One of the SSTS, explaining 63.47% of the total variance. However, examination of the component matrix revealed that only one item (Item 8) was in the second chapter. The low correlation between Item 8 and other items in this factor indicated that it was not a valid item for self-efficacy and therefore Item 8 was not used in further analysis. Item correlations can be found in Table 2. Hence, data indicate that only one factor exists in Part One of the SSTS; science teaching self-efficacy (STSE).
Table 2. Item correlations, SSTS first version, part one (STSE) (N=135)
1 2 3 4 5 6 7 8 9
1 -- .72** .41** .62** .42** .41** .42** .21** .53**
2 -- .56** .66** .43** .40** .44** .24** .51**
3 -- .56** .48** .53** .48** .31** .56**
4 -- .51** .46** .53** .21** .49**
5 -- .55** .59** .11** .50**
6 -- .72** .10** .59**
7 -- .12** .61**
8 -- .31**
9 --
Note. **p<.01
The second EFA revealed three factors in Part Final of the SSTS: (a) understanding science concepts (items 10, 11, 12, 14, 15, 17, 18); (b) analyzing science concepts (items 19, 20, 21, 22, 24); and (c) solving multi-step science issues (items 13, 16, 23). These three factors explained 60.54% of the total variance. Item 23 was cross-loaded into both factor 2 (.52) and factor 3 (.57). Most items in Part Final were statistically significantly correlated (see Table 3) and therefore these items were grouped into the second-order factor efficacy for understanding science content (EUSC) for further analysis. Table 3. Item correlations, SSTS first version, part two (EUSC) (N=135)
10 11 12 13 14 15 16 17 18 19 20 21 22 23 24
10 -- .56** .59** .29** .41** .37** .19** .33** 38** 26** 12 25** 02 11 40** 11 -- .76** .33** .59** .44** .20** .41** 54** 32** 20** 42** 08 08 43** 12 -- .37** .57** .43** .26** .41** 54** 28** 06 35** 05 15* 41** 13 -- .46** .30** .55** .30** 36** 28** 08 25** 25** 43** 17*
14 -- .55** .37** .38** 54** 39** 11 45** 17* 22** 36**
15 -- .34** .48** 43** 41** 12** 25** 05 12 27**
16 -- .37** 32** 24** 08 24** 21** 42** 09
17 -- 55** 38** 11 18** 16* 18* 30**
18 -- 50** 19** 42** 16* 28** 49**
19 -- 27** 45** 32** 28** 42**
20 -- 35** 27** 31** 35**
21 -- 43** 31** 49**
22 -- 46** 45**
23 -- 39**
24 --
Note. *p<.05; **p<.01
4) and therefore grouped into the second-order factor efficacy for teaching science concepts (ETSC) for further analysis. Table 4. Item correlations, SSTS first version, part three (ETSC) (N=135)
25 26 27 28 29 30 31 32 33 34 35 36 37 38 39
25 -- .66** .62** .24** .43** .32** .17** .42** .45** .36** .17* .25** .12 .10 .40** 26 -- .84** .36** .55** .39** .26** .49** .54** .37** .23** .36** .21* .22* .37** 27 -- .38** .64** .36** .22** .45** .54** .29** .18* .27** .07 .27** .35** 28 -- .59** .39** .56** .41** .26** .36** .38** .52** .42** .63** .37*
29 -- .52** .42** .42** .46** .36** .20* .45** .24** .36** .38**
30 -- .46** .45** .33** .41** .29** .35** .25** .26** .31**
31 -- .40** .32** .51** .30** .54** .51** .52** .26**
32 -- .53** .48** .32** .36** .26** .32** .34**
33 -- .52** .34** .35** .31** .28** .49**
34 -- .36** .52** .42** .43** .42**
35 -- .54** .37** .38** .38**
36 -- .59** .59** .47**
37 -- .60** .44**
38 -- .42**
39 --
Note. *p<.05; **p<.01
3.4 Concurrent Validity of the SSTS (First Version)
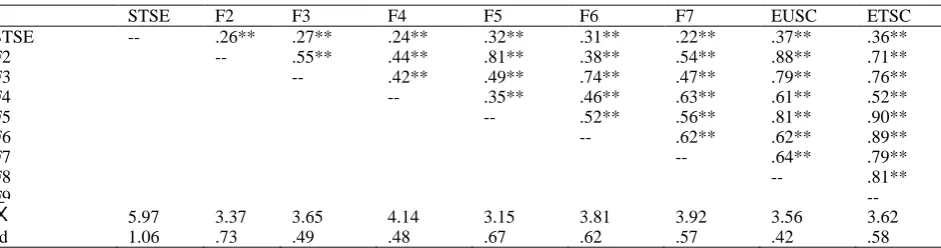
Concurrent validity of the SSTS (First Version) was examined after conducting the EFA. The purpose of this analysis was to provide evidence that items in Part Two and Part Three of the SSTS, the parts created solely by the researcher, were accurate measures of self-efficacy. Part One of the SSTS was compared against Part Two and Part Three. Part One uses items of the TSES re-worded to be science specific and since the TSES has been validated, Part One represents a validated scale. A mean score for STSE, EUSC and ETSC was computed for each participant. Correlations between each of the factors (STSE, EUSC, and ETSC) were examined and all were statistically significantly different from zero at the 0.01 level: STSE and EUSC (r=0.37); and STSE and ETSC (r=0.36). Although the correlations are not incredibly high, their status as statistically significant confirms the concurrent validity of the scale. These results are located in Table 5. Table 5 also shows correlations of each of the sub-factors identified on the EFA. A mean score for each item in the sub-factor was computed and this was used as a score for each participant on the sub-factor.
Table 5. First version factor correlations and concurrent validity (N=135)
STSE F2 F3 F4 F5 F6 F7 EUSC ETSC
STSE -- .26** .27** .24** .32** .31** .22** .37** .36**
F2 -- .55** .44** .81** .38** .54** .88** .71**
F3 -- .42** .49** .74** .47** .79** .76**
F4 -- .35** .46** .63** .61** .52**
F5 -- .52** .56** .81** .90**
F6 -- .62** .62** .89**
F7 -- .64** .79**
F8 -- .81**
F9 --
5.97 3.37 3.65 4.14 3.15 3.81 3.92 3.56 3.62
sd 1.06 .73 .49 .48 .67 .62 .57 .42 .58
Note. (a) Factor 1 is Science Teaching Self-Efficacy, Factor 2 is Understanding Science Concepts, Factor 3 is Analyzing Science Concepts, Factor 4 is Solving and Evaluating Science Issues, Factor 5 is Teaching Science Concepts, Factor 6 is Teaching Students to Analyze Science Concepts, Factor 7 is Teaching Students to Solve and Evaluate Science Issues; (b) Factor 1 is measured on a 9-point scale while all other factors are measured on a 5-point scale; (c) *p<.05; **p< .01.
3.5 Correlation Between Pre and Post Administration
Table 6. Correlation between pre and post administration (pre, N=135; post, N=112)
STSE_Post EUSC_Post ETSC_Post
STSE_Pre .36** -- --
EUSC_Pre -- .61** --
ETSC_Pre -- -- .48**
Note. **p<.01
3.6 Revisions to the SSTS (First Version)
The results of the three Exploratory Factor Analyses and concurrent validity indicated that the SSTS needed revisions. First, the factor structure of the SSTS was more complex than initially intended. The theoretical framework of this study indicated that there are three constructs of self-efficacy for teaching science in elementary school: science teaching self-efficacy (STSE), efficacy for understanding science content (EUSC) and efficacy for teaching science content
(ETSC). The cross-loadings of some items into more than one factor on the EFA indicated that some items are not clear, observable correlates to these factors. Upon closer review, some items needed revision to be more specific and measurable. Additionally, the small number of items in some of the factors indicated the need for more items to be created to capture that construct. In response to these issues, the researcher and elementary school content expert examined the items closely being attentive to their complexity and their relevance to the science course for third grade through eihgth grade. An attempt was made to equally represent items from each of the grade levels. Science concepts build on each other through the grades, so this was thought to be appropriate.
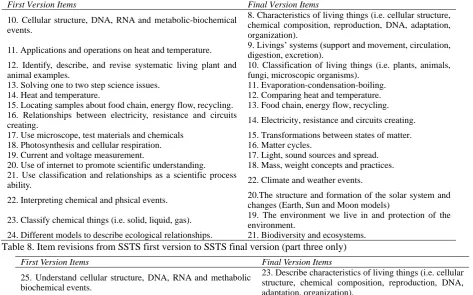
Table 7. Item revisions from SSTS first version to SSTS final version (part two only)
First Version Items Final Version Items
10. Cellular structure, DNA, RNA and metabolic-biochemical events.
8. Characteristics of living things (i.e. cellular structure, chemical composition, reproduction, DNA, adaptation, organization).
11. Applications and operations on heat and temperature. 9. Livings’ systems (support and movement, circulation, digestion, excretion).
12. Identify, describe, and revise systematic living plant and animal examples.
10. Classification of living things (i.e. plants, animals, fungi, microscopic organisms).
13. Solving one to two step science issues. 11. Evaporation-condensation-boiling. 14. Heat and temperature. 12. Comparing heat and temperature. 15. Locating samples about food chain, energy flow, recycling. 13. Food chain, energy flow, recycling. 16. Relationships between electricity, resistance and circuits
creating. 14. Electricity, resistance and circuits creating.
17. Use microscope, test materials and chemicals 15. Transformations between states of matter. 18. Photosynthesis and cellular respiration. 16. Matter cycles.
19. Current and voltage measurement. 17. Light, sound sources and spread. 20. Use of internet to promote scientific understanding. 18. Mass, weight concepts and practices. 21. Use classification and relationships as a scientific process
ability. 22. Climate and weather events.
22. Interpreting chemical and phsical events. 20.The structure and formation of the solar system and changes (Earth, Sun and Moon models)
23. Classify chemical things (i.e. solid, liquid, gas). 19. The environment we live in and protection of the environment.
24. Different models to describe ecological relationships. 21. Biodiversity and ecosystems. Table 8. Item revisions from SSTS first version to SSTS final version (part three only)
First Version Items Final Version Items
25. Understand cellular structure, DNA, RNA and methabolic biochemical events.
23. Describe characteristics of living things (i.e. cellular structure, chemical composition, reproduction, DNA, adaptation, organization).
26. Perform operations on heat and temperature. 24. Assimilate livings’ systems (support and movement, circulation, digestion, excretion).
27. Identify, describe, and revise systematic living plant and animal examples.
25. Classification living things (i.e. plants, animals, fungi, microscopic organisms).
28. Solve one to two step science issues. 26. Compare evaporation-condensation-boiling. 29. Describe heat and temperature. 27. Compare heat and temperature.
30. Locate samples about food chain, energy flow, recycling. 28. Analyze food chain, energy flow, recycling. 31. Understand electricity, resistance and circuits creating. 29. Perform strategies for electricity, resistance and
circuits creating.
32. Use microscope, test materials and chemicals. 30. Interpret transformations between states of matter. 33. Understand photosynthesis and cellular respiration. 31. Correlate matter cycles.
34. Measure current and voltage 32. Perform applications about light, sound sources and spread.
35. Use of internet to promote scientific understanding. 33. Compare mass, weight concepts and practices. 36. Use classification and relationships as a scientific process
ability. 37. Interpret climate and weather events.
37. Interpret chemical and phsical events. 35. Interpret the structure and formation of the solar system and changes (Earth, Sun and Moon models) 38. Classify chemical things (i.e. solid, liquid, gas). 34. Comprehension the environment we live in and
protection of the environment.
39. Use different models to describe ecological relationships. 36. Evaluate about biodiversity and ecosystems.
Some items from First Version were deleted for various reasons. Item 13, and therefore item 28, (solving one to two step science issues). It loaded into a sub-factor of Part Two and did not provide a concise way to measure the complexity of solving science issues. Those items were deleted and better worded items to describe scientific process were added. Item 20 (use of internet to promote scientific understanding), and therefore item 35, were also deleted as they do not relate specifically to the science course for grades third grade through eighth grade. This item had a low correlation between other items in the same construct.
group felt that the newly revised items were more clear and relevant to the elementary science course of study. Final version of the SSTS now contains 37 concise items. The first seven items are indicators of STSE, items 8 through 22 are EUSC, and items 23 through 37 are ETSC. Each of these constructs is subsumed over the second-order construct of
self-efficacy for science teaching (SST).
3.7 Model Fit of the SSTS
In order to verify the theoretical model proposed in this study, that self-efficacy for science contains three distinct factors: STSE, EUSC and ETSC, a Confirmatory Factor Analysis (CFA) was conducted using LISREL. First, imputation of missing values was calculated in the data set using the mean of responses within the construct for each science teacher. Then, using syntax in LISREL, the model fit was tested against raw data from the June 2015 administration of the SSTS with elementary science teachers.
The first model tested (Self-efficacy Model 1) was the original theoretical model containing three latent variables within the second-order construct of self-efficacy for science teaching (SEST). This model was found not to fit the covariance matrix (χ2=2914.21; df=557; p<.01; RMSEA [90%CI]=.15; .16; CFI=.85; GFI=.63). Pattern coefficients were within reason, but some error variances of observed variables were quite large (e.g., Item 17=.85, Item 34=.71). The model was tested with Item 17 eliminated, but this did not improve the model fit. Additionally, the correlation between the second-order construct and the first-order constructs was quite high for EUSC (.85) and ETSC (.92). The modification indices suggested allowing error variances between observed variables to correlate but, suggested modifications were not allowed because they did not fit the theoretical framework of the study. As this model was not a good fit to the data, other models were considered.
3.8 Modified Model Fit
Upon considering other options for the model, the construct EUSC was examined closely as some of the items within that construct were problematic within the model fit (Item 17 and Item 9). Upon closer review of item wording it was determined that Items 8-22 were possibly not measures of self-efficacy for content but were perhaps a self-report of science content knowledge. Model 2 for self-efficacy was considered without these items, although these items could relate to self-efficacy as they measure self-concept of one’s science content knowledge.
The items in ETSC were closely examined and two logical testlets were formed based on item content in that construct:
efficacy for teaching scientific process (ETSP) and efficacy for teaching science concepts (ETSC). Testlets are groups of questions that are related to larger stimuli and administered together. Testlets normally contain four or more items that are always presented in the same order. The benefit of the testlet is that it makes testing more efficient and allows for greater control in examining constructs within a test (Wainer, Bradlow, & Wang, 2007). ETSP consisted of items 24, 25, 26, 27, 31, 32, 33, and 34. All of these items were relevant to teaching someone to perform a scientific procedure. All items in this testlet are statistically significantly correlated (see Table 9).
Table 9. Item correlations for testlet Efficacy for Teaching Scientific Process (ETSP)
24 25 26 27 31 32 33 34
24 -- .56** .36** .42** .42** .31** .22* .34**
25 -- .56** .66** .53** .50** .44** .36**
26 -- .86** .56** .56** .48** .31**
27 -- .55** .57** .53** .34**
31 -- .52** .44** .45**
32 -- .77** .38**
33 -- .28**
34 --
Note.**p<.01
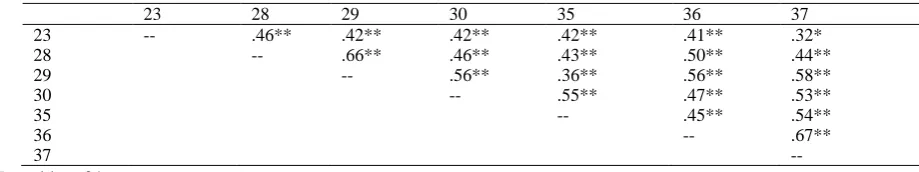
ETSC consisted of items 23, 28, 29, 30, 35, 36, and 37. All items were relevant to teaching someone a scientific concept or idea, but not a procedure. All items were statistically significantly correlated (see Table 10).
Table 10. Item correlations for testlet Efficacy for Teaching Science Concepts (ETSC)
23 28 29 30 35 36 37
23 -- .46** .42** .42** .42** .41** .32*
28 -- .66** .46** .43** .50** .44**
29 -- .56** .36** .56** .58**
30 -- .55** .47** .53**
35 -- .45** .54**
36 -- .67**
37 --
Both parts of science are important and complimentary to one another. Teaching procedures is different from teaching concepts as one is more concrete and the other abstract. It is the researcher’s belief that different judgments of ability may influence the self-efficacy of teachers to perform both teaching tasks. This is aligned to Posnanski’s (2002), Avraamidou and Zembal-Saul’s (2005) conceptual framework for examining teacher’s pedagogical content beliefs in science. Self-efficacy Model 2 had three latent constructs for self-efficacy for science teaching. The three latent constructs were: STSE, ETSP and ETSC. This model had better fit to the covariance matrix (χ2=532.73; df=247; p<.0001; RMSEA [90%CI]=.07; .09; CFI=.95; GFI=.85). Pattern coefficients were within reason and error variances of observed variables were acceptable as most were around .50. The modification indices suggested allowing several error covariances to correlate, most were within reason as they maintained the theoretical framework. The error covariance was allowed to correlate between Item 26 and Item 27, as both issues regarded heat and temperature. Error covariance was also allowed to correlate between Item 32 and Item 33, as both items concerned ecosystem and biodiversity units. Additionally, there was a high correlation between ETSP and ETSC (.95) and this was expected due to the nature of these items as concerning self-efficacy for teaching specific scientific content. Table 11 shows the change in model fit between “Self-efficacy Model 1” and “Self-efficacy Model 2”.
Table 11. Model fit ındices for the SSTS
χ2 df GFI AGFI NFI NNFI CFI SRMR RMSEA 90%LL 90%UL
Model 1 2914.21 557 .63 .50 .83 .85 .85 .079 .15 .15 .16
Model 2 532.73 247 .85 .80 .90 .93 .95 .077 .09 .07 .09
Model 3 412.47 107 .83 .76 .93 .94 .95 .081 .09 .08 .10
Note. GFI=Goodness of Fit, AGFI=Adjusted Goodness of Fit, NFI=Normed Fit Index, NNFI=Non-Normed Fit Index, CFI=Comparative Fit Index, SRMR=Standardized Root Mean Residual, RMSEA=Root Mean Square Error of Approximation.
In a further attempt to better understand the complexity of an elementary teacher’s science teaching self-efficacy, an multivariate analysis of variance (MANOVA) was conducted to examine the current grade level of teachers and their scores on each of the original constructs (STSE, EUSC, ETSC). SPSS version 17.0 was used. The dependent variable was scores for each of the three constructs and the independent variable was grade level. The assumption of equality of covariance matrices was not satisfied (Box’s M=106.59, p<.01). There was a significant difference between the treatment (grade level) on the combined dependent variables (STSE, EUSC, ETSC), Wilks’ Lambda=.74; F=3.92; p<.01. Univariate tests were performed to examine the differences between the groups on the dependent variable, grade level. There was a difference between the groups on EUSC (p<.01) and for ETSC (p<.01), but not for STSE (p>.05).
As STSE was not significantly different for grade levels, and as EUSC is potentially not a good measure of self-efficacy, an analysis of variance was conducted with ETSC as the dependent variable and grade level as the independent variable. There was a statistically significant difference (p<.01) between the groups with regard to ETSC. A boxplot shows that only 8th grade was normally distributed, with all other grades (3, 4, 5, 6, 7) being positively skewed. Third grade teachers showed the most extreme positive skew. Third grade teachers were statistically significantly different from 6th (p=.01), 7th (p=.002), and 8th grade (p=.001). Fourth grade was statistically significantly different from 7th (p=.01) and 8th grade (p=.01). Fifth grade was statistically significant from 8th grade (p=.02). The science content covered in a third grade class is much more basic than other grades, and it is statistically significantly different from upper elementary grades. An EFA was conducted on the responses for ETSC only to determine if removal of third grade from the dataset altered the construction of the factor, thus allowing for smaller testlets to be formed. The EFA revealed three factors that explained 68.91% of the variance. Factor loadings higher than .40 were considered. The three factors are: living things and organization (LTO) (items 24, 25, 23, and 28), comparing basic science concepts (CSC) (items 26, 27, 32, 33), and
collecting and interpretation of data about science issues (CID) (items 34, 30, 35, and 37). Three items cross-loaded (Item 29, 31, and 36) and those items were not included in further analysis. Three measurement models, one for each of the three new constructs (LTO, CSC and CID) were tested using LISREL. The first measurement model for LTO fit the covariance matrix (χ2=19.72; df=2; p<.0001; RMSEA[90%CI]=.12; .29; CFI=.94; GFI=.95).However, the model was still statistically significant. Modification indices suggested allowing error variance to correlate between Item 23 and 24. This improved the model fit (χ2=1.83; df=1; p=.41; RMSEA[90%CI]=.04; .26; CFI=.96; GFI=.98). The second measurement model for CSC did not fit the covariance matrix (χ2=26.52; df=2; p<.0001; RMSEA[90%CI]=.16; .32; CFI=.92; GFI=.93). The fit indices were slightly low. Modification indices suggested allowing error variance to correlate between Item 32 and 27. This improved the model fit (χ2=3.45; df=1; p=.12; RMSEA[90%CI]=.17; .39; CFI=1.00; GFI=1.00). The third measurement model for CID had good fit indices (χ2=8.76; df=2; p=.01; RMSEA[90%CI]=.00, .24; CFI=.95; GFI=.95).
LTO, CSC and CID were set to the second-order construct ETSC. The initial model fit needed improvement (χ2=285.53;
d=32; p<.001; RMSEA[90%CI]=.19; .24; CFI=.92; GFI=.80). The fit indices were too low. Modification indices suggested allowing error variance to correlate between Item 23 and Item 28, between Item 27 and Item 32, and between Item 35 and Item 37. These modifications were made as item content showed significant conceptual relationships. The modified model had an improved fit (χ2=116.42; df=34; p<.001; RMSEA[90%CI]=.04; .17; CFI=.95; GFI=.85). The measurement model was tested again for STSE since third grade teachers were removed from the analysis. The initial model fit needed improvement (χ2=94.13; df=11; p<.001; RMSEA[90%CI]=.11; .21; CFI=.90; GFI=.85). The fit indices were too low. Modification indices suggested allowing error variance to correlate between Item 1 and Item 2 and between Item 6 and Item 7. These modifications were made as item content showed significant conceptual relationships. The modified model had an improved fit (χ2=35.62; df=11; p<.0005; RMSEA[90%CI]=.02; .10; CFI=.96; GFI=.96). The final structural model (Model 3) was tested with third grade removed from the dataset. The initial model fit needed improvement as fit indices were too low (χ2=437.32; df=82; p<.001; RMSEA[90%CI]=.06; .13; CFI=.95; GFI=.80). LISREL did not display a path diagram as the model was non-admissible. The fit indices can be seen in Table 11 compared against Model 1 and Model 2.
4. Discussion
The theoretical basis for this study aligns with Bandura’s (1977) ideas about self-efficacy from Social Cognitive Theory. According to Bandura, actual teaching experiences, either successful or not, have the greatest effect on beliefs. Khourey-Bowers and Simonis (2004) supported this finding when they stated, “Efficacy beliefs strengthen when success is achieved on difficult tasks with little assistance or when success is achieved early on in learning”. Self-efficacy is one’s beliefs about how their actions produce given future attainments (Bandura, 1977; Tschannen & Hoy, 2001). Currently there is one widely accepted measure of teacher self-efficacy, the Teacher’s Sense of Efficacy Scale (TSES) (Tschannen & Hoy, 2001) and one widely accepted instrument, the Science Teaching Efficacy Belief Instrument form B (STEBI-B) (Enochs & Riggs, 1990).
The need for a science-specific self-efficacy scale to measure the beliefs of teachers is evident and was the guiding purpose for this study. In response to the need for better measurement of teacher self-efficacy within a science context, “The Self-efficacy for Science Teaching Scale (SSTS)” was developed. The SSTS is comprised of three parts: “Science Teaching Self-efficacy (STSE), Efficacy for Understanding Science Content (EUSC) and Efficacy for Teaching Science Content (ETSC)”. Reliability for each part of the SSTS was found to be acceptable for both versions of the scale. Additionally, concurrent validity of the SSTS was explored by correlating EUSC and ETSC to STSE. Correlations were all statistically significant at the .01 level and therefore the SSTS was assumed to have acceptable concurrent validity. To examine factor structure, the first EFA of First Version of the SSTS revealed a more complex factor structure than was anticipated. Revisions to First Version of the scale were made to simplify the factor structure, clarify item content, and align science content items. Following other recommendations from the teacher group, the SSTS was revised and administered to a second participants. A confirmatory factor analysis (CFA) was conducted on Final Version of the scale to examine the construct validity.
The initial model did not fit the data, but a modification to the model excluding EUSC (Items 8 and 22) and creating testlets within the ETSC construct proved fruitful. Further analysis of the ETSC construct into smaller testlets proved to be a better model fit, along with the exclusion of third grade teachers from the data. The iterations of the theoretical model for ETSC gave insight into the potential nature of an elementary science teacher’s self-efficacy beliefs. Although the EUSC construct was removed in the Confirmatory Factor Analyses of Models 2 and 3, the items should not be completely abandoned. The EUSC construct items (8 through 22) were analyzed separately with third grade teachers removed to check the construct validity of those items. Although it was concluded that those items were not an accurate measure of self-efficacy for content knowledge, they may represent self-concept for science content knowledge. Self-concept could influence self-efficacy as self-concept of content knowledge could be a component of pedagogical content knowledge.
Pedagogical content knowledge is a part of a science teacher’s belief system, although it influences self-efficacy. With the self-concept model considered separately from the self-efficacy model, and the relationship between the two acknowledged, it seems that the nature of self-efficacy beliefs may in fact be a structural model. The findings from the final CFA suggest that there is a bit more complexity to self-efficacy beliefs than may have first been realized by researchers. The impact of the specific components of scientific content on the factor structure of ETSC suggests a close relationship to Enochs and Riggs (1990) ideas about a science teacher’s complex belief systems. In further examination of these items they are referenced as “self-concept for science content knowledge”.
4.1 Limitations of This Study
4.2 Minimizing Threats to Internal Validity
In order to maintain the integrity of this study, threats to internal validity were minimized. This research spanned one academic year and included two groups of participants. One threat to the internal validity of this study is the impact of history, or the events that may impact the self-efficacy of the teacher outside of the scope of this study. In order to minimize this threat to internal validity, the timing for administration of the SSTS for both the EFA analysis and the CFA analysis occurred at the end of the academic semi-period. Additionally, participants completed the SSTS two times. Data collected at each time was used for different data analyses, which minimized the risk of interference between participant responses in each administration. In addition, each teacher’s exposure to science content, science teaching practices, and content experts varied. This threat to internal validity is difficult to minimize, but the assumption of the researcher is that the variance within the participant population will minimize the effects of individual teacher’s experiences.
The examination of the revised SSTS items by a group ensured that instrumentation was not a threat to the internal validity of this study. In some cases, such as the examination of concurrent validity, the attrition of teachers or the presence of missing data may have caused a slight difference in the number of participants for that data analysis. However, these differences are slight and are not thought to affect the integrity of that data analysis.
4.3 Minimizing Threats to External Validity
It was important to minimize threats to external validity of the scale as purpose of this research was to create a reliable and valid scale to be used with elementary teachers. One threat to the generalizability of this study was the participant group as a representative sample of the elementary science teacher population. Teachers in the participant sample were mostly 14 years and over professional experience and mostly male, which echoed the population of elementary school science teachers. Participants were also evenly distributed among grade levels from grades 3 to 8. Although this threat is minimized by the demographics of the participant sample as being representative of the population of elementary school teachers, it was possible that teachers had a high self-efficacy for science or a low self-efficacy for science, which impacted their decision to apply. First of all, teachers were chosen for participation based on their branches (eg. science). In addition, teachers were chosen to participate in this study in an effort to have all elementary teachers participate in either the any project or another science professional development program. To some degree, the range of experience and self-efficacy with science in the participant group should account for individual differences.
The same concerns could cause selection-treatment interaction to be a threat to external validity; however the diversity in the group of participants and the large number of participants in this study over the one academic year minimized that threat. Specificity of variables is minimized as a threat to external validity by establishing face and content validity of the SSTS as representing all aspects of elementary science teaching. Therefore, variables are not overly specific to any one sub-group of elementary teachers (i.e. grade or professional experience). Finally, participant effects were minimized because participants understand that completing the SSTS was a part of their conscientious responsibilities. An effort was also made to spread teacher assessments and surveys out over time as to avoid giving teachers too many instruments to complete at once as a part of their responsibilities.
5. Conclusions and Future Studies
Ultimately, these results show evidence that the SSTS is a valid and reliable measure of two aspects of self-efficacy:
interaction with pedagogical content knowledge that has not been explained in this study. These and other factors may contribute to self-efficacy in a way not previously described in the literature.
References
Aerni, P. (2008). Teacher self-efficacy and beliefs for teaching mathematics in inclusive settings. (Doctoral dissertation).
(Publication No. AAT 3353198). Retrieved August 18, 2011 from,
http://proquest.umi.com/pqdlink?Ver=1&Exp=08-28-2017
Alshalaan, N. A. (2006). The relationship between school environment, preservice science teachers’ science teaching
self-efficacy and their use of instructional strategies at teachers’ colleges in Saudi Arabia. (Doctoral dissertation).
(Publication No. 3215160). Retrieved August 18, 2011 from,
http://proquest.umi.com/pqdlink?Ver=1&Exp=08-28-2017
Avraamidou, L., & Zembal-Saul, C. (2005). Giving priority to evidence in science teaching: a first-year elementary teacher’s specialized practices and knowledge. Journal of Research in Science Teaching, 42(9), 965-986. http://dx.doi.org/10.1002/tea.20081
Bandura, A. (1977). Self-efficacy: Toward a unifying theory of behavioral change. Psychological Review, 84, 191-215. http://dx.doi.org/10.1037/0033-295X.84.2.191
Bandura, A. (1997). Self-efficacy: The exercise of control. New York: Freeman.
Bandura, A. (2006). Guide for constructing self-efficacy scales. In. Pajares, F. & Urdan, T. (Eds.). Self-efficacy beliefs of adolescents. Greenwich, CT: Information Age Publishing.
Batiza, A., Gruhl, M., Hagedorn, E., Zhang, B., Herman, T., & Nelson, D. (2011). Effect of the SUN project workshop on teacher self-efficacy. Paper presented at the Annual International Conference of the National Association for Research in Science Teaching, Orlando, FL.
Bayraktar, S. (2011). Turkish preservice primary school teachers’ science teaching efficiacy beliefs and attitudes toward science: The effect of a primary teacher education program. School Science and Mathematics, 111(3), 83-92. http://dx.doi.org/10.1111/j.1949-8594.2010.00065.x
Berman, P., McLaughlin, M., Bass, G., Pauly, E., & Zellman, G. (1977). Federal programs supporting educational change. Vol. VII. Factors affecting implementation and continuation. Santa Monica, CA: The Rand Corp. (Report No. R-1589/7-HEW). (ERIC No. 140 432).
Beswick, K. (2012). Teachers’ beliefs about school mathematics and mathematicians’ mathematics and their relationship to practice. Educational Studies in Mathematics, 79, 127-147. http://dx.doi.org/10.1007/s10649-011-9333-2 Bursal, M. (2010). Turkish preservice elementary teachers’ self-efficacy beliefs regarding mathematics and science
teaching. International Journal of Science and Mathematics Education, 8, 649-666. http://dx.doi.org/10.1007/s10763-009-9179-6
Buss, R. R. (2010). Efficacy for teaching elementary science and mathematics compared to other content. School Science and Mathematics, 110(6), 290-297. http://dx.doi.org/10.1111/j.1949-8594.2010.00037.x
Cantrell, P., Cantrell, J. A., & Patch, M. R. (2011). Correlates of elementary preservice teachers’ science teaching
efficacy beliefs. Paper presented at the Annual International Conference of the National Association for Research in Science Teaching, Orlando, FL.
Cartwright, T. J., & Smith, S. (2011). How would they know? Developing elementary preservice teachers’ science teaching self-efficacy. Paper presented at the Annual International Conference of the National Association for Research in Science Teaching, Orlando, FL.
Chan, K. W., & Elliott, R. G. (2004). Relational analysis of personal epistemology and conceptions about teaching and learning. Teaching and Teacher Education, 20(8), 817–831.
Colosi, L. A. (1997). The Layman's guide to social research methods: Reliability and validity: What's the difference?
Retrieved June 11, 2011 from, www.socialresearchmethods.net/tutorial/Colosi/lcolosi2.htm
Comrey, A. L., & Lee, H. B. (1992). A first course in factor analysis (2nd edition). Hillsdale, NJ: Lawrence Erlbaum Associates.
Darling-Hammond, L., & Youngs, P. (2002). Defining “highly qualified teachers”: What does “scientifically-based research” actually tell us? Educational Researcher, 31, 13-25. http://dx.doi.org/10.3102/0013189X031009013 Dawes, J. G. (2008). Do data characteristics change according to the number of scale points used? International Journal
Dellinger, A. B., Bobbett, J. J., Olivier, D. F., & Ellett, C. D. (2008). Measuring teachers’ self-efficacy beliefs: Development and use of the TEBS-Self. Teaching and Teacher Education, 24(3), 751-766. http://dx.doi.org/10.1016/j.tate.2007.02.010
Dembo, M., & Gibson, S. (1985). Teachers’ sense of efficacy: An important factor in school improvement. The Elementary School Journal, 86, 173-184. http://dx.doi.org/10.1086/461441
Deniz, H., Orgill, M., & Carroll, K. R. (2011). Increasing science teaching efficacy beliefs among elementary teachers through content knowledge improvement. Paper presented at the Annual International Conference of the National Association for Research in Science Teaching, Orlando, FL.
Ebel, R. L. (1980). Survey research in education: The need and the value. Peabody Journal of Education, 57, 126-134. http://dx.doi.org/10.1080/01619568009538278
Enochs, L. G., Smith, P. L., & Huinker, D. (2000). Establishing Factorial Validity of the Mathematics Teaching Efficacy
Beliefs Instrument. School Science and Mathematics, 100, 194-202.
http://dx.doi.org/10.1111/j.1949-8594.2000.tb17256.x
Enochs, L., & Riggs, I. (1990). Further development of an elementary science teaching efficacy belief instrument: A preservice elementary scale. School Science and Mathematics, 90(8), 694-706. http://dx.doi.org/10.1111/j.1949-8594.1990.tb12048.x
Ernest, P. (1989). The impact of beliefs on the teaching of mathematics. In P. Ernest (Ed.), Mathematics teaching: The state of the art (249-254). London: Falmer.
Gay, L. R., Mills, G. E., & Airasian, P. (2009). Educational research: Competencies for analysis and applications.
Upper Saddle River, NJ: Pearson Education, Inc.
Gibson, S., & Dembo, M. H. (1984). Teacher efficacy: A construct validation. Journal of Educational Psychology, 76,
569-582. http://dx.doi.org/10.1037/0022-0663.76.4.569
Gunning, A. M., & Mensah, F. M. (2011). Preservice elementary teachers’ development of self-efficacy and confidence to teach science: A case study. Journal of Science Teacher Education, 22, 171-185. http://dx.doi.org/10.1007/s10972-010-9198-8
Haney, J., Lumpe, A., Czerniak, C., & Egan, V. (2002). From beliefs to action: The beliefs and action of teachers implementing change. Journal of Science Teacher Education, 13(3), 171-187. http://dx.doi.org/10.1023/A:1016565016116
Hechter, R. P. (2011). Changes in preservice elementary teachers’ personal science teaching efficacy and science teaching outcome expectancies. Journal of Science Teacher Education, 22, 187-202. http://dx.doi.org/10.1007/s10972-010-9199-7
Henson, R. K. (2001). Teacher self-efficacy: Substantive implications and measurement dilemmas. Paper presented at the annual meeting of the Educational Research Exchange, Texas A&M University, College Station, TX.
Henson, R. K., Kogan, L. R., & Vacha-Haase, T. (2001). A reliability generalization study of the teacher efficacy scale and related instruments. Educational and Psychological Measurement, 61(3), 404–420. http://dx.doi.org/10.1177/00131640121971284
Kazempour, M. (2011). Impact of a methods course on pre-service elementary teachers with negative attitude and low self-efficacy. Paper presented at the Annual International Conference of the National Association for Research in Science Teaching, Orlando, FL.
Khourey-Bowers, C., & Simonis, D. G. (2004). Longitudinal study of middle grades chemistry professional development: Enhancement of personal science teaching self-efficacy and outcome expectancy. Journal of Science Teacher Education, 15(3), 175-195. http://dx.doi.org/10.1023/B:JSTE.0000047083.14197.b8
Lakshmanan, A., Heath, B. P., Perlmutter, A., & Elder, M. (2011). The impact of science content and professional learning communities on science teaching efficacy and standards-based instruction. Journal of Research in Science Teaching, 48(5), 534-551. http://dx.doi.org/10.1002/tea.20404
Lardy, C. (2011). Personal science teaching efficacy and the beliefs and practices of elementary teachers related to science instruction. University of California, San Diego, Publication Number: 3457727, Retrieved August 18, 2011 from, http://proquest.umi.com/pqdlink?Ver=1&Exp=08-28-2017
http://dx.doi.org/10.1002/(SICI)1098-2736(200003)37:3<275::AID-TEA4>3.0.CO;2-2
McDonnough, J. T., & Matkins, J. J. (2010). The role of field experience in elementary preservice teachers’ self-efficacy and ability to connect research to practice. School Science and Mathematics, 110(1), 13-23. http://dx.doi.org/10.1111/j.1949-8594.2009.00003.x
McGee, J. R. (2012). Developing and validating a new instrument to measure the self-effıcacy of elementary mathematics teachers. (Doctoral dissertation). Retrieved from Proquest. (Publication No. 3510218).
Pajares, F. (1992). Teachers’ beliefs and educational research: Cleaning up a messy construct. Review of Educational Research, 62, 307-332. http://dx.doi.org/10.3102/00346543062003307
Pajares, F. (1997). Current directions in self-efficacy research. In M. Maehr & P. R. Pintrich (Eds.). Advances in motivation and achievement (1-49), Greenwich, CT: JAI Press.
Posnanski, T. (2002). Professional development programs for elementary science teachers: An analysis of teacher self-efficacy beliefs and a professional development model. Journal of Science Teacher Education, 13(2), 189-220. http://dx.doi.org/10.1023/A:1016517100186
Rethlefsen, A. L., & Park, H. (2011). A mixed-methods study: Assessing the BAR model’s impact on preservice teachers’ efficacy beliefs. School Science and Mathematics, 111(3), 102-117. http://dx.doi.org/10.1111/j.1949-8594.2010.00067.x
Riggs, I., & Enoch, L. (1990). Toward the development of an elementary teacher’s science teaching efficacy belief instrument. Science Education, 74, 625-638. http://dx.doi.org/10.1002/sce.3730740605
Sackes, M., Hilson, M. P., Trundle, K. C., & Krissek, L. A. (2010). The relationship between content knowledge of earth and space science concepts and science teaching efficacy beliefs of in-service elementary and middle school teachers. Paper presented at the Annual International Meeting of the Association for Science Teacher Education, Sacramento, CA.
Stipek, D. J., Givvin, K. B., Salmon, J. M., & MacGyvers, V. L. (2001). Teachers’ beliefs and practices related to mathematics instruction. Teaching and Teacher Education, 17, 213-226.
http://dx.doi.org/10.1016/S0742-051X(00)00052-4
Swackhamer, L. E. (2010). Measuring mathematics specific teacher efficacy: Can a global instrument produce valid results? Paper presented at the 2010 American Educational Research Association Annual Meeting, Denver, CO. Swars, S. L., & Dooley, C. M. (2010). Changes in teaching efficacy during a professional development school-based
science methods course. School Science and Mathematics, 110(4), 193-202. http://dx.doi.org/10.1111/j.1949-8594.2010.00022.x
Tschannen-Moran, M., & Hoy, W. (2001). Teacher efficacy: Capturing an elusive construct. Teaching and Teacher Education, 17, 783-805. http://dx.doi.org/10.1016/S0742-051X(01)00036-1
Tschannen-Moran, M., Woolfolk, H. A. E., & Hoy, W. K. (1998). Teacher efficacy: Its meaning and measure. Review of Educational Research, 68, 202-248. http://dx.doi.org/10.3102/00346543068002202
Wainer, H., Bradlow, E. T., & Wang, X. (2007). Teslet response theory and its applications. New York, NY: Cambridge University Press. http://dx.doi.org/10.1017/CBO9780511618765
Woolfolk, H. A. E., & Hoy, W. K. (1990). Prospective teachers’ sense of efficacy and beliefs about control. Journal of Educational Psychology, 82, 81-91. http://dx.doi.org/10.1037/0022-0663.82.1.81