DOI: 10.9781/ijimai.2017.443
A Solution to the N-Queens Problem Using
Biogeography-Based Optimization
Ali Habiboghli and Tayebeh Jalali
Computer Science & Engineering Department, Khoy Branch, Islamic Azad University, Khoy, Iran
Abstract — Biogeography-based Optimization (BBO) is a global optimization algorithm based on population, governed by mathematics of biogeography, and dealing with geographical distribution of biological organisms. The BBO algorithm was used in the present study to provide a solution for the N-queens problem. The performance of the proposed algorithm has been evaluated in terms of the quality of the obtained results, cost function, and execution time. Furthermore, the results of this algorithm were compared against those of genetic and particle swarm algorithms.
Keywords — N-Queens Problem, Biogeography-based Optimization Algorithm, Evolutionary strategy.
I. I
ntroductIono
ptImIzatIonis a process of making something better. During this process the primary conditions are examined by different methods and the obtained data are used to make improvement in an idea or a method. Optimization is a mathematical tool which includes providing answers for many questions on how to solve different problems [2, 3]. Optimization deals with finding the best possible answer for a problem. Meta-heuristic algorithms simulate natural processes through stochastic optimization methods. The shorter the time and the lower the required quality of the answer, the better applying meta-heuristic approaches will be. In fact, meta-heuristic algorithms are subsets of approximate optimization algorithms which have exiting solutions from local optimization and are applicable on a wide range of problems [4].Biogeography-based algorithm (BBO) is an evolutionary algorithm that was originally introduced by Dan Simon in 2008 [1]. BBO is a novel global optimization algorithm based on biogeography theory within the domain of smart optimization dealing with geographical distribution of biological organisms. Mathematical models of biogeography describe speciation (the evolution of new species), the migration of species between islands, and the extinction of species. This algorithm has been used for single-target optimization of many criterion functions [7, 9] and solving a wide range of real-life optimization problems such as sensor selection for estimation of airplane engine efficiency [1] or categorization of satellite images [5].
Various approaches have been introduced so far as solutions to the N-queens problem, some of which are mentioned below:
In the paper [10] the heuristic algorithms have been used for solving the N-queens problem. Meta-heuristic algorithms such as genetic algorithm, simulated refrigeration algorithm, and forbidden search have been applied to solve this problem. The reference [11] describes application of the genetic algorithm with various patterns for solving the N-queens problem. The paper [12] deals with the effect of the particle swarm algorithm on generating an optimum solution for the problem.
Shuihua et al. [16] proposed two novel machine-learning based
classification methods. Their developed system includes, wavelet entropy (WE), principal component analysis (PCA), feed forward neural network (FNN) trained by fitness-scaled chaotic artificial bee colony (FSCABC) and biogeography- based optimization (BBO), respectively. They show that their proposed method is effective for fruit classification.
Mehran Tamjidy et al. [17] present an evolutionary optimization algorithm based on geographic distribution of biological organism to deal with hole-making process problem. The aim of their study is to minimize the none-productive time, including tool travelling time and tool switching time, by using biogeography-based optimization algorithm. Their obtained results show that the proposed algorithm can efficiently improve the solution quality in words of minimizing none-productive time.
Vanitha and Thanushkodi [18] used an effective biogeography-based optimization algorithm to solve economic load dispatch (ELD) problem. Their proposed algorithm has been applied to ELD problem for verifying its feasibility and the convergence of EBBO is presented.
Saremi and Mirjalili [19] used biogeography-based optimization algorithm for integrating chaos. Their results show that chaotic maps are able to improve the performance of biogeography-based optimization algorithm.
There are different methods for solution of N-queen problem [13, 14, 15]. Also it has been applied different optimization methods for solution of N-queen problem such as particle swarm optimization (PSO), Genetic algorithms (GA) but BBO algorithm has not been used for this aim yet.
In this paper we used BBO algorithm for solution of N-queen problem and we compare performance of BBO algorithm with PSO and GA algorithms. Our comparisons are based on cost and execution time in mention of queen numbers.
The second section of the present paper deals with general principles of BBO evolutionary algorithm. The third section is focused on evaluation of the BBO algorithm and its comparison against GA and PSO algorithms. The fourth section is a conclusion to this study and ultimately some suggestions for future trends are given at the end of the paper.
II. B
Iogeography-B
asedo
ptImIzatIonIslands with a high HSI have a low immigration rate because they already host many other species and cannot receive new members. Islands with a low HSI have a high immigration rate because of their low populations. Immigration of new species to habitats with high HSI may lead to increase in HSI in that area, since hospitability of a place depends on its geographical diversity. Application of biogeography for optimization was initially focused on using a natural process to solve an optimization problem. Similar to other evolutionary algorithms such as GA which are always associated with certain operators like mutation and selection, in BBO algorithm the operators of migration and mutation result in desirable changes in the trend of generations’ creation. As the suitability of a habitat rises, the number of species and emigration rate increase, whereas immigration rate decreases [1].
Any habitat (solution) in BBO has an immigration rate (ג) and
an emigration rate (µ) which is used in the form of possibility to share data between the solutions and are calculated by the following relations:
(1)
(2)
where I and E represent maximum rates of immigration and emigration respectively, k(i) is the number of species in ith habitatwhich ranges from 1 to n that is the number of members in a certain population (n for the best solution and 1 for the worst solution).
Sudden mutations may change HSI in a habitat. Furthermore, they may make the number of species deviate from its balanced value. This issue is modeled in BBO as SIV mutation and the mutation rate is determined by probability of the number of existing species in the habitat.
(3)
Where mmax(maximum rate of mutation) is defined by user. Ps represents the probability that the habitat supports exactly S species. Excellent and hostile habitats will tend to mutation and change. This pattern of mutation results in more diversity in population.The stages of BBO algorithm can be summarized as follow: 1. Parameters initialization (assign initial values to the parameters); 2. Stochastic generation of primary solutions (habitats);
3. Obtaining the number of species, S, immigration rate, ג , and
emigration rate, µ, related to each habitat from HSI;
4. Modification of non-elite habitat based on immigration and emigration rates, and recalculation of migration operator and HSI; 5. For each habitat the probability of the number of habitants is
modified. Subsequently, each non-elite habitat is mutated, and then the mutation operator and the amount of HSI are calculated again for each habitat.
6. Iteration should start from step 3.
7. This cycle may end after predefined number of generations or when an acceptable solution is obtained.
taBLe I.
BBo aLgorIthmperformanceBystepImpLementatIonof 500 and popuLatIon of 30
Number of Queens 5×5 8×8 10×10 20×20 100×100 200×200
Cost Mutation = 0.02
05055/0 48750/0 88235/0 6491/8 157/63 874/214 Execution
time 146199/0 202645/0 263386/0 2181/0 8316/0 0146/2 Cost Mutation
= 0.04
04978/0 37754/0 48995/0 3467/8 339/64 678/213 Execution
time 170528/0 222510/0 282753/0 2213/0 1184/0 9796/1 Cost Mutation
= 0.06 05805/0 18492/0 58131/0 9745/8 398/63 870/213 Execution
time 152917/0 215785/0 288850/0 1986/0 8144/0 976/1 Cost Mutation
= 0.08 05709/0 22720/0 29223/0 2190/8 673/63 564/214 Execution
time 145144/0 211193/0 280975/0 2419/0 8416/0 0033/2 taBLe II.
BBo aLgorIthmperformanceBystepImpLementatIonof 500 and popuLatIon of 50
Number of Queens 5×5 8×8 10×10 20×20 100×100 200×200
Cost Mutation = 0.02
04901/0 13687/0 64436/0 2285/8 239/63 786/213 Execution
time 260871/0 394331/0 458567/0 4436/0 6989/1 7981/4 Cost Mutation
= 0.04
04978/0 10688/0 46647/0 0923/9 987/63 564/214 Execution
time 278102/0 388269/0 473595/0 5561/0 6927/1 2177/4 Cost Mutation
= 0.06
04901/0 21222/0 42099/0 9823/8 765/63 574/213 Execution
time 266770/0 388476/0 460342/0 5986/0 6929/1 2627/4 Cost Mutation
= 0.08
04940/0 11803/0 88235/0 4534/8 459/63 788/213 Execution
time 255299/0 380295/0 466751/0 5973/0 7208/1 9828/4 taBLe III
ga aLgorIthmperformanceBystepImpLementatIonof 500 and popuLatIonof 30
Number of Queens 5×5 8×8 10×10 20×20 100×100 200×200
Cost Mutation = 0.02
0008/0 454/0 9676/0 5664/6 541/48 369/101 Execution
time 010003/0 149606/0 260403/0 1080/0 1231/0 2098/0 Cost Mutation
= 0.04
0008/0 5636/0 024/1 9936/5 363/47 482/103 Execution
time 013432/0 178321/0 266426/0 1060/0 1826/0 1859/0 Cost Mutation
= 0.06
0008/0 3448/0 8716/0 9196/5 645/47 794/102 Execution
time 015204/0 126024/0 266711/0 1210/0 1718/0 2257/0 Cost Mutation
= 0.08
0024/0 4272/0 9624/0 7888/5 126/47 091/104 Execution
time 017084/0 151551/0 26134/0 1345/0 1678/0 2299/0 taBLe IV.
ga aLgorIthmperformanceBystepImpLementatIonof 500 and popuLatIonof 50
Number of Queens 5×5 8×8 10×10 20×20 100×100 200×200
Cost Mutation = 0.02
0 2392/0 7548/0 9614/5 359/48 026/102 Execution
time 018133/0 121314/0 311989/0 1521/0 2087/0 3027/0 Cost Mutation
= 0.04
0 2184/0 7956/0 8906/5 121/47 934/102 Execution
time 023361/0 115198/0 352058/0 1523/0 1817/0 3301/0 Cost Mutation
= 0.06
0 208/0 7104/0 0487/6 063/48 825/102 Execution
time 018361/0 125868/0 301072/0 1574/0 2274/0 3763/0 Cost Mutation
= 0.08 0 2692/0 7288/0 6512/5 019/47 985/103 Execution
taBLe V.
pso aLgorIthmperformanceBystepImpLementatIonof 50 and popuLatIonof 30
Number of
Queens 5×5 8×8 10×10 20×20 100×100 200×200
Cost W= 0.02
0004/0 50324/0 9344/0 567/4 149/39 536/96 Execution
time 023302/0 189087/0 305571/0 6545/0 9306/0 0916/1 Cost W=
0.04
0016/0 5578/0 0672/1 743/4 451/39 026/97 Execution
time 02245/0 243094/0 307073/0 7315/0 8441/0 1564/1 Cost W=
0.06
0004/0 5076/0 0594/1 941/4 226/39 984/96 Execution
time 025709/0 230874/0 309601/0 6371/0 7721/0 0802/1 Cost W=
0.08
0032/0 5252/0 1524/1 801/4 914/38 041/97 Execution
time 025855/0 23055/0 32764/0 5883/0 9941/0 0391/1
taBLe VI.
pso aLgorIthmperformanceBystepImpLementatIonof 50 and popuLatIonof 50
Number of
Queens 5×5 8×8 10×10 20×20 100×100 200×200
Cost W= 0.02
0 3092/0 601273/0 351/4 482/38 439/96 Execution
time 033574/0 206495/0 686414/0 8786/0 26302/1 6505/1 Cost W=
0.04
0 4744/0 842/0 466/4 026/38 540/96 Execution
time 032076/0 290509/0 566925/0 9998/0 1099/1 0183/2 Cost W=
0.06
0 3684/0 944/0 852/4 503/38 941/96 Execution
time 032369/0 30929/0 601719/0 9962/0 3091/1 9643/1 Cost W=
0.08
0 39/0 934/0 753/4 129/38 843/96 Execution
time 036943/0 298051/0 575719/0 9785/0 0723/1 8218/1
III. e
xperImentaLr
esuLtsThe N-queens puzzle is one of the classic problems with a long history [6]. The N-queens puzzle is the problem of putting N chess
queens on a ג chessboard such that none of them is able to capture
any other using the standard chess queen’s moves. In this section the results from implementing N-queens problem using BBO algorithm, and also comparison of its results with genetic (GA) and particle swarm optimization (PSO) algorithms will be discussed. Since all three algorithms are stochastic in nature, each of them has been repeated 500 times. The focus of the experiments was on the impact of variations in values of BBO parameters.
In this paper for study BBO algorithm performance in N-queen problem, we solve the problem with different queens. Our study has been done on 5, 8, 10, 20, 100, and 200. Due to BBO algorithm solution is produced such as most of other meta-heuristic algorithms stochastically so experiments are repeated 500 times and average of them is obtained in this 500 times.
Our experiments are based on effect of BBO algorithm change value. Condition of algorithm termination is reach to optimal answer and end of maximum repeat. BBO method is based on population. First, it is produced a random population for solution of N-Queen problem. This population is produced in mention of problem space (number of queens and number of population). After this main operation, BBO algorithm is performed. Then, the data is sorted for finding based possible solution. Finally, after doing these maximum solutions in population will been probability answer. Possible number of fulmination returns as cost in this method and it is written for cost function. If a solution breaks main condition of problem then it saves maximum value of fulmination as cost. For this reason, we are interested in finding optimal cost. Fig. 1
shows BBO algorithms cost function with 50 populations.
Fig 1. BBO cost function with 50 population.
Numbers of population selections are effective in optimal answer in population oriented meta-heuristic algorithm. A small number of population or unsuitable number of population selection has low variety answers so it decreases discovery power in search space and makes precocious convergence. On the other hand if number of population increases, then discovery power also increases. But more times it is required to get precocious convergence. So the number of population should be appropriate so that we can have desirable results in best time.
According to the obtained results from Tables 1 and 2, population growth leads to decrease in costs, but increase in implementation period. As the number of queens increases an appreciable increase is observed in both costs and implementation period. Variations in the mutation rate have no significant influence on costs. The following diagrams (Fig. 1) have been plotted taking 500 implementation steps and 10 queens into account.
In comparing BBO algorithm performance with GA and PSO algorithms, execution time and number of population are considered 500 and 30, 50, respectively in N-queen problem. Mutation rate are studied for 0.2, 0.4 0.6, 0.8. Results of GA and PSO algorithms are shown in tables 3, 4, 5, 6.
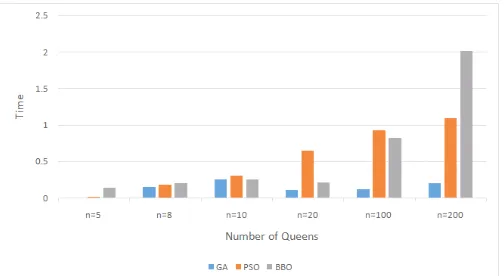
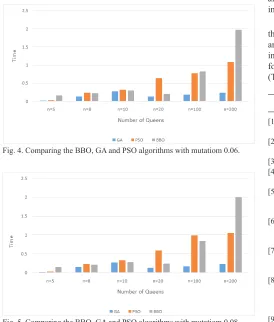
Fig. 2,3,4,5 show performance of BBO, GA and PSO algorithms with queen numbers and execution time for mutation rates 0.2, 0.4 0.6, 0.8. Mutation rates have little impact on performance of algorithm. But mutation rates 0.4 and 0.8 show best performance for the BBO algorithm.
Fig. 3. Comparing the BBO, GA and PSO algorithms with mutation 0.04.
Fig. 4. Comparing the BBO, GA and PSO algorithms with mutatiom 0.06.
Fig. 5. Comparing the BBO, GA and PSO algorithms with mutatiom 0.08.
By comparing PSO, GA, and BBO algorithms and considering the diagrams, it can be noticed that as the number of queen’s increases the performance of the BBO algorithm becomes better relative to PSO and GA algorithms, besides the implementation period will be shorter.
This algorithm has an advantage over others for solving the N-queens problem. However, this superiority can be held up to maximum 100 queens. As it can be seen from the diagrams, BBO shows a poor performance in the cases with more queens (200 and more). Moreover, the cost of the BBO algorithm is higher comparing with GA and PSO algorithms.
IV. c
oncLusIonThe obtained results from examination indicated capability of BBO for solving the N-queens problem. As the contrastive analysis of two algorithms showed, BBO algorithm is more accurate and quicker than
PSO. Comparing with GA algorithm, the more queens are there, the better the performance of the BBO algorithm will be. The performance falls with more queens (200 and more).
In comparing BBO algorithm with GA algorithm, GA algorithm has better performance. GA algorithm is better than BBO and PSO algorithm because of their execution time. Both BBO, GA algorithms have fast convergence. If convergence of PSO algorithm is fast, then it has not exit mechanism of local optimum trap. So, it selects local optimum as global optimum while BBO algorithm escapes local optimum and gets to optimum answer.
Considering the fact that BBO is a relatively newly-developed algorithm, a wide range of potential research fields can be proposed for this algorithm. For example we can integrate this algorithm with others to achieve better results. In order to obtain more accurate answers and shorten the time of implementation, other algorithms such as exact algorithms can be used to generate better primary solutions, hence to improve the performance.
BBO algorithm can be used for the optimization problem solution of the real world as image restoration, image segmentation, video coding and wireless sensor network. We suggest that BBO algorithm is used in above problems in future work. Also this algorithm can be applied for problem solutions that are NP-hard as travelling salesman problem (TSP).
r
eferences[1] Dan Simon, “Biogeography-Based Optimization”, IEEE Transactions on Evolutionary Computation, vol. 12, no. 6, Dec. 2008.
[2] R.L. Haupt and S.E. Haupt, “Practical Genetic Algorithms”, 2nd Edition, John Wiky& Sons Inc, 2004.
[3] P. Pedregal. “Introduction to Optimization”, Springer, New York Inc.,2004. [4] Talbi.EL-Ghazali, “Metaheuristics : From Design to Implementation”,
John Wily and sons, 2009.
[5] N. Johal, S. Singh, and H. Kundra, “ A hybrid FPAB/BBO algorithm for satellite image classification”, International Journal of Computer Applications, vol. 6, no. 5, pp. 31- 36, Sep. 2010.
[6] B.Y. Qu, J.J. Liang, P.N. Suganthan, “Niching particle swarm optimization with local search for multi-modal optimization”, Information Sciences 197 (2012) 131–143.
[7] M. Ergezer, D. Simon, D. Du, “Oppositional biogeography-based optimization”, In Proceedings of the IEEE Conferencon Systems, Man, and Cybernetics, IEEE, San Antonio,TX, USA, pp. 1035-1040,2009. [8] D. Du, D. Simon, M. Ergezer, “Biogeography-based optimization combined
with evolutionary strategy and immigration refusal”, In Proceedings of the IEEE Conference on Systems, Man, and Cybernetics,IEEE, San Antonio, TX,USA, pp. 1023-1028, 2009.
[9] H. Ma, S. Ni, M. Sun, “ Equilibrium species counts and migration model tradeos for biogeography-based optimization”, In Proceedings of the 48th IEEE Conference on Decision and Control, IEEE, Shanghai, China, pp. 3306-3310, 2009.
[10] Ivica Martinjak, Marin Golub, “Comparison of Heuristic Algorithms for the N-Queen Problem”, July 2007.
[11] K. D. Crawford, “Solving the N-Queens Problem Using Genetic Algorithms,” in ACM/SIGAPP Symposium on Applied Computing, 1992, pp. 1039-1047.
[12] Aftab Ahmed, Attique Shah, Kamran Ali Sani and Abdul Hussain Shah Bukhari, “Particle Swarm Optimization For N-Queens Problem“, Journal
of Advanced Computer Science and Technology, vol. 1, no. 2, pp. 57-63,
2012.
[13] Amooshahi A., Joudaki M., Imani M., and Mazhari N., “Presenting a New Method Based on Cooperative PSO to Solve Permutation Problems: A Case Study of n-Queen Problem,” in Proceedings of the 3rd International
Conference on Electronics Computer Technology, anyakumari, India, vol. 4, pp. 218-222, 2011.
[15] Draa A., Meshoul S., Talbi H., and Batouche M., “A uantum-Inspired Differential Evolution Algorithm for Solving the n-Queens Problem,” the International Arab Journal of Information Technology, vol. 7, no. 1, pp. 21-27, 2010.
[16] Wang, Shuihua; Zhang, Yudong; Ji, Genlin; Yang, Jiquan; Wu, Jianguo; Wei, Ling. 2015. “Fruit Classification by Wavelet-Entropy and Feedforward Neural Network Trained by Fitness-Scaled Chaotic ABC and Biogeography-Based Optimization.” Entropy 17, no. 8: 5711-5728. doi: 10.3390/e17085711
[17] Mehran Tamjidy , Shahla Paslar , B.T. Hang Tuah Baharudin , Tang Sai Hong , M.K.A. Ariffin, ”Biogeography-based optimization (BBO) algorithm to minimise non-productive time during hole-making process” , International Journal of Production Research , Vol. 53, no. 6, 2015. [18] Vanitha, M. and K. Thanushkodi, “An Effective Biogeography-Based
Optimization Algorithm to Slove Economic Load Dispatch Problem”, Journal of Computer Science, vol. 8, no 9, pp. 1482-1486, 2012 . [19] Shahrzad Saremi and Seyedali Mirjalili, “Integrating Chaos to
Biogeography-Based Optimization Algorithm “,International Journal of Computer and Communication Engineering, vol. 2, no. 6,November 2013.
Tayebeh Jalali received the B.Sc. and M.Sc. degree from department of computer Science & engineering, Khoy Branch, Islamic Azad University, Khoy, Iran in 2010, 2015 respectively. She is now with the Ministry of Education of Khoy, West Azarbayjan, Iran. Her research focuses on artificial intelligence, algorithms.