ISSN (online): 2349-6010
An MADM approach for Selection of a Facilities
Layout
Dr. G. Shashikumar Prof. B. Sarkar
Assistant Professor Professor
Department of Production Engineering Department of Production Engineering B.M.S. College of Engineering, Bangalore – 560 019, India Jadavpur University, Kolkata – 700 032, India
Prof. S. K. Sanyal
Professor
Department of Production Engineering Jadavpur University, Kolkata – 700 032, India
Abstract
In this paper, ELECTRE (Elemination et Choice Translating Reality) or Concordance Analysis is used for selecting a proper layout to suit a particular type of production system. The decision making becomes more complicated due to contradicting and conflicting nature of factors influencing Facilities Layout (FL) design. Various considerations need to be taken into account in this regard. The complexity is compounded when these considerations are conflicting by nature and they have units that cannot be compared on a same common scale (incommensurable units). Also, a FL problem cannot be claimed to have a best and a unique solution. But an improper selection of FL may eventually result in affecting firm’s productivity, quality of production and profitability. Hence, to effectively select a FL for a specified type of production, several factors will have to be considered simultaneously. The goal of the decision process is to evaluate alternative FLs based on the activities and their contribution to overall organizational goals. Hence in this paper the Multiple Attribute Decision Making (MADM) methodology ELECTRE is adopted to make an effective selection of a FL to suit the production process under study.
Keywords: MCDM Methodology, MADM, ELECTRE, CIM, FL Selection
_______________________________________________________________________________________________________
I. INTRODUCTION
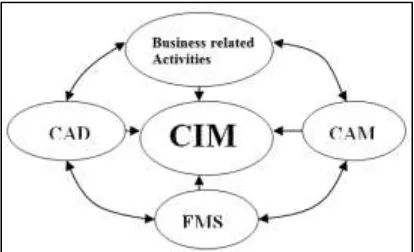
During the last three decades, manufacturing companies have seen an increased interest in the implementation of manufacturing philosophies such as Total Quality Management(TQM), Just-In-Time(JIT), Lean and Cellular Manufacturing, Manufacturing Resource Planning(MRP), Computer Aided Design(CAD)/Computer Aided Manufacturing(CAM)/Computer Aided Process Planning(CAPP). Modern industry demands products of superior quality, quantity on time at reduced cost. Hence an effort to coordinate different branches of manufacturing industry is need of the hour. Such an effort must be very flexible as well. With the enhanced but right use of computers in all the spheres of human activity including manufacturing, Flexible Manufacturing Systems (FMS) and Computer Integrated Manufacturing (CIM) are getting a stronger foot hold in the industry today. CIM includes Business related activities (Forecasting, Customer feedback, etc.,), CAD, CAM and FMS in it. The emergence of the new areas such as cognitive science is definitely aimed at solving various industry related problems. Perhaps, the best evolution in the field of manufacturing in the 20th century is CIM. It brings about a total coordination between all the wings of
manufacturing.
Thus, CNC/ DNC systems have become prominent tools in production process even in the developing countries. Advanced materials and advanced processes are being handled to precision with ease. As a result manufacturing costs have come down. This has eventually kindled competition as well. Industry circles are abuzz with phrases like ‘6-sigma manufacturing’, ‘Zero Defects’ etc.
II. PRIOR ART ON CHOICE OF FL
The selection of a proper FL for a manufacturing system is of tremendous importance for its effective utilization. This fact has been emphasized by Sule 1994 and Tompkins et.al. 1996. A poor layout can lead to accumulation of work-in-process inventory, overloading of material handling systems, inefficient setups and longer queues (Chiang and Chiang, 1998). But a FL problem cannot be claimed to have a best and a unique solution. Various attributes based on Area, Production, Material Handling and Cost involved influence the practical selection of a FL Traditionally FL approaches have been categorized on the basis of whether the approach is Quantitative such as CRAFT (Armour and Buffa 1963) or Qualitative such as SLP (Muther 1973). The aforementioned approaches are usually used separately for solving FL problems.
Given this scenario there is a pressing need to further cut down manufacturing costs, so that profit margins can be maintained without compromising on quality and reliability. There is an urgent task to quickly and precisely design and select a proper kind of FL to rapidly advance in the field of competition. Manufacturing of goods has to pass through 3 major areas of decision making viz., design, process planning and production. FL design and selection is question directly related to profitability o f a manufacturing organization. Parameters such as area, type of production, quantity & quality to be produced, material handling system used etc., govern the selection process of a FL. One of the core areas where cost reduction can be effectively done is that of arena of Facilties Layout (FL) selection. Various conflicting and contradicting factors that govern the design of a FL are to be handled efficiently. A good layout is claimed to save from 20% to 50% in investment costs.(Tomkins et.al 1996).
A number of studies have been conducted in the recent past. But of late researchers are questioning the appropriateness of selecting single criterion to solve FL problem because quantitative and qualitative approaches each have advantages and disadvantages (Houshyar 1991). Thus, the new field of Multi-Criteria Decision Making (MCDM) approach has gained wide acceptance that considers both objective reality and subjective ratings and also considers mutual effects of various conflicting and even contradicting factors. In such cases of conflicting demands and varying choices, the FL designer usually assigns relative priorities to the concerned parameters/factors and tries to arrive at a good and if not a best solution. Such is the significance of MCDM methodology. The MCDM methodology is broadly classified into two categories- Multiple Attribute Decision Making (MADM) and Multiple Objective Decision Making (MODM) on the basis of nature of criteria, constraints, usage etc.
III. MADM CONCEPT
MADM should have a set of quantifiable objectives; it also possesses a set of well-defined constraints and has a process to obtain some tradeoff information between the stated and unstated objectives. The methodology – ELECTRE(Elimination et Choice Translating Reality) or Concordance Analysis- is an MADM process. A MADM problem is expressed in matrix form.
Consider a MADM problem with ‘m’ criteria and ‘n’ alternatives. Let C1,C2,...Cm and A1,A2,....An denote criteria and
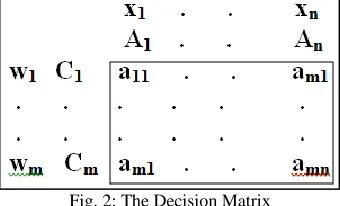
alternatives respectively. The standard feature of MADM methodology is the decision table as shown in Fig. 1. The score aij
describes the effect of the Criteria Ci on the performance of an alternative Aj. For the sake of simplicity we assume that a higher
score value means a better performance since any goal of minimisation can be easily transformed into a goal of maximisation. Weights w1, w2,....wm are assigned to each criteria depending upon their importance in decision making and values x1,x2,....xn are
associated with the alternatives in the decision matrix are used in Multi-attribute Utility Theory (MAUT) methods and are the final ranking values of the alternatives (Keeney and Raifa 1976). Further development of the methodology can be seen in Triantaphyllou.E 2000 and Figueira et al. 2004 for state-of-art surveys and further references.
Fig. 2: The Decision Matrix
IV. ELECTRE METHODOLOGY
Another method of MADM methodology is Outranking method proposed by Roy, 1968. ELECTRE method was originally introduced by Benayoun et.al. Since then Roy, Nijkamp, Van Delft et.al have developed this model to the present state. This method uses the concept of “Outranking Relationship”. The outranking relationship of Ak toAl shows that even though two
alternatives ‘k’ and ‘l’ do not dominate each other mathematically, the decision maker accepts the risk of regarding Ak as almost
surely better than Al. Through the successive assessments of the outranking relationships of the other alternatives the dominated
(IJIRST/ Volume 3 / Issue 03/ 007)
This method also consists of pair wise comparison of alternatives based on the degree to which evaluations of the alternatives and the preference weights confirm or contradict the pair wise relationship between alternatives. It examines both the degree to which the preference weights are in agreements with pair wise dominance relationships and the degree to which weighted evaluations differ from each other. These stages are based on a “Concordance and Discordance” set, hence this method is also called Concordance Analysis.
This method is considered as one of the best methods for a solution to a multi-criteria situation because of its simple logic, full utilization of information contained in the decision matrix and refined computational procedure (Hwang and Yoon, 1982).
V. PROCEDURAL STEPS
Step 1: List the set of FL alternatives (FL1 – FL4)
Step 2: Identification of Selection Criteria (Attributes) – (X1-X6)
Step 3: Develop Decision Matrix ‘M’ of alternatives and attributes [(4 X 6) matrix in the present case] .
Step 4: Determine preference weights ‘W’ by developing pair wise comparison matrix ‘P’ of attributes based on relative importance of each of the attributes on 9-point scale [(6 X 6) matrix in the present case].
Step 5: Calculate the Normalized Decision Matrix ‘R’ to transform various attribute scales into comparable scales.
m
i ij ij ij
ij i
j
x x r
where
r r
r r
R
1 2
1
1 1 1
... ...
... ... ... ...
... ... ... ...
. ... ...
Step 6: Develop Weighted Normalized Decision Matrix ‘V’. V=RWi where Wi= preference weights’ matrix = [w1, w2,……,wj]
Step 7: Determination of Concordance matrix ‘Cx’ and Discordance matrix ‘Dx’.
Firstly, Concordance Set ‘C’ and Discordance Set ‘D’ are to be ascertained.
For each pair of alternatives ‘k’ and ‘l’ (k,l=1,2,…..,m and k≠l), the set of decision criteria J j| j1,2,...,nis divided into
two distinct subsets. The Concordance Set Ckl of Ak and Al is composed of all criteria for which Ak is preferred to Al. In other
words, Ckl
j|xkj xlj
Concordanc eIndex .The complementary subset to the above set is Discordance Set, Dkl.
kj lj
klkl j x x J C
D |
Step 8: For the Normalized Weight Set Ckl
wjThe Concordance Index Ckl reflects the relative importance of Ak with respect to Al and 0Ckl 1. A higher value of Ckl
indicates Ak is preferred over Al. The successive values of the indices Ckl (k,l=1,2,….,m and k l) form the Concordance Matrix
‘Cx’ with (m X m).
1 1
2 2 1
1 1 2
...
.... ...
...
... ...
mm m
m m
x
C C
C C
C C
C
Note: Cx is generally not a symmetric matrix.
Calculation of Discordance Matrix: The Ckl reflects the relative dominance of a certain alternative over a competing
alternative on the basis of the relative weight attached to the successive decision criteria. So far no attention has been paid to the degree to which the evaluation of a certain Ak are worse than the evaluation of competing Al. Therefore, a second index called
the discordance index has to be defined:
lj kJ
lj kj kl kl
V V J j
V V D j d
max max
1
0dkl
and
A higher value dkl implies that, for the discordance criteria, Ak is less favourable than Al and a lower value implies Ak is
favourable to Al.
The discordance indices form Discordance matrix Dx (mXm) and generally it is an asymmetric matrix.
1 1
2 2 1
1 1 2
...
... ...
...
... ...
mm m
m m
x
d d
d d
d d
Step 9: Determine Concordance Dominance Matrix by finding out n C
C kl
where n= no. of elements in the concordance matrix.
Step 10: Determine Discordance Dominance Matrix by finding out n d D kl
where n= no. of elements in the discordance matrix.
Step 11: Determine Aggregate Dominance Matrix.
Step 12: Eliminate less favourable alternatives and select most favourable one.
VI. CASE STUDY
In a leadingmanufacturing firm for the production of automobile parts a suitable FL has to be chosen from amongst 4 alternative FLs. They are represented as FL1, FL2, FL3 and FL4. Six attributes are considered for each alternative FL. The attributes
identified as X1, X2, X3, X4, X5 and X6 are as follows:
X1: Cost of Designing the layout: (5.6 to 9.8) * 1000 USD
X2: Required Floor Area: (630 – 850 m2)
X3: Work-In-Process: (59-81 units)
X4: Manufacturing Lead time reduction: (19-32 mins.)
X5: Annual return on Investment: (3.5 to 8.9) * 1000 USD
X6: Number of machines handled: (3 – 5).
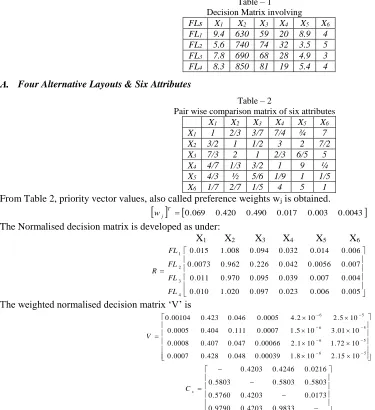
One set of specific jobs was considered for the case study under the four alternative layouts. For good estimation ideal processes are assumed. The decision matrix ‘D’ and pair wise comparison matrix ‘A’ are shown below in Tables 1 and 2 respectively:
Table – 1 Decision Matrix involving
FLs X1 X2 X3 X4 X5 X6
FL1 9.4 630 59 20 8.9 4
FL2 5.6 740 74 32 3.5 5
FL3 7.8 690 68 28 4.9 3
FL4 8.3 850 81 19 5.4 4
Four Alternative Layouts & Six Attributes
Table – 2
Pair wise comparison matrix of six attributes
X1 X2 X3 X4 X5 X6
X1 1 2/3 3/7 7/4 ¾ 7
X2 3/2 1 1/2 3 2 7/2
X3 7/3 2 1 2/3 6/5 5
X4 4/7 1/3 3/2 1 9 ¼
X5 4/3 ½ 5/6 1/9 1 1/5
X6 1/7 2/7 1/5 4 5 1
From Table 2, priority vector values, also called preference weights wj is obtained.
wj T
0.069 0.420 0.490 0.017 0.003 0.0043
The Normalised decision matrix is developed as under:
X1 X2 X3 X4 X5 X6
005 . 0 006 . 0 023 . 0 097 . 0 020 . 1 010 . 0 004 . 0 007 . 0 039 . 0 095 . 0 970 . 0 011 . 0 007 . 0 0056 . 0 042 . 0 226 . 0 962 . 0 0073 . 0 006 . 0 014 . 0 032 . 0 094 . 0 008 . 1 015 . 0 4 3 2 1 FL FL FL FL R
The weighted normalised decision matrix ‘V’ is
(IJIRST/ Volume 3 / Issue 03/ 007)
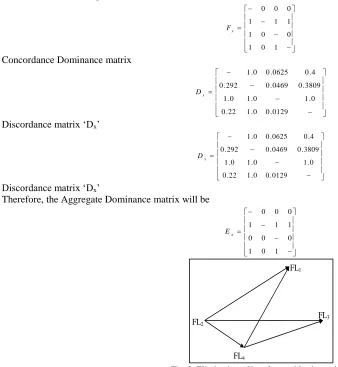
Concordance matrix ‘Cx’
1 0 1
0 0 1
1 1 1
0 0 0
x
F
Concordance Dominance matrix
0129 . 0 0 . 1 22 . 0
0 . 1 0
. 1 0 . 1
3809 . 0 0469 . 0 292 . 0
4 . 0 0625 . 0 0 . 1
x
D
Discordance matrix ‘Dx’
0129 . 0 0 . 1 22 . 0
0 . 1 0
. 1 0 . 1
3809 . 0 0469 . 0 292 . 0
4 . 0 0625 . 0 0 . 1
x
D
Discordance matrix ‘Dx’
Therefore, the Aggregate Dominance matrix will be
1 0 1
0 0 0
1 1 1
0 0 0
x E
Fig. 3: Elimination of less favourable alternatives.
VII.RESULTS AND DISCUSSION
From the above arrow diagram the unfavourable alternatives are eliminated and the most favourable one was found out to be FL2 and hence can be choosen as the appropriate FL for the present production system. The concordance analysis examines both the degree to which the preference weights are in agreement with pair wise dominance relationships and the degree to which the weighted evaluations differ from each other. The selected FL is the best among all the alternatives because it incurs least cost on designing. This layout takes a middle position as far as required floor area and WIP are concerned and handles maximum number of machines. This ELECTRE methodology can further be developed to perform more accurate elimination of less favourable alternatives. This can be done by acquiring subjective data from the decision maker.
VIII. CONCLUSION
While a number of alternative FLs are possible for a particular type of manufacturing process, it is important to find a more suitable one though it can never be claimed that the selected layout is the best and unique solution. This is due to the fact that various varieties factors govern the selection process (For eg. Objective & Subjective factors, conflicting & complementary factors etc) and also the factors have incommensurable units. Hence concordance analysis emerges as one of the favourable analytical tool.
REFERENCES
[1] Bhattacharya, A., Sarkar, B. & Mukherjee, S.K., 2006, Concordance Analysis of Welding Process.
[2] Bhattacharya, A., Sarkar, B. & Mukherjee, S.K., 2001, Selection of Welding Processes- A multiple Criteria Decision Making approach, Proceedings of National Symposium on Manufacturing Engineering in 21st Century, IIT, Kanpur, India, March 2-3, pp, 97-100.
[3] Dr.S.Bhattacharya, B.Sarkar, R.N.Mukherjee, ‘Selection a Conveyor Belt Under Multi-Criteria Decision Making Environment’, IE (I) Journal – MC, Vol.86, October 2005, p 140-144.
[4] E.S.Buffa, ‘Modern Production/Operation Management’, Wiley Eastern Limited, New Delhi, 1993.
[5] Figueira, J., Greco, S. & Ehrgott, M., 2004, (Eds. Multiple Criteria Decision Analysis: State of art surveys, Springer, New York.
FL2
FL3
FL4
[6] Hwang, C.L. & Yoon, K., 1982, Multiple Attribute Decision Making – A State of the Art Survey, Lecture notes in Economics and Mathematics, New York:Springer-Verlag.
[7] Houshyar.A. & Bringelson.G., 1991, Efficient models for Facilities Layout Problems, European Journal of Operations Research, 53, 1-13, 7. [8] Kusiak.A. & Heragu.S.S., 1987, The Facilities Layout Problems, European Journal of Operations Research, 29, 229-251.
[9] Muther, 1973, Systematic Layout Planning, CBI Publishing Company, Inc.
[10] Roy, B., 1968, Classement et choix en presence de points de vue multiple(la methode electre, RAIRO, 2, 57-75. [11] Sule, 1994, Manufacturing Facilities Location, Planning and Design, 2nd Edition, PWS Publishing Company. [12] T.L.Saaty, ‘The Analytical Hierarchy Process’, McGraw Hill New York, 1980
[13] T.L.Saaty, ‘How to make a Decision: The Analytical Hierarchy Process’, European Journal of Operations Research, Vol. 48, No.1, 1990, pp 9.26. [14] T.L.Saaty, J.W.France and K.R.Valentine, ‘Modelling the Graduate Business School Admissions Process’, Socio-economic Planning Sciences, Vol.25,
No.2, 1999, pp 155-162.