www.ijaer.in Copyright © IJAER 2019, All rights reserved Page 130
CORRELATION, PATH COEFFICIENT ANALYSIS AND GENETIC
VARIABILITY FOR ASSESSMENT OF YIELD AND ITS COMPONENTS
IN F1 HYBRID POPULATION OF SESAME (
Sesamum indicum
L.)
Rehab H.A. Abdel-Rhman1, Salah. A. Okasha2*, Ibrahim. M. Elareny1
1Oil crops Department, Agriculture research centre, Ismailia , Egypt
2Agronomy Department, Faculty of Agriculture, Suez Canal university, Ismailia , Egypt
*Corresponding Author
ABSTRACT
The current work was done during the two successive summer seasons 2016 and 2017 at Experimental farm of Agricultural Research Center, Ismailia, Egypt. Five genetically diverse sesame genotypes namely; A1B5(P1), H133A4(P2), line 363(P3), Shandaweel -3(P4), and Sohag(P5) were crossed in a half diallel breeding pattern to obtain ten F1 hybrids excluding reciprocals and were evaluated during summer season of 2017. The 15 genotypes viz, the 5 parents and 10 F1s were raised in a randomized complete block (RCB) design with three
replications. Highly significant differences were observed among genotypes for all studied traits. The performance of the parents P3, P4, P5, and the crosses P3×P4, P3 X P5, P4×P5 and P2×P3 were
the best genotypes for yield and its components. Mean squares for both general (GCA) and specific (SCA) combining ability were significantly higher for all the studied characters. The ratios of GCA/SCA were less than unit for plant height; capsules weight plant-1, 1000-seed weight and seed yield plant-1. While, in case of remaining characters the magnitude of SCA was
higher than GCA. This indicates presence of adequate amount of variation in parents and crosses. The three parentsP3, P4 and P5 could be considered as the best general combiners for seed yield.
However, the crosses P2×P5, P3×P4, and P3×P5 had the most desirable SCA effects for seed yield
www.ijaer.in Copyright © IJAER 2019, All rights reserved Page 131 effects will be useful for the improvement in yield of sesame through breeding program. High heritability in broad sense was observed for all studied traits.
Keywords: Sesame, diallel crossing, correlation, path analysis, genetic variability
INTRODUCTION
Sesame (Sesamum indicum L.) is the most important oilseed crop in the world after soybean, rapeseed, sunflower and groundnut (Alpaslan et. al., 2001). It’s known with various names such as sesamum, gingelly, til, simsim, etc (Prajapat et. al., 2014). It belongs to Pedaliaceae family having chromosome number as (2n=26) and is a self-pollinated crop with an average cross pollination may be to an extent of 4 to 5 percent. It is one of the world’s oldest spice as well as oilseed crop and it is native to tropic and sub tropic regions as well as adapted to temperate climatic zones of the world . It is cultivated in Asia from a period of over 5000 years (Ashri, 2007; Bedigian, 2010a; Troncoso et al., 2011).
Egypt and Sudan are the most important sesame producers in Africa (FAO, 2016). In Egypt, sesame is cultivated in an area of 40,239 Feddan (16284.14 hectares), with a production of 20.3 thousand tons and with an average productivity of about 500 kg (FAOSTAT,2015). Sesame is grown mainly for its seeds that contain about 50% oil and 25% protein (Burden, 2005). Sesame oil is highly resistant to oxidative deterioration even though oleic acid (43%), linoleic acid (35%), are the predominant fatty acids (about 80%) of sesame oil (Sharma et al., 2014 and Tripathi et al., 2017). Hence, it is called as the “Queen of Oilseeds” because of its excellent
qualities of the seed oil (Uzun et al., 2007).
The diallel technique or half diallel and lines × tester are in common use for evaluating genotypes in terms of their genetic parameters and combining ability. However, the diallel mating design had been used to quantify the nature of gene action which control traits and also to estimate GCA and SCA of parents and their crosses, respectively (Gao et al., 2013). The concept of GCA and SCA (Sprague, 1966) helps the plant breeder to evaluate the GCA and SCA effects of the parents and their crosses, and select superior combiners for heterosis breeding.
www.ijaer.in Copyright © IJAER 2019, All rights reserved Page 132 The principal aims of the present study, i) to estimate the general combining ability and specific combining ability of parental lines and their hybrids respectively, in a half diallel analysis ii) to study the nature and magnitude of heterosis, and iii) to study correlation, path analysis and genetic variability for assessment of yield and its components in sesame.
MATERIALS AND METHODS
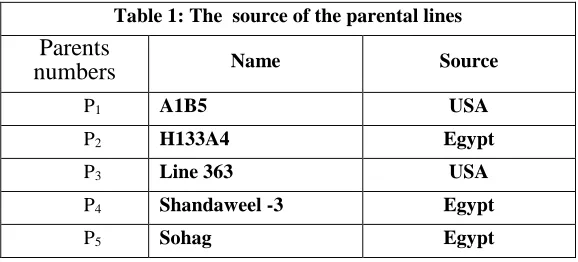
The experiments were conducted in the Department of oil seed crops research. All the possible crosses were made to obtain F1 hybrids excluding reciprocals through a 5×5 diallel fashion. Evaluation study was conducted during summer season 2017 at experimental farm of agricultural research center, Ismailia, Egypt. The details of pedigree and source of the parental lines used are given in Table (1).
The 15 genotypes viz, the 5 parents and progeny from 10 F1 crosses were raised in a randomized complete block (RCB) design with three replications. Each plot consisted of 2 rows, 3 m long adopting a spacing of 0.5 × 0.15 m. Plots were over-planted and thinned at 21 days after sowing to a final stand of approximately 21 plants in each row. Cultural practices for sesame production were conducted as recommended.
Table 1: The source of the parental lines
Parents
numbers Name Source
P1 A1B5 USA
P2 H133A4 Egypt
P3 Line 363 USA
P4 Shandaweel -3 Egypt
P5 Sohag Egypt
Data recorded:
Plant height, Fruit zone, number of branches/plant, number of capsules /plant, capsule weight/plant, 1000–seed weight, seed yield /kg, SPAD values and seed oil content. All data were collected on 10 random plants in each of the F1s and their parents.
Statistical analysis
www.ijaer.in Copyright © IJAER 2019, All rights reserved Page 133 least significance difference (LSD). Diallel analysis was conducted by the combining ability estimates determined according to Model I (fixed effect), Method II proposed by Griffing
(1956). Computer program software dial 98 (version, 2) analysis was used for estimating GCA
and SCA parameters (Ukai, 2002). The magnitude of heterosis was estimated for all studied traits, as the deviation of F1 mean from mid parent (M.P) and expressed as percentage.
Estimation of variance components: Genotypic (rg) and phenotypic (rp) correlation
coefficients were calculated according to the formula suggested by Johnson et al. (1955) and Singh and Chaudhary (1999). Heritability estimates were calculated according to Lush (1949),
whereas path coefficients analysis was made according to Dewey and Lu (1959).
RESULTS AND DISCUSSION
Mean performance of parents and their F1 crosses
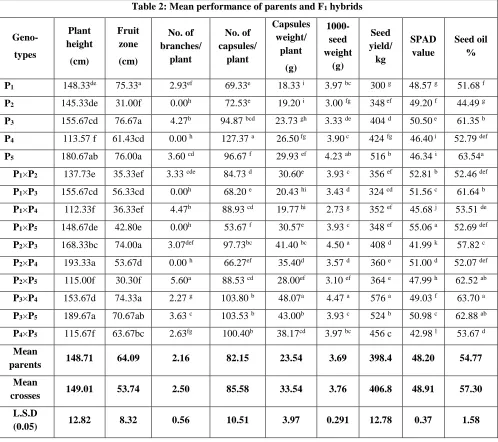
Mean performance of the five parents and their F1 crosses for all studied characters are listed in
Table (2). The parents P1, P3, P5and the hybrids P2×P4 (193.33), P3×P5 (189.67) P2×P3 (168.33)
and P1XP3 (155.67) were the tallest, while the parent P4 and the cross P1×P4 were the shortest.
For fruit zone length, the parents P3, P5 and P1 had the highest values, while P2 had the shortest
fruit zone. With regard to the crosses: the tallest fruit zone was achieved by P1×P5, P2×P3 and
P3×P5 while the hybrid P2×P5 and P4×P5 had the shortest. With regard to number of branches /
plant, the parent P3 was observed with the highest number of branches, while parents P2 and P4
haven't produced branches. With respect to the hybrids; the maximum nunmber of branches/plant was obtained from the crosses P2×P5, P1×P4 and P3 x P5 while the hybrids P2×P4, P1×P5 and
P1×P3 haven't produced any branches.
The number of capsules / plant were greatest in the parents P4, P5 and P3, while the parent P1
gave the least. The crosses P3×P4, P3×P5, P4×P5 and P2×P3 had a greater number of capsules /
plant, while P1×P5 and P2×P4 had few number of capsules / plant. With regard to capsule’s
weight / plant, the heaviest parents were P5, P4 and P3 while the lightest was parent P1. With
respect to the hybrids; the maximum capsule’s weight/plant was obtained from the cross P1×P4,
P1×P3, P2×P3 and P4 × P5 while the minimum was recorded by the hybrids P1×P4, P1×P3 and P2 ×
P5. With regard to 1000-seed weight, the heaviest was achieved by P5, P1 and P4 while, the
lowest was observed from parent P2. The heaviest seed weight of sesame cross was obtained
from the cross P2×P3, P3×P4 and P4×P5 while; the relatively lightest was from cross P1×P4. The
highest seed yield/kg was achieved by parents P5, P4 and P3, while P1 had the lowest yield.
Regarding the hybrids, the hybrids P3×P4, P xP5, P4 × P5 and P2 × P3 recorded the high values
than others. However, the lowest seed yield/kg was obtained from the cross P1 × P3. For SPAD
www.ijaer.in Copyright © IJAER 2019, All rights reserved Page 134 values for this trait. For oil content, the highest per cent values were achieved by parents P3, P4,
P5 and the hybrids P3 X P4, P3 X P5and P2 X P5.
Table 2: Mean performance of parents and F1 hybrids
Geno-
types
Plant height
(cm)
Fruit zone
(cm)
No. of branches/
plant
No. of capsules/
plant
Capsules weight/
plant
(g)
1000-seed weight
(g)
Seed yield/ kg
SPAD value
Seed oil %
P1 148.33de 75.33a 2.93ef 69.33e 18.33 i 3.97 bc 300 g 48.57 g 51.68 f P2 145.33de 31.00f 0.00h 72.53e 19.20 i 3.00 fg 348 ef 49.20 f 44.49 g P3 155.67cd 76.67a 4.27b 94.87 bcd 23.73 gh 3.33 de 404 d 50.50 e 61.35 b P4 113.57 f 61.43cd 0.00 h 127.37 a 26.50 fg 3.90 c 424 fg 46.40 i 52.79 def P5 180.67ab 76.00a 3.60 cd 96.67 f 29.93 ef 4.23 ab 516 b 46.34 i 63.54a
P1×P2 137.73e 35.33ef 3.33 cde 84.73 d 30.60e 3.93 c 356 ef 52.81 b 52.46 def P1×P3 155.67cd 56.33cd 0.00h 68.20 e 20.43 hi 3.43 d 324 cd 51.56 c 61.64 b P1×P4 112.33f 36.33ef 4.47b 88.93 cd 19.77 hi 2.73 g 352 ef 45.68 j 53.51 de P1×P5 148.67de 42.80e 0.00h 53.67 f 30.57e 3.93 c 348 ef 55.06 a 52.69 def P2×P3 168.33bc 74.00a 3.07def 97.73bc 41.40 bc 4.50 a 408 d 41.99 k 57.82 c P2×P4 193.33a 53.67d 0.00 h 66.27ef 35.40d 3.57 d 360 e 51.00 d 52.07 def P2×P5 115.00f 30.30f 5.60a 88.53 cd 28.00ef 3.10 ef 364 e 47.99 h 62.52 ab P3×P4 153.67d 74.33a 2.27 g 103.80 b 48.07a 4.47 a 576 a 49.03 f 63.70 a P3×P5 189.67a 70.67ab 3.63 c 103.53 b 43.00b 3.93 c 524 b 50.98 c 62.88 ab P4×P5 115.67f 63.67bc 2.63fg 100.40b 38.17cd 3.97 bc 456 c 42.98 l 53.67 d Mean
parents 148.71 64.09 2.16 82.15 23.54 3.69 398.4 48.20 54.77
Mean
crosses 149.01 53.74 2.50 85.58 33.54 3.76 406.8 48.91 57.30
L.S.D
(0.05) 12.82 8.32 0.56 10.51 3.97 0.291 12.78 0.37 1.58
Any cultivar or F1 hybrid seed from a cross or an inbred or pure line to be accepted by the
farmers for commercial cultivation, it should possess significant superiority in seed yield and it`s components over the best existing cultivar or F1hybrid from a superior cross or an inbred or pure line. In the present study, the performance of the parents P5, P4 and P3 and the crosses P3 × P4, P3
x P5, P4 × P5 and P2 × P3 were the best for yield and the most of the yield components studied.
www.ijaer.in Copyright © IJAER 2019, All rights reserved Page 135 in sesame (Muhammad & Sedeck, 2015; Shobha Rani et al., 2015; Pawar & Monpara, 2016; Ghule et al.,2017; Karthickeyan et al., 2017 and Karande et al., 2018).
Combining ability analysis
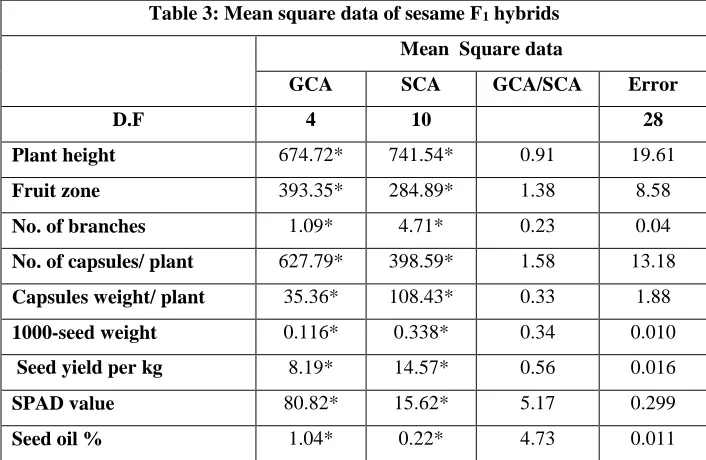
Analysis of variance for combining ability revealed that the mean squares due to GCA and SCA were highly significant for all studied traits (Table. 3). This indicated that both additive and non-additive gene action played a role in determining various characters in sesame hybrids studied. Thus, the importance of these two components of genetic variance cannot be underestimated for the improvement of sesame.
Table 3: Mean square data of sesame F1 hybrids
Mean Square data
GCA SCA GCA/SCA Error
D.F 4 10 28
Plant height 674.72* 741.54* 0.91 19.61
Fruit zone 393.35* 284.89* 1.38 8.58
No. of branches 1.09* 4.71* 0.23 0.04
No. of capsules/ plant 627.79* 398.59* 1.58 13.18
Capsules weight/ plant 35.36* 108.43* 0.33 1.88
1000-seed weight 0.116* 0.338* 0.34 0.010
Seed yield per kg 8.19* 14.57* 0.56 0.016
SPAD value 80.82* 15.62* 5.17 0.299
Seed oil % 1.04* 0.22* 4.73 0.011
This suggests that the parents selected were potential due to observations with adequate amount of variability existed among the hybrids for most of the traits studied. The GCA / SCA ratio was less than unity for plant height, capsules weight / plant, 1000-seed weight and seed yield/plant. While, in case of remaining characters the magnitude of SCA was higher than GCA. This indicates presence of adequate amount of variation in parents and crosses. Also, both kinds of gene effects were important in controlling the inheritance of all the characters studied. These results accepted with Mungala et al. (2017), Tripathy et al. (2017) and Pandey et al. (2018).
Combining ability effects
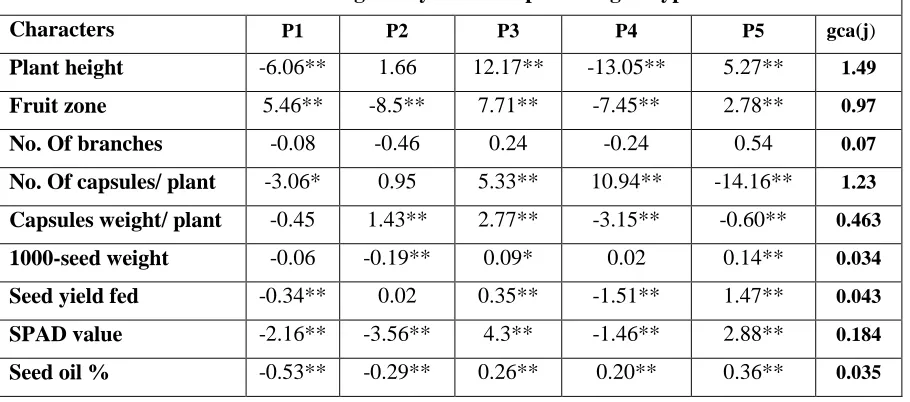
Estimates of the GCA effects of the parents and the SCA effects of the F1s are given in Table 4.
www.ijaer.in Copyright © IJAER 2019, All rights reserved Page 136 positive GCA effect for fruit but highly significant negative GCA effect was found for plant height, number of capsules / plant, SPAD value, seed oil content and seed yield per kilogram. The parent 2 had highly significant positive GCA effect for capsule weight / plant, but highly significant negative GCA effect was found for fruit zone / plant, 1000-seed weight, SPAD values and per cent seed oil (%). The parent 3 had significant positive GCA effect for all studied characters. The parent 4 had highly negative significant GCA effect for plant height, fruit zone, capsules weight / plant, seed yield/ kg and SPAD values. The parent 5 had highly significant positive GCA effect for plant height, fruit zone, 1000-seed weight, seed yield /kg, SPAD value and per cent seed oil (%), but highly significant negative GCA effect was recorded for plant height, number of capsules/ plant and capsules weight/ plant. These results are in agreement with Abd El-Kader et al. (2017), Mungala et al. (2017), Tripathy et al. (2017) and Pandey et al. (2018).
Table 4: General combining ability effects of parental genotypes in sesame
Characters P1 P2 P3 P4 P5 gca(j)
Plant height -6.06** 1.66 12.17** -13.05** 5.27** 1.49
Fruit zone 5.46** -8.5** 7.71** -7.45** 2.78** 0.97
No. Of branches -0.08 -0.46 0.24 -0.24 0.54 0.07
No. Of capsules/ plant -3.06* 0.95 5.33** 10.94** -14.16** 1.23
Capsules weight/ plant -0.45 1.43** 2.77** -3.15** -0.60** 0.463
1000-seed weight -0.06 -0.19** 0.09* 0.02 0.14** 0.034
Seed yield fed -0.34** 0.02 0.35** -1.51** 1.47** 0.043
SPAD value -2.16** -3.56** 4.3** -1.46** 2.88** 0.184
Seed oil % -0.53** -0.29** 0.26** 0.20** 0.36** 0.035
The estimates of SCA effect and mean performance for the cross combination of various traits are given in Table 5.
Of the ten crosses for plant height, four crosses showed significant positive and four crosses showed significant negative SCA effects. The highest positive SCA effect was revealed from the cross P2×P4 (55.81) followed by P3×P5 (23.32), P2×P3 (5.59) and P3×P4 (5.63). The highest
negative GCA effect was observed in P2×P5(-40.84) followed by P4×P5(-25.47), P1×P4(-17.47)
and P2×P3 (-6.78). For fruit zone, five crosses exhibited significant positive SCA effect and five
www.ijaer.in Copyright © IJAER 2019, All rights reserved Page 137 (2.98). The highest negative SCA effects was recorded in P2×P5 (-21.17) followed by P1×P4
(-18.86), P4×P5 (-17.19), P3×P4 (-14.65) and P1×P3 (-14.03). Amongst hybrid combinations, 5
crosses showed significantly positive SCA effects and 5 crosses showed significantly negatives effects. The crosses P2×P4 (2.78), P3×P5 (2.43), P1×P3 (1.72), P4×P5 (0.95) and P1×P5 (0.76)
were having significantly positive SCA effects.
Of the 10 crosses, five hybrids expressed positive and significant SCA effects and thus those were good cross combinations, while, five crosses had significant and negative values for the trait “number of capsules / plant”. On the basis of SCA effects, the cross P2×P5(32.75) followed
by P1×P2(18.07), P1×P3(16.83), P4×P5(7.31) and P2×P3(7.02) were the best promising hybrids
for this trait. The highest negative SCA effect was observed in P2×P4(-30.06) followed by P3×P4
(-15.97), P1×P5 (-13.55) P3×P5 (-7.41) and P1×P4 (-3.38). Out of 10 crosses, seven crosses
exhibited positive SCA effects for capsules weight/ plant. The crosses P1×P2(16.88) followed by
P1×P3 (10.48), P2×P3 (6.99), P2×P4 (6.91), P3×P5 (5.79), P1×P5 (1.41) and P3×P4 (0.77) were
having highly significant SCA effects. Whereas three crosses were having significantly negative SCA effects. For 100-seed weight, four crosses exhibited significant positive SCA effect and three crosses showed significant negative SCA effects. The highest positive significant GCA effect was recorded inP2×P3 (0.87) followed by P3×P4 (0.63), P1×P2 (0.45) and P1×P5 (0.12).
The highest negative SCA effect was recorded in P1×P4 (-0.96) followed by P2×P5 (-0.59) and
P1×P3(-0.32).
The scrutiny of SCA effects for seed yield/kg found that three crosses recorded significant positive SCA effects. While, seven crosses were shows significant and negative SCA effect. The crosses P3×P4 (0.98), P1×P2 (0.41) and P3×P5 (0.39) were having significantly positive SCA
effects and they considered the best promising hybrids for this trait. For SPAD values, 6 crosses showed significantly positive SCA effects and 4 crosses showed significantly negatives effects. The crosses P1×P5 (5.29), P2×P4 (3.81), P1×P2 (2.66), P3×P5 (2.27), P3×P4 (1.51) and P1×P3
(1.10) were having significantly positive SCA effects for this trait. The perusal of specific combining ability effects revealed that seven hybrids exhibited significant positive effects for seed oil content. While, three crosses were shows significant and negative SCA effect. The hybrids P2×P5 (6.75), P3×P4 (4.42), P1×P3 (3.02), P1×P2 (1.71), P1×P4 (0.67), P2×P3 (0.63) and
P2×P4 (0.61) were promising for this quality trait. These results are in agreement with Ahmed
and Adam (2015), Abd El-Kader et al. (2017), Mungala et al. (2017), Tripathy et al. (2017)
www.ijaer.in Copyright © IJAER 2019, All rights reserved Page 138
Table 5: Specific combining ability effects of F1 progenies in sesame
F1 Hybrid
Plant height
Fruit zone
No. of branches
No. of capsules/
plant
Capsules weight/
plant
1000-seed weight
Seed yield/kg
SPAD value
Seed oil (%)
P1×P2 -6.78** 9.52** -1.85** 18.07** 16.88** 0.45** 0.41** 2.66** 1.71**
P1×P3 0.64 -14.03** 1.72** 16.83** 10.48** -0.32** -0.40** 1.10** 3.02**
P1×P4 -17.47** -18.86** -2.06** -3.38* -6.84** -0.96** -0.10* -2.94** 0.67**
P1×P5 0.54 8.90** 0.76** -13.55** 1.41* 0.12* -0.30* 5.29** -4.49**
P2×P3 5.59** 17.60** -2.17** 7.02** 6.99** 0.87** 0.06 -7.05** 0.63*
P2×P4 55.81** 12.43** 2.78** -30.06** 6.91** 0.00 -0.28** 3.81** 0.61*
P2×P5 -40.84** -21.17** -2.47** 32.57** -3.04** -0.59** -0.40** -0.36** 6.75**
P3×P4 5.63** -14.65** -2.39 -15.97** 0.77 0.63** 0.98** 1.51** 4.42**
P3×P5 23.32** 2.98* 2.43** -7.41** 5.79** -0.03 0.39** 2.27** -0.74**
P4×P5 -25.47** -17.19** 0.95** 7.31** -6.02** 0.07 -0.12* -3.86** -4.19**
sca(ii) 3.87 2.51 0.17 3.17 1.20 0.088 0.09 0.112 0.478
sca(ij) 1.93 1.25 0.08 1.58 0.60 0.044 0.05 0.056 0.239
ESTIMATION OF HETEROSIS
The aim of estimation of hybrid vigour (heterobeltiosis) in this study was to find out the superior combinations of parents giving the high score for useful traits with heterosis, for example seed yield and its components, for their future use in sesame breeding program. The magnitude of heterosis was measured in the current experiment as percent increase (+) or decrease (-) of F1
value through mid-parental (MP) values for all the nine characters presented in table 6.
Significant positive direction of heterosis is desirable goal for all the studied traits except plant height because short plant height is suitable for mechanical harvesting and lodging resistance.
The desirable hybrids for plant height were (P2×P4), (P3×P4), (P3×P5) and (P2×P3),based on mid
parent heterosisfor fruiting zone length were (P2×P3), (P1×P2), (P2×P4) and (P1×P5), number of
branches/plant were (P2×P5), (P1×P4) and (P1×P2) and for number of capsules/plant were (P2×P5),
(P1×P2), (P1×P3) and (P2×P3). The desirable hybrids for capsules weight/plant were (P1×P2),
(P1×P3), (P2×P3) and (P2×P4), based on mid parent heterosis. For 1000-seed weight, the desirable
hybrids were (P2×P3), (P3×P4) and (P1×P2). In case of seed yield/kg, the superior hybrids were
(P3×P4), (P3 ×P5), (P1×P2) and (P2×P3) based on mid parent heterosis. For SPAD values, among
www.ijaer.in Copyright © IJAER 2019, All rights reserved Page 139 P2×P4, P3×P5, P1×P3 and P3×P4. For seed oil content, the maximum positive heterosis value was
found in cross combinations P2×P5 (15.74%), P3×P4 (11.62%), P2×P3 (9.23%), P1×P2 (9.08%),
P1×P3 (8.99%) and P2×P4 (7.03%).
It can be concluded that the most desirable heterotic effects were shown by P3×P4, P3×P5, P1×P2
and P2×P3 exhibiting highly significant positive SCA effects for seed/ yield/kg and most of its
components. It is relevant to note that the crosses of parents with either poor × poor or good × poor general combining abilities also had significant heterosis though their average yields were lower as compared to the hybrids resulted from both parents with good general combing abilities and exhibited lower heterosis. It would, therefore, be desirable to select cross combinations based on mean values rather than based only on extent of heterosis. These results are accepted with observed results by Abd El-Kader et al. (2017), Chaudhari et al. (2017), Nayak et al. (2017), Karande et al. (2018) and Pandey et al. (2018).
Table 6: Heterosis of F1 progenies of sesame over mid parental value
Parental details of the F1 hybrid
Plant height (cm)
Fruit zone (cm)
No. of branches
No. of capsules/
plant
Capsules weight/
plant
1000-seed weight
(g)
Seed yield /fed (kg)
SPAD value
Seed oil (% )
P1×P2 -6.20 19.75** 2.82* 41.54** 156.13** 12.92** 9.88* 8.08** 9.08**
P1×P3 2.41 -25.88** -3.45** 26.11** 104.44** -5.94 -7.95 4.21** 8.99**
P1×P4 -14.22** -46.87** 3.42** -9.57** -11.82 -30.51** -2.76 -3.76** 2.46
P1×P5 -9.63** -1.76 -3.62** -7.47 26.66** -4.07 -14.71** 16.12** -8.56**
P2×P3 11.85** 37.46** 1.43 16.77** 92.86** 42.11** 8.51* -15.72** 9.23**
P2×P4 49.35** 16.12** 0.00 -33.70** 54.92** 3.38 -6.74 6.69** 7.03**
P2×P5 -29.45** -43.36** 3.47 74.16** 13.98 -14.29** -15.74** 0.49 15.74**
P3×P4 14.15** -38.02** 1.03 -23.74** 21.83** 23.50** 39.13** 1.24** 11.62**
P3×P5 12.78** -7.42 0.53 -3.63 42.24** 3.96 13.91** 5.30** 0.67
P4×P5 -21.38** -48.58** 1.08 1.74 -27.58** -2.46 -2.98 -7.33** -7.71**
SE of
Midparent 5.42 3.51 2.50 4.44 1.67 0.12 0.12 0.15 0.67
Phenotypic (p) and Genotypic (g) correlation coefficients:
www.ijaer.in Copyright © IJAER 2019, All rights reserved Page 140 coefficients (rg) were slightly higher than the phenotypic correlation coefficients (rp), indicating the masking effect of the environment in the total expression of the genotypes (Table 7).
The association between seed yield and its component characters indicated that the seed yield per feddan had positive and significant association with plant height, number of branches/plant, number of capsules/plant, 1000-seed weight and seed oil content (%). This clearly indicates that increased capsules per plant will increase seed yield and hence while making selection for yield more emphasis should be given to this character. Among inter genotypic correlations; plant height has positive and significant association with fruit zone, days to maturity, number of branches /plant and 1000-seed weight. Fruit zone has positive and significant association with number of capsules/ plant, capsules weight/plant, 1000-seed weight, SPAD values and per cent seed oil content. Capsules weight/plant has significant positive association with 1000-seed weight, SPAD values and per cent seed oil content.
Similar results were also observed by Saxena and Bisen (2017), Nayak et al. (2017), Karande et al. (2018) and Pandey et al. (2018).
Table 7: Phenotypic (rp) and genotypic (rg) correlation coefficients between nine traits in F1 progeny of sesame parental genotypes
v a ria bles Type of Corre lation Fruit zone (cm) No. of branc hes No. of capsules/ plant Capsules weight/ plant 1000-seed weight (g) Seed yield /fed (kg) SPAD value Seed Yield/ fed plant height
rp 0.52* -0.16 -0.56* 0.43* 0.36* 0.27* 0.27* 0.26*
rg 0.56* -0.17 -0.61* 0.45* 0.39* 0.29* 0.30* 0.29*
fruit zone
rp -0.02 0.25* 0.34* 0.52* 0.23* 0.21* 0.02
rg -0.01 0.26* 0.35* 0.53* 0.24* 0.23* 0.06
no. of branches/
plant
rp 0.05 -0.09 -0.08 -0.32* 0.48* 0.21*
rg 0.07 -0.1 -0.09 -0.32* 0.49* 0.22*
no. of capsules
/ plant
rp 0.13 -0.17 -0.26* 0.04 0.43*
rg 0.15 -0.15 -0.27* 0.05 0.45*
capsules weight/
plant
rp 0.35* 0.31* 0.32* 0.06
rg 0.40* 0.33* 0.33* 0.09
1000-seed weight
rp -0.15 0.27* 0.52*
rg -0.16 0.30* 0.57*
SPAD value
rp -0.04 -0.24*
rg -0.05 -0.26*
www.ijaer.in Copyright © IJAER 2019, All rights reserved Page 141
oil % rg 0.59*
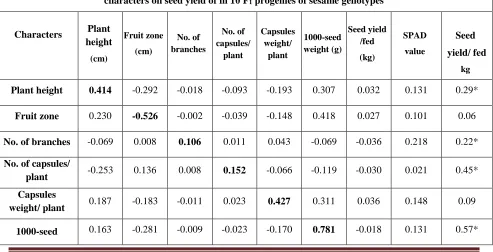
Path coefficient analysis
The results of path coefficient analysis based on genotypic correlation coefficients are presented in Table 8.
1000-seed weight/ plant (0.781) followed by seed oil content (0.442), capsules weight per plant (0.427) and plant height (0.414) showed highly positive direct effects on seed yield/ feddan at genotypic correlation. However, number of branches/plant (0.106) and numbers of capsules/plant (0.152) exhibited positive direct effect of low magnitude on seed yield per feddan. Whereas the fruit zone (-0.526) showed negative direct effects on seed yield /plant and non-significant positive correlation with seed yield/feddan. In this study, the residual effect (0.5197) was high value in magnitude which showed that some other important yield contributing characters which contributed to yield had to be included.
The indirect effects between characters showed positive and negative effects with low magnitude on seed yield per feddan. The indirect effects had not only supported the low magnitude direct effect but also resulted in high significant positive correlation with seed yield. Similar results were in harmony by Ibrahim and Khidir (2012), Bamrotiya et al. (2016) and Saxena and Bisen (2017).
Table 8: Estimates of direct (bold diagonal) and indirect effect (off diagonal) at genotypic level for different characters on seed yield of in 10 F1 progenies of sesame genotypes
Characters Plant height
(cm)
Fruit zone (cm)
No. of branches
No. of capsules/
plant
Capsules weight/
plant
1000-seed weight (g)
Seed yield /fed (kg)
SPAD value
Seed
yield/ fed
kg
Plant height 0.414 -0.292 -0.018 -0.093 -0.193 0.307 0.032 0.131 0.29*
Fruit zone 0.230 -0.526 -0.002 -0.039 -0.148 0.418 0.027 0.101 0.06
No. of branches -0.069 0.008 0.106 0.011 0.043 -0.069 -0.036 0.218 0.22*
No. of capsules/
plant -0.253 0.136 0.008 0.152 -0.066 -0.119 -0.030 0.021 0.45*
Capsules
weight/ plant 0.187 -0.183 -0.011 0.023 0.427 0.311 0.036 0.148 0.09
www.ijaer.in Copyright © IJAER 2019, All rights reserved Page 142
weight
SPAD value 0.118 -0.126 -0.034 -0.041 -0.140 -0.126 0.110 -0.020 -0.26*
Seed oil (%) 0.123 -0.120 0.052 0.007 -0.143 0.232 -0.005 0.442 0.59*
RESIDUE=0.5197
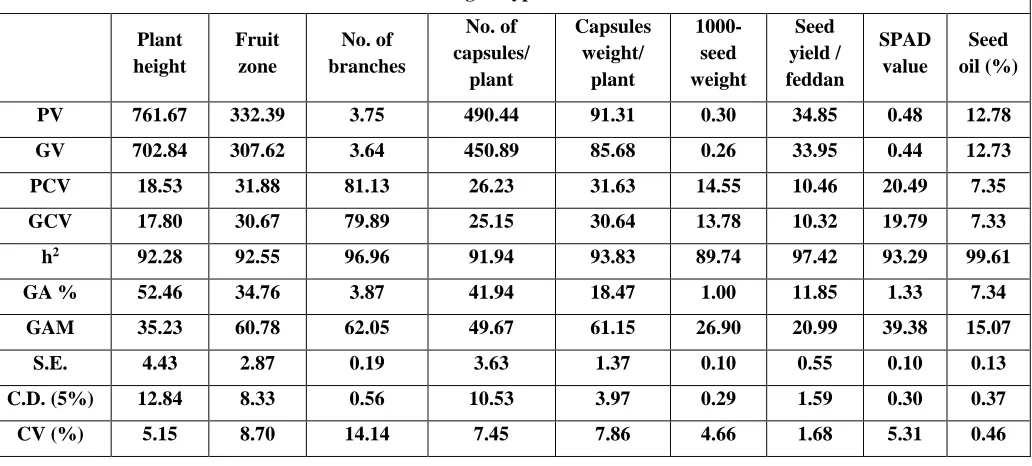
Variability and heritability parameters
Estimates of genotypic (σ2g), phenotypic (σ2p) and environmental (σ2e) variances and
phenotypic coefficients of variation (PCV) and genotypic coefficients of variation (GCV) are given in Table 9. The phenotypic coefficients of variation (PCV) ranged from 7.35 for seed oil % to 81.13 for number of branches per plant. Similarly, genotypic coefficients of variation (GCV) ranged from 7.33 for seed oil % to 79.89 for number of branches per plant.
According to Deshmukh et al. (1986), PCV and GCV values less than 10% are considered to be low, whereas values greater than 20% are regarded as high and values between 10% and 20% to be medium. Based on this delineation, phenotypic coefficient of variation (PCV) were recorded highest for number of branches/plant (81.13) followed by fruit zone (31.88), capsule weight/ plant (31.63), no. of capsules / plant (26.23) and SPAD Values (20.45) whereas, comparatively moderate for plant height (18.53), 1000-seed weight (14.55) and seed yield / feddan (10.46) and lower for seed oil % (7.35).
The highest GCV were observed for the number of branches/plant (79.89) followed by fruit zone (30.67), capsule weight/ plant (30.64), number of capsules/plant (25.15) and SPAD values (19.79) whereas, comparatively moderate for plant height (17.80), 1000-seed weight (13.78) and seed yield/feddan (10.32) and lower for seed oil % (7.33). In this study the genotypic coefficient of variation (GCV) values were lower than that of PCV, indicating that the environment had an important role in the expression of these characters. Generally, quantitative characters are highly influenced by the environment. These results are in agreement with observations made by Siva et al., (2013), Tripathy et al. (2016) and Saxena and Bisen (2017).
www.ijaer.in Copyright © IJAER 2019, All rights reserved Page 143 values from 40-59% are medium and values less than 40% are low. High heritability was observed for seed oil content (99.61%), seed yield/feddan (97.42%), number of branches/ plant (96.96%), capsules weight/ plant (93.83%), SPAD values (93.29%), fruit zone (92.55), plant height (92.28%) number of capsules /plant (91.94%), seed yield/plant (91.94%) and 1000- seed weight (89.74%). The results are in agreement with the observations made by Siva et al., (2013), Saxena et al. (2016), Tripathy et al. (2016).
The estimates of expected genetic advance (Table 9) revealed that the maximum genetic advance was revealed from plant height (52.46), number of capsules/ plant (41.94) and fruit zone (34.76).The moderate genetic advance was observed for capsules weight/ plant (18.47) and seed yield per feddan (11.85), while 1000-seed weight (1.00), SPAD values (1.33), no. of branches per plant (3.87) and seed oil content (7.34) were reported to be with low genetic advance. Similar results were also reportedby Siva et al., (2013), Saxena et al. (2016) and Tripathy et al. (2016).
Table 9: Estimates of phenotypic (PCV) and genotypic (GCV) coefficient of variability, broad sense heritability (H2), expected genetic advance (GA) and genetic advance as percent of the mean (GA%) for 9 characters for F1 sesame
genotypes.
Plant
height
Fruit zone
No. of branches
No. of capsules/
plant
Capsules weight/
plant
1000-seed weight
Seed yield / feddan
SPAD value
Seed oil (%)
PV 761.67 332.39 3.75 490.44 91.31 0.30 34.85 0.48 12.78
GV 702.84 307.62 3.64 450.89 85.68 0.26 33.95 0.44 12.73
PCV 18.53 31.88 81.13 26.23 31.63 14.55 10.46 20.49 7.35
GCV 17.80 30.67 79.89 25.15 30.64 13.78 10.32 19.79 7.33
h2 92.28 92.55 96.96 91.94 93.83 89.74 97.42 93.29 99.61
GA % 52.46 34.76 3.87 41.94 18.47 1.00 11.85 1.33 7.34
GAM 35.23 60.78 62.05 49.67 61.15 26.90 20.99 39.38 15.07
S.E. 4.43 2.87 0.19 3.63 1.37 0.10 0.55 0.10 0.13
C.D. (5%) 12.84 8.33 0.56 10.53 3.97 0.29 1.59 0.30 0.37
CV (%) 5.15 8.70 14.14 7.45 7.86 4.66 1.68 5.31 0.46
CONCLUSIONS
Additive and non-additive types of gene action were playing the major role in inheritance of all the studied traits in sesame. Most of F1 crosses were higher than their parents in their
performance for most studied traits. The three parental P3, P4, and P5, could be considered as the
www.ijaer.in Copyright © IJAER 2019, All rights reserved Page 144 had the most desirable specific combining abilities (S.C.A effects) for seed yield/plant and most studied characters and the same crosses also showed the highest heterosis percentage over the mid-parental values for seed yield. The indirect effects between characters showed positive and negative effects with low magnitude on seed yield/feddan. High heritability in broad sense was observed for all studied traits.
REFERENCES
Abd El-Kader, M. T. M., Fahmy, R. M., El-Shaer, H. F. A. &Abd El-Rahman, M. A. (2017). Genetic analysis of six parental sesame genotypes for yield and its attributes in F1 crosses. J. Basic Environ. Sci., 2(1), 190-209.
Ahmed, S. B. M. & Adam, S. I. (2014). Combining ability for yield and its components in six parents and their 15 F1 hybrids of sesame (Sesamum indicum L.) in half diallel mating design. J. Plant Breed. Crop Sci., 6(12), 179-184.
Alpaslan, M., Boydak, E., Hayta, M., Gerçek, S.& Simsek, M. (2001). Effect of row space and irrigation on seed composition of Turkish Sesame (Sesamum indicum L.). Journal of the American Oil Chemists' Society, 78(9), 933-935.
Ashri, A. (2007). Sesame (Sesamum indicum L.). In: Singh RJ (ed) Genetics resources, chromosome engineering and crop improvement, Vol 4. Oilseed Crops, CRC Press, Boca Raton, Florida.
Bamrotia, M.M.; Patel, J.B.; Malav, A.; Chetariya, C.P.; Ahir, D.; and Kadaria, J. (2016). Genetic variability, character association and path analysis in sesame (Sesamum indicum
L.). international Journal of Agriculture science; 8 (54).2912-2916.
Bedigian, D. (2010). Characterization of Sesame (Sesamum indicum L.) germplasm: critique.
Genetic resources and crop evolution, 57(5), 641-647.
Burden, D. (2005). Sesame profile. mhtml:file://C:\Documents and Settings\userl\Desktop \Crop Profiles.mht (15/01/08).
Chaudhari, M. H.; Patel, S. R.; Chaudhari V. B. and Nayak, A. J. (2017). Studies the magnitude of heterosis for seed yield and its components in sesame (Sesamumindicum L.). Int. J. Develop. Res., 7(8): 14282-14288.
www.ijaer.in Copyright © IJAER 2019, All rights reserved Page 145 Dewey, D.R. and Lu, K.K. (1959). A correlation and path analysis of components of crested
wheat grass seed production. Agron J. 51: 515-518.
FAOSTAT (2015). Food and agricultural organization of the United Nations. Statistical Database, 2015.
Gao W, Baars JJ, Dolstra O, Visser RG, Sonnenberg AS (2013). Genetic variation and combining ability analysis of bruising sensitivity in Agaricus bisporus. PLoS ONE.; 8:e76826. https://doi.org/10.1371/journal.pone.0076826 PMID: 24116171
Ghule, V. B.; Misal, A. M.; Shinde, D. D.; Ghodke, N. S. and Durge, S. M. (2017). Studies on heterosis in sesame (Sesamum indicum L.). Curr. Agric., 1(1): 18-22.
Griffing, B. (1956). Concept of general and specific combining ability in related to diallel crossing system. Austral. J. Bio. Sci. 9:463-493.
Hayman, B.I. (1954). The theory and analysis of diallel crosses. Genetics, 39: 789-809.
Ibrahim, S.E. and Khidir, M.O. (2012). Genotypic correlation and path coefficient analysis of yield and some yield components in sesame (Sesamum indicum L.) Int. J. Agri. Sci. 2(8):664-670.
Johnson, H.W.; Robinson, H.F. and Comstock, R.E. (1955). Estimates of genetic and environmental variability in soybeans. Agronomy Journal 47: 314-318.
Karande, G. R.; Yamgar, S. V.; Waghmode, A. A. and Wadikar, P. B. (2018). Exploitation of heterosis for yield and yield contributing characters in sesame (Sesamum indicum L.). Int. J. Curr. Microbiol. Appl. Sci., 7(2): 299-308.
Karthickeyan, S.; Anitha Vasline, Y. and Saravanan, K. (2017). Assessment of heterotic effects in sesame (Sesamum indicum L.). Pl. Arch., 17(2): 1707-1710.
Kobayashi, T.; Kinoshita, M.; Hattori, S.; Ogawa, T.; Tsuboi, Y.; Ishida, M.; Ogawa, S. and Saito, H. (1990). Development of the sesame metallic fuel performance code. Nucl. Technol. 89(2), 183-193.
Lush, J.L (1949). Animal Breeding Plans, The collegiate press, Ames, Iowa, 443p.
www.ijaer.in Copyright © IJAER 2019, All rights reserved Page 146 Muhammad, S.H.; Sedeck, F.Sh (2015). Combining ability and heterosis estimates in sesame.
World Applied Science Journal. 33(5):690-698.
DOI:10.5829/idosi.wasj.2015.33.05.14580.
Mungala, R. A.; Bhatiya, V. J.; Movaliya, H. M.; Savaliya, P. G. and Virani, M. B. (2017). Study of combining ability for seed yield and its component in sesame (Sesamum indicum L.).
Int. J. Pure App. Biosci., 5(4): 775-785.
Nayak, A. J.; Patel, S. R. and Shrivastva, A. (2017). Heterosis studies for yield and its components traits in sesame (Sesamum indicum L.). AGRES an Int. e-J., 6(1): 38-48.
Pandey, S. K.; Dasgupta, T.; Rathore, A. and Vemula, A. (2018). Relationship of parental genetic distance with heterosis and specific combining ability in sesame (Sesamum indicum L.) based on phenotypic and molecular marker analysis. Biochem Genet., published online on January 10, 2018 (https://doi.org/10.1007/s10528-017-9837-2).
Pawar A. K. and Monpara B. A. (2016). Breeding for components of earliness and seed yield in sesame, India. Plant Gene and Trait, 7(1): 1-7.
Prajapat, P. and Kumar, M. (2014). Analysis of genetic diversity in Sesamum genotypes using Randomly Amplified Polymorphic DNA Markers. Trends in Biosciences, 7(17), 2418-2424.
Sasikumar, B. and Sardana, S. (1990). Heterosis for yield and yield components in sesame (Sesamum indicum L.). Indian J. Genet., 50(1): 45-49.
Saxena, K. and Bisen, R. (2017). Genetic variability, heritability and genetic advance for the phenotypic traits in sesame (Sesamum indicum L.). international journal of pure and Applied Bioscience, 5(2):1126-1131.
Sharma, S. N.; Kumar, V.; Sharma, C.; Shukla, N.; Gupta, A.; Tripathi, A.; and Paroha, S. (2014). Characterization and analysis of genetic diversity in Indian Sesame (Sesamum indicum L.) genotypes. Indian Journal of Genetics and Plant Breeding, 74(3), 344-352.
Shobha Rani, T.; Kiran babu , T.; Madhukar rao, P.; Thippeswamy, S.; Kiran Reddy, G.; Soujanya, A. (2015). Heterosis studies in sesame (sesamum indicum L.) International Journal of Plant, Animal and Environmental Sciences. 5(3): 177-183. www.ijpaes.com.
www.ijaer.in Copyright © IJAER 2019, All rights reserved Page 147 Singh, B., (2001). Plant Breeding: Principles and Methods, 6th ed., Kalyani Publishers, New
Delhi, India.
Siva P, Y. V. N.; Krishna, M.S.R. and Venkateswarlu Y. (2013). Correlation, path analysis and genetic variability for economical characteristics in F2 and F3 generations of the cross AVT 3 × TC 25 in Sesame (Sesamum indicum L.). Journal of Environmental and Applied Bioresearch Department of Agricultural Botany, College of Agriculture, Pune, Maharashtra, India -411 005, Vol. 1 (2):14-18.
Sprague, G.F. (1966). Quantitative genetics in plant improvement. In: Plant Breeding I. (Edit.K. J.Frey), Iowa State Univ. Ames. pp.315-354.
Tripathy, S.K.; Mishra, D.R.; Mishra, D.; Dash, S.; Kartik, P.; Reshmi Raj, K.R.; Mohanty, M.R.; Mohapatra, P.M.; Mohanty, S.K. and Panda, S. (2017). Inter-relationship of mean performance, heterosis, combining ability and genetic divergence in sesame (Sesamum indicum L.). Int. J. Res. Biosciences, 6(1), 8-13.
Troncoso-Ponce M. A.; Kilaru, A.; Cao, X.; Durrett, T. P.; Fan, J.; Jensen, J. K.; Thrower, N. A.; Pauly, M.; Wilkerson, C. and Ohlrogge, J. B. (2011). Comparative deep transcriptional profiling of four developing oilseeds. The Plant Journal,68(6), 1014–1027.