http://www.sciencepublishinggroup.com/j/urp doi: 10.11648/j.urp.20170202.12
Spatial Analysis of Land Use Development Dynamics
Within Kenya’s Public Universities in the Devolved
Framework
Kibetu Dickson Kinoti
Department of Arts and Humanities, Chuka University, Chuka, Kenya
Email address:
[email protected]To cite this article:
Kibetu Dickson Kinoti. Spatial Analysis of Land Use Development Dynamics Within Kenya’s Public Universities in the Devolved Framework. Urban and Regional Planning. Vol. 2, No. 2, 2017, pp. 7-12. doi: 10.11648/j.urp.20170202.12
Received: May 9, 2017; Accepted: May 19, 2017; Published: July 5, 2017
Abstract:
University land use development is dictated by policy frameworks adopted at micro and macro management levels. Decentralisation of Public universities is driving urbanisation and ecological transformations. Currently there are no studies done on the role of development planning policies on universities land use and resource utilisation in Kenya. To bridge this gap, the study sought to comparatively analyse implications of Land Use and Land Cover (LULC) changes within Chuka and Karatina Universities Main campuses. Land use and cover change was taken as a proxy to understand land use developments across the two sampled campuses. To address this objective, the study used Geographic Information Systems (GIS) and remote sensing to analyse the dynamic interactions of the historical and present land uses between 2003 and 2015. Findings from the two case studies concluded that land use management is a product of university management council’s decisions and the national land policy framework provisions. The different administrative and development policies between the two university managements contributed to the varied land use patterns and management typologies. There is a need to develop a University Land Use Spatial Data Base (ULUSDB) to inform planning and development of land and related resources.Keywords:
Land Use and Land Cover, GIS, Policy Framework, Devolution, Universities1. Introduction
The education sector in Kenya spends an equivalence of 7 percent of the country’s Gross Domestic Products (GDP) translating into one of the highest expenditure levels for education GDP in Africa [1]. Despite these Government efforts, challenges relating to access and equity are truths worth attention especially in the realization of university education as social pillar in Kenya’s vision 2030. Reforms in higher education initiated by the Government between 2003 and 2013 saw the number of Public Universities increase from 6 to slightly over 23 state institutions. Although these reforms have translated into increased enrollment in state universities, shortage of infrastructure limit access to university education for a large number of qualified students [2]. One strategy adopted to improve access and by extension enrollment in public universities is to support development of these universities. Important resource in the realization of this vision is access to land for development of adequate
physical assets and other learning infrastructural services. Development comprises of physical entities encompassing real property, land, support infrastructure and physical facilities [3, 4]. These physical entities which have a spatial footprint are in form of new or converted buildings and land resources. In line with decentralizing higher education to regions lagging behind in enrollment, the Government has strived to establish a public university in all of the 47 counties.
Decentralization of higher education in Kenya to County levels is attracting unplanned urbanisation with a trail of observable effects on natural and human ecosystems [3]. Unsustainable land use practices, inadequate land development planning, uneconomical land sub divisions, encroachments as well as land use conversions are challenges slowing the attainment of Kenya’s social and economic development [2].
Land use changes and infrastructural developments taking place within these universities are a beginning point for a progressive large scale urbanisation process. If no sustainable local level land use development policy is in place, proliferation of informal settlements, urban sprawl and encroachment on university lands are the likely challenges these institutions will face. It is an acknowledged fact that urbanisation is an anthropogenic cause of landscape change globally with an estimated 809 km2 of agricultural land being converted to cities, roads and infrastructure annually [5]. Anthropogenic land use and land cover changes are common in developing countries due to increasing population, rapid urbanization and dependence on land based resources for livelihoods [11, 12, 13]. Universities in Kenya especially the newly chartered ones are becoming epicenters of human activities leading to urbanisation, local level migrations, land use conversions and micro socio-economic developments. Understanding the driving forces behind land use and associated developmental changes is a major challenge within change analysis studies globally [6, 14].
Most change science studies focus on assessing implications of land use and land cover on themes like deforestation, urbanisation, agriculture and environment [6, 15, 16].
A review of studies on policy analysis show existing works so far do not address land use and land development policy related outcomes [14, 17]. A Google search at studies done in Kenya on policy Analysis shows no related work is available on land use and development policy implications in state universities within the context of devolved governance.
Given this gap, there is a need for empirical studies focusing on policy implications of land use and development in Kenya’s state universities. This will monitor effective use of state land resources by Public universities for developments incongruence to their chartered mandates. Given the high number of state universities and increasing climate change related environmental risks, sustainable planning of land use and infrastructural development in universities will help in occupation health hazard mitigations. Understanding factors driving these changes is essential for policy planning and effective management of physical, educational and social facilities. Given the diverse ecological and geomorphological settings in which these institutions occur, it is imperative that spatial based studies be done to assess the dynamics of land uses. The aim of carrying out this study was to contribute novice
knowledge on how adoption and implementation of land use policies in Kenya’s state universities influence land development and related socio-economic transformations. This work evaluated land use and land cover change dynamics within/around Chuka and Karatina Universities between 2003 and 2015. By analysing land use and land cover changes between 2003 to 2015, the study sought to find out if there existed a causal link between observed spatial-temporal land use development changes and associated university management regimes. Due to lack of up to date spatial and temporal data on land administration in most state universities, dynamics of land use and development remains unclear. Under Vision 2030 land reforms, GIS based land information system is a necessary tool for the management of land related geospatial information. It is against this back drop the study sought to evaluate changes in public universities land use and development dynamics through GIS and remote sensing. Case studies of Chuka and Karatina university main campuses were used. By integrating geospatial tools in analysing the current land use practices within the two campuses, this study contributes partly to the development of national spatial data infrastructure. Such data sets are important for creating and populating state universities geospatial databases for effective management and administration of all geospatial related land information.
Specifically, the objectives of the study were: (1) Identify the nature of Land Use and Land Cover changes that occurred around Chuka and Karatina main campuses between 2003 and 2015, (2) Evaluate Land Use and Land Cover change dynamics and associated causes across the reviewed policy regimes. Geographic Information Systems (GIS) and Remote Sensing were used for they are a powerful set of geospatial tools for assessing spatial and temporal dynamics of LULC changes [9, 16, 18]. In this study, remote sensing provided multi-temporal data for understanding man-land interactions while GIS was used for mapping and change analysis.
2. Selection of Case Studies: Chuka and
Karatina Campuses
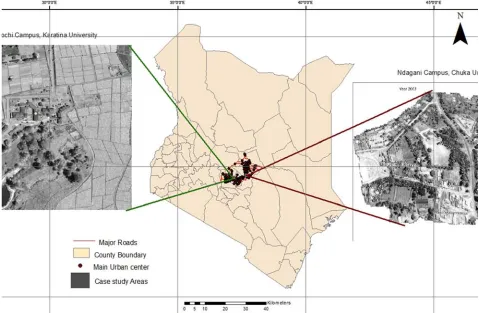
Chuka University’s Main Campus is located along the busy Meru-Nairobi highway about 11/2 km North of Chuka
forest complex. Although these two state universities are located near the equator and along the eastern slopes of Mt.
Kenya, they have different agro ecological settings and dissimilar land use developments (figure 1)
Figure 1. Location of the case study campuses.
3. Materials and Methods
3.1. Spatial data Acquisition and Management
Google Earth images for years 2003, 2013 and 2015 were used. These images were geo referenced to World Geodetic System 1984, Universal Transverse Mercator 37S and then re sampled to 30m pixel output images using nearest neighbourhood re sample method. For Chuka University the period from 2003 to 2013 represents a decade of spatial-temporal Land use and related development changes. Years 2011, 2013 and 2015 are periods believed to have distinct policy regimes and significant impacts on Land use and Cover changes at Karatina University as this facility transitioned from a campus to a university college then into a full chartered university. Intensive fieldwork was carried out in the study sites of Kagochi and Ndagani campuses between August 2015 and February 2016. Ground truth information collected was used in training land use/cover pixels for supervised classification. To help adequately identify existing land use and cover types in each of the two sites, a printed true colour composite image for year 2015 was used during field survey.
3.2. Training Sites Selection and Image Classification
Areas of Interest were subsetted from the re sampled images using Raster Clip tool in Arc GIS 10.1 Software. On screen
digitization of the sample training sites was then done in IDRISI Selva image processing software. Pixels from the training samples were used in developing spectral signatures. Maximum likelihood supervised classifier was then applied to come up with respective land cover maps. The developed Land Use and Land Cover types comprised of five classes of Built Up areas, Agriculture and Fallow, Wood lot and Vegetation, Open land, Roads and pavement for Chuka University and four classes of Tea crops, Built Up areas, Woodlot and open land for Karatina University respectively. Due to spectral similarity, most initial sub classes were merged to create few and basic classes showing little spectral signature similarity. To ensure maximum spectral coverage, 30 pixels were chosen randomly from each class where 10 pixels were used for each spectral band of the three spectral bands used.
3.3. Post Classification Analysis
difficult. To calculate the proportionate land conversions, Change Detection post classification analysis technique was used owing to its wide application in analysing Land Use and Land Cover changes [5, 16, 10, 18]. To quantify the changes that occurred between 2003 and 2015 period, image differencing and cross tabulations were used.
4. Results and Discussion
4.1. Land Use and Cover Developmental Changes
Karatina University experienced significant changes in
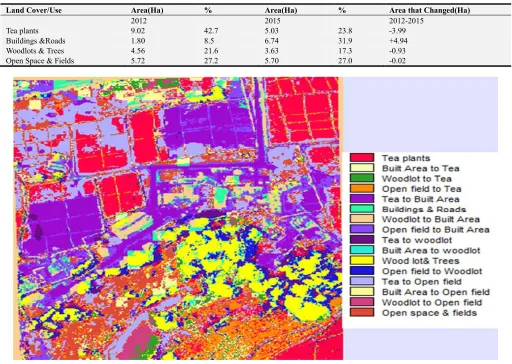
developmental land use in the period between 2012 and 2015. This was attributed to the anticipated hope of this institution being chartered to a full public university in mid 2013. In the year 2012 the main land use types were Tea plants, woodlots and open fields. Towards the end of 2012, student enrollments increased steadily as the allocation ratios to public universities was increased proportionately. The need for critical infrastructures pushed the university college administration to begin construction of more hostels and lecture halls. These constructions resulted to more land clearance (Table 1 & Figure 2)
Table 1. Cross-tabulated Land Use and Cover Changes between 2012 and 2015.
Land Cover/Use Area(Ha) % Area(Ha) % Area that Changed(Ha)
2012 2015 2012-2015
Tea plants 9.02 42.7 5.03 23.8 -3.99
Buildings &Roads 1.80 8.5 6.74 31.9 +4.94
Woodlots & Trees 4.56 21.6 3.63 17.3 -0.93
Open Space & Fields 5.72 27.2 5.70 27.0 -0.02
Figure 2. Generated Land Use and Land Cover Conversion Map of Kagochi campus for 2012-2015.
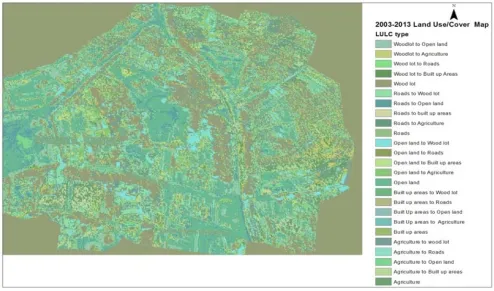
For Chuka university environs, the case was different with agriculture and fallow, woodlot and vegetation as well as open land dominating as the main land uses and cover types (Table 2 & Figure 3). Most changes in land use and land cover took place between 2007 and 2013. The rate of urbanisation increased as the university began infrastructural developments, increasing students’ enrollments and recruiting more staff.
Table 2. Land Use/Cover types and Areal covered between 2003 and 2013.
Land Use/Cover class Area (Ha) % Area(Ha) % Area Changed(Ha)
2003 2013 2003-2013
Open and Bare land 17.03 26.3 12.78 16.9 -4.25
Agriculture and Fallow 10.07 15.6 13.57 17.9 +3.50
Wood lot and Vegetation 34.15 52.7 34.09 45.1 -0.06
Built Up areas 0.86 1.3 6.01 7.9 +5.15
Figure 3. The Resultant Land Use and Cover Map of Chuka Main Campus for 2003 -2013.
4.2. Land Use Dynamics and Policy Related Causes
Major policy reforms in higher education lead to establishment of constituent colleges of public universities across the country. Government backed vision 2030 flagship infrastructures were imitated in all state universities as policy projects. The different priority projects undertaken in these universities influenced land use decisions. The rate of land
use and development did not occur symmetrically in the two case studies owing to different micro land use development policies adopted by each of these universities. A close examination of field study findings showed that rates of observed land uses variations were due Geophysical factors and demographic changes across the two case studies (table 3).
Table 3. Land Use Change and policy related causal factors.
Major Land use Nature of Change Policy Related change causal factors
Open and Bare land Decrease Physical factors, Population growth
Agriculture and Fallow Increase Land sale, More peri -urban Farming activities
Wood lot and Vegetation Decrease Construction activities, Creation of Roads
Built up areas Increase Economic activities, Topography, Population growth.
Roads and Pavement Increase Land subdivision, Human activities, topography
5. Conclusion
In Kenya, university land development and use is influenced by policies closely tied to the university’s mission and vision. Variations in the types of land uses and quantities as observed across Chuka and Karatina Universities was attributed to resource availability and land size owned by each institution. The growing urbanisation and land use conversions witnessed near university environs is causing population concentration in pockets around these entities. Increased rural and urban migrations, ecological transformations and upsurge of economic activities have been singled out as major implications of decentralizing university
References
[1] Ministry of Education Science and Technology. (2005). Kenya Education Sector Support Programme 2005–2010: Delivering Quality Equitable Education and Training to All Kenyans.
[2] Kenya Vision 2030. (2012). Sessional paper No. 10 of 2012 of Kenya Vision 2030.
[3] Kibetu, D. K, Nyaga. P., Mwangi, J. M and Muchiri, D. (2015). Analysing the Dynamics of Spatial Interaction and Socio-Economic Transformations around Chuka University, Main Campus Using Remote Sensing and GIS Techniques In: the proceedings of the 2nd International Chuka university Research conference, 28-30th, October 2015, Chuka.
[4] George. D. and Shelli. S. (2012) GIS in Education: Across Campuses, Inside Facilities: Esri press.
[5] Barnsley, M. J. and Barr, S. J. (1996). Inferring Urban Land Use from satellite sensor images using Kernel-Based Spatial Reclassification. Photogrammetric Engineering & Remote Sensing, 62(8), 949–958.
[6] Dewan, A. M. and Yamaguchi, Y. (2009). Land use and land cover change in Greater Dhaka, Bangladesh: Using remote sensing to promote sustainable urbanization. Applied Geography, 29 (3) 390–401.
[7] Hathout, S. (2002) The use of GIS for monitoring and predicting urban growth in East and West St. paul, Winnipeg, Manitoba, Canada. Journal of environmental management, 66: 229-238.
[8] Yang, X. and Lo, C. P. (2002). Using a time series of satellite imagery to detect land use and cover changes in the Atlanta, Georgia. International Journal of Remote Sensing, 23(9), 1775–1798.
[9] Lambin, E. F., Geist, H. and Lepers, E. (2003). Dynamics of land use and cover change in tropical regions. Annual Review of Environment and Resources, 28(41), 205–241.
[10] Serra, P., Pons, X. and Saurı, D.(2008). Land-cover and land-use change in a Mediterranean landscape: a spatial analysis of driving forces integrating biophysical and human factors. Applied Geography, 28(3), 189–209.
[11] World Bank. (2007). Dhaka: Improving living conditions for the urban poor. Sustainable Development Unit, South Asia Region, Report No. 35824-BD.
[12] Fox, J., Rindfuss, R., Walsh, S. and Mishra, V. (Eds.). (2003). People and the Environment. Approaches for linking household and community surveys to remote sensing and GIS. Boston, USA: Kluwer Academic Publishers.
[13] Slay maker, O., Spencer, T. and Embleton-Hamann, C. (2009). Geomorphology and global environmental change. New York: Cambridge University Press.
[14] Minetos, D. and Polyzos, S. (2010). Deforestation processes in Greece: a spatial analysis by using an ordinal regression model. Forest Policy and Economics, 12, 457-472.
[15] Caldas, M., Walker, R., Arima, E., Perz, S., Aldrich, S., and Simmons, C. (2007). Theorizing land cover and land use change: the peasant economy of Amazonian deforestation. Annals of the Association of American Geographers, 97(1), 86-110.
[16] Mundia. C. N and Aniya. M. (2005) Analysis of land use/cover changes and urban expansion of Nairobi city using remote sensing and GIS, International Journal of Remote Sensing 26(13), 2831–2849.
[17] Chavez, A. B. and Perz, S. (2013). Policy adoption, infrastructure upgrades, and land use plans: the case of Southeastern Peru, Geo forum, 50: 138-148.
[18] Rudel, T. (2005). Tropical forests: Regional paths of destruction and regeneration in the late twentieth century. New York: Columbia University Press.