R E S E A R C H
Open Access
Advanced method of global phase shift
estimation from two linear carrier
interferograms
Wenqing Sun
*, Ting Wang, Yun Zhao, Jun Wang and Quanying Wu
Abstract
Background:Phase-shifting interferometry is a kind of important technique used in optical interference metrology. This technique has high precision and good stability, which has been widely used in scientific research and industrial production.
Methods:This paper proposes a new method to estimate global phase shift from two interferograms. This method
performs algebraic calculation of two interferograms with the assistance of Hilbert transform. An iterative approach is used for the attempted phase to ensure that the minimum of assessment function is obtained.
Results:The simulated result indicate that the maximum calculation error of the global phase-shifting is 1.5%. And then we use experimental data to verify the performance of this method.
Conclusions:The method proposed in this article is simple but precise, and can cope with interferograms with uneven background and modulation, non-periodic apodization, and random noises. It does not require any specific carrier frequency of the measured interferogram or any adjustment of range of integration in accordance with the carrier frequency.
Keywords:Global phase-shifting, Fringes pattern, Hilbert transform, Iterative approach
Background
Phase-shifting interferometry (PSI) is a technique used in optical interference metrology. This technique has high precision and good stability, can be implemented through a variety of hardware, and has been consistently observed by researchers. Many algorithms have been developed to retrieve phase from a group of phase-shifted interfero-grams. Classical phase-shifting algorithms include fixed steps, variable steps, or random phase-shifting [1]. In re-cent years, researchers proposed a lot of interesting algo-rithms, including the two-frame phase shifting algorithms with regularized fringe pattern [2–4], the unknown or un-calibrated extraction algorithms [5,6], and the generalized phase shifting method [7], etc. On some occasions, global phase-shifting value is a known value. The estimated value can be provided through existing information from
previous measurements. However, many PSI algorithms need to calibrate the influence of phase-shifted errors from environment vibration, nonlinear response or unbalanced piezo-electric effect. In some other cases, global phase-shifting itself is unknown, which needs to be determined from a series of interferograms.
With respect to solutions of global phase-shifting values among interferograms, Farrell and Player pro-posed a method based on Lissajous figure fitting [8]. Brug proposed a method based on calculation of the correlation between two images [9]. Goldberg and Bokor, et al., proposed a method based on single-point Fourier transform [10], which calculates global phase-shifting by comparing the changes in power of the carrier frequency between two interferograms. However, all interference signals have limited length; carrier frequency is not a single frequency; spectral leakage may occur on the + 1 (or−1) order signal frequency spectrum. Calculated the power change in a single frequency, alone, cannot com-prehensively reflect the change in the global
phase-* Correspondence:[email protected]
Jiangsu Key Laboratory of Micro and Nano Heat Fluid Flow Technology and Energy Application, School of Mathematics and Physics, Suzhou University of Science and Technology, Suzhou, Jiangsu 215009, People’s Republic of China
shifting and cause the loss of calculation precision. Guo and Rong, et al., proposed an Energy-minimum Fourier Transform algorithm (EMFT) [11]. This method attempts to locate the best range of + 1 (or
−1) order signal frequency spectrum from the power spectrum, and therefore can increase the calculation precision for global phase-shifting under the same conditions. However, the interferograms from the measurements are affected by a variety of factors such as the effect of interferograms apodization, the uneven background, the signal envelope and the random noise. As a result, spectral aliasing may occur between the sideband of + 1 (or −1) order spectrum and zero order signal frequency spectrum. This issue significantly reduces the precision of the calculation results, especially when the carrier fre-quency is low. Therefore, some methods for zero order spectrum elimination or suppression were pro-posed [12, 13]. In recent years, methods with Hilbert
Transform (HT) and Hilbert-Huang Transform
(HHT), aided by Empirical Mode Decomposition (EMD) have been used to suppress the unevenness of background [14–16]. On one hand, this issue reduces the robustness of the algorithms; on the other hand, because the generation of interferograms are con-straint by the detector and hardware configuration, the choice of carrier frequency is not unlimited. In order to resolve this problem, Vishnyakov and Levin, et al., proposed a method to first do subtraction be-tween two interferograms and then perform the Fou-rier Transform. This can effectively avoid the spectral aliasing and preserve relatively high calculation preci-sion even when the carrier frequency is low [17, 18]. However, under this method, three interferograms are required for calculation, which limits its applicability.
In this paper, we propose a global phase shifting extraction method which is simple and direct. This method performs algebraic calculation of two inter-ferograms with the assistance of Hilbert transform, and inserts the attempted global phase shift value into assessment function for calculation. The process is repeated until the value of the global phase shift in determined. The proposed method has better preci-sion and robustness in scenarios of spectral aliasing or non-periodic apodization and potential applicabil-ity in various aspects of digital holography, interfer-ometry, surface metrology, etc. [19–22]. This paper introduces the theory behind the method, analyzes the accuracy and adaptability with numerical simula-tions and experiment.
Methods
A common expression for an interferogram can be written as:
It ¼a xð Þ þb xð Þcos½φð Þ þx kxþδm: ð1Þ
In which α(x) is the background, b(x) is amplitude modulation, kx is the carrier frequency, both of which are functions ofx.φ(x) represents phase distribution,δm represents the global phase shift at the mth measure-ment, which is the value to be estimated in this article. The algorithm in this article applies to scenarios with one-dimensional or two-dimensional interference sig-nals. One or more row/column of data needs to be se-lected to determine the global phase shift of the interferogram. Generally speaking, assuming that the background and the modulation intensities are un-changed in the entire phase shifting process, the inten-sity before and after the phase shift can be written as:
I1¼aþbcos½φþkx; ð2Þ
I2¼aþbcos½φþkxþδ: ð3Þ
The part of zero order frequency is background in-tensity. The possibility of spectral aliasing can be re-duced by eliminating uneven background. Subtract Eq. (3) from (2) and use trigonometric identities to get:
Im¼ðI1−I2Þ=ð Þ−2
¼b½cosðφþkxþδÞ−cosðφþkxÞ
¼bsin δ
2 sin φþkxþ
δ 2
ð4Þ
Ip¼ðI1þI2Þ=2
¼aþb½cosðφþkxþδÞ þ cosðφþkxÞ
¼aþbcos δ
2 cos φþkxþ
δ 2
ð5Þ
In which Im is generated after uneven background is
eliminated and can be seen as a cosine signal with enve-lope. Perform the Hilbert Transform and take its im-aginary part to obtain the cosine expression of Eq. (4). Because the Hilbert Transform of a sine signal takes the negative value of its cosine signal:
Imc¼−Η½ Im
¼bsin δ
2 cos φþkxþ
δ 2
:
In which H[⋅] represents the Hilbert Transform of the function; Take the phase shift value δ as the vari-able and incorporate Eqs.(5) and (6) to get:
Fð Þ ¼δ
Z
lIpð Þx −Imcð Þ x
cotðδ=2Þ
dx: ð7Þ
This is the test function for the determination of the global phase shift. Ip and Imc are functions of x;
the range of integral is the length of the entire signal
l. For discretely sampled signals, summation instead of integration is used. The value to be determined is
δ, the global phase shift corresponding to the mini-mum value of Eq. (7). The basic steps of the algo-rithm elaborated in this article include:
1. Capture two linear carrier interferograms, I1 and
I2, that include unknown global phase shift;
2. Calculate forIp,ImandImcin accordance with
Eqs. (4), (5), (6);
3. Set the initial value ofδand incorporate Eq. (7) to calculate the value of the assessment function; 4. Set the range forδand the step intervalΔδ, adjust
the value ofδ, and incorporateF(δ) for additional calculation;
5. Repeat this step until allF(δ) are solved;
6. Find the minimum value ofF(δ), which is the global phase shift to be determined.
Note that whenδ→2πn(n= 0,1,2,—), cot(δ/ 2)→∞. In this situation, this algorithm is invalid as there seems to be no phase shift between the two interferograms. The difference interferograms should be analyzed if this occurs. If only random noise exists and there is no periodic change in intensity, then it should be concluded that no phase shift occurs between the two interferograms.
Results and discussion
Numerical simulation
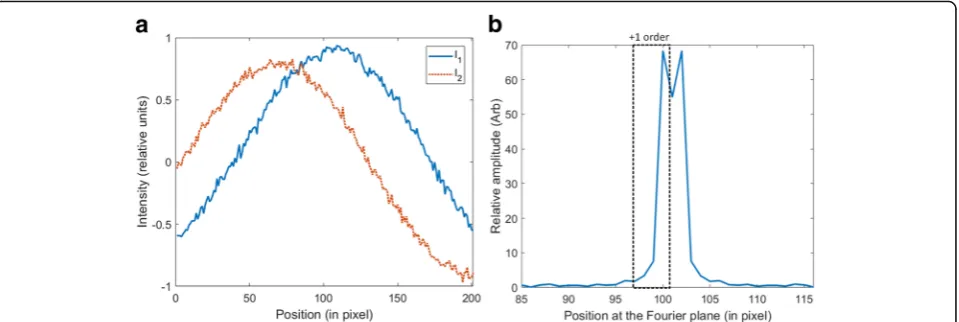
To confirm the validity of the method proposed in this article, we simulated a set of one-dimensional signals with relatively high carrier frequency, as shown in Fig.1a. The corresponding power spectrum of I1 is shown in
Fig. 1b. The range of the selected + 1 order frequency spectrum is marked in the figure. In the expression of this signal, α = -0.3x2, b=-0.3(x - 0.02)2+0.9, the phase distribution φ = 0.1x2, and the carrier frequency k = 6.6π. 3% random noise is added to this set of signals. The horizontal coordinates for this set of signals x ∈[–
1.02, 0.90]; the corresponding kx ∈[–6.7π,5.94π]. The cutoff point of the signal is not selected to be at the pos-ition of a full cycle of the carrier frequency. The enve-lope is not centrally symmetrical. The phase shift between the two interference signals is δ = π/3. Sam-pling includes 201 points. The odd number for the
Fig. 1High carrier frequency interference signal; part of the power spectrum curve ofI1and the range of the selected + 1 order window
sampling is for the easy search for central frequency under the EMFT method. The above described interfer-ence signal module is commonly seen in practice. The uneven background intensity is included in this pair of interferograms. The amplitude modulation differs at dif-ferent positions of the interference fringes. We can see from Fig. 1a that this set of interference signals include about 6 fringes. We call it a“high”carrier frequency sig-nal, in comparison with the signal described later in this article that includes only 0.5 fringes. It is relative in our discussion.
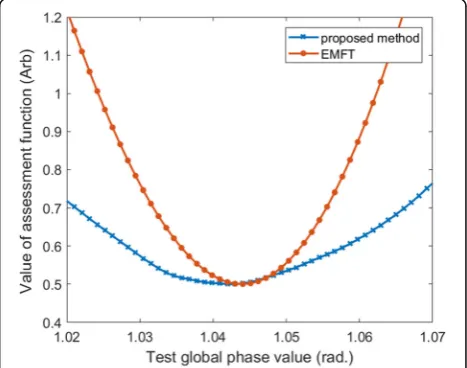
We move along the Y-axis the assessment function curve for the EMFT method in Fig. 2 for comparison with the assessment function for the method introduced in this article. As seen in the figure, the EMFT method can accurately capture the + 1 order when the carrier frequency is high. The global phase shift determined under the method in this article and under the EMFT method are respectively 1.044radand 1.045rad. Both are consistent with the set value.
When we keep the other parameters unchanged, de-crease the carrier frequency tok= 0.7π, and include ap-proximately 0.35 fringe in the entire signal, the two interference signal curves are shown as in Fig. 3a. The corresponding power spectrum is shown as in Fig.3b. In this scenario, the error will be greater than under EMFT if we perform calculation with the single point Fourier Transform method. Meanwhile, the EMFT method is useful to increase the precision of determination as it adjusts the location and the range of the integration based on different carrier frequencies, but its potential impacts on the assessment functions from inappropri-ately chosen windows are also evident. As the carrier frequency decreases, the + 1 order frequency spectrum is not readily determinable. We carefully select the range of the + 1 order frequency spectrum and mark it with a dotted square in Fig. 3b. Based on the + 1 order fre-quency spectrum range as shown in the figure, we use
the EMFT method to calculate the assessment func-tion and portray it, along with the result from the method from this article, in Fig. 4. As seen from the curves in the figure, the results from the two methods are patently different. The result from the method in this article is δ = 1.025rad, whereas the phase shift calculated from the EMFT assessment function is δ = 1.113rad. As our set phase shift value is δ = 1.047rad, the relative errors for the two methods are 2.1% and 6.3%. The comparison results show that the precision from the two methods are comparable if the fringes are relatively many; but as fringes are significantly fewer, the reported method is superior to the EMFT method in its functionality.
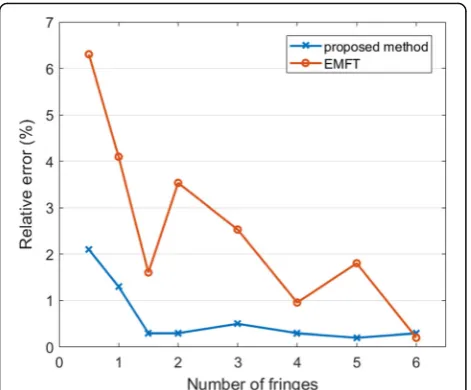
In order to further compare the relatively errors be-tween the two methods, we gradually increase the car-rier frequency of the simulated signal, i.e. to increase the number of the interference fringes, and perform calcula-tion based on the two methods. We report the relatively
Fig. 3Low carrier frequency interference signal; part of the power spectrum curve ofI1and the range of the selected + 1 order window
error curves in Fig.5. When the fringes are few, the cal-culation errors from both methods increase; as the fringes increase, the relative errors gradually decrease. Generally, the method in this article generates lower er-rors than EMFT; its curve depicting the change in error is rather flatter, showing that the error values are rela-tively stable. EMFT, in comparison with the method in this article, generates higher relatively errors; the fluctu-ation is also higher. The method introduced in this art-icle is evidently more advantageous, particularly, when the fringes are rare.
From the perspective of signal shapes, the above de-scribed simulated signals include various interfering fac-tors that may impact the calculation of global phase shifts, including, as documented in Literature ([21], 33– 34), unevenness in background intensity and modulation envelopes (α ≠ constant, b ≠ constant), low carrier fre-quency, signal noises, non-periodic apodization, and etc. For a linear carrier interferogram, if the signal is non-periodic, the sideband of the carrier frequency signal will be broader; if the carrier frequency is not high enough,
then it will spectrally aliased with the baseband signal. In practice, however, most interference signals are usu-ally not single frequency. The location of apodization is not readily selected for reasons such as background and modulation unevenness.
Experimental results
In this section, we will verify the performance of the al-gorithm with experiment data. A group of linear carrier interferograms with a Zygo GPI interferometer has been recorded. Fig. 6 shows these phase shift interferograms, the resolution of these images is 256 × 256 pixels. These interferograms do not have any pre-processed including filtering or background removal etc. For these interfero-grams, we perform calculation of data of each row and column between M1 (Fig. 6a) and M2 (Fig. 6b) with
method mentioned in the previous section. The global phase shift range to try into the Eq.7 should be [0, 2π], but in order to avoid infinity, we choose a variable range of [0.03π, 1.94π] and search step is 0.0047π. And the corresponding assessment function values of all rows and columns are shown in Fig.7aandbrespectively.
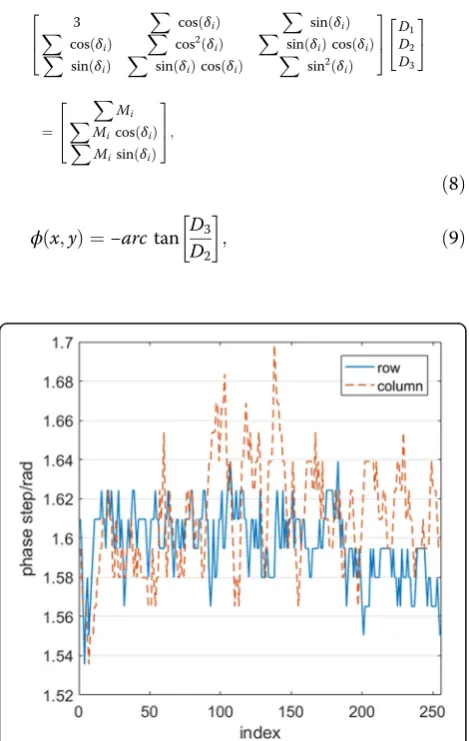
Each column data in Fig.7shows the assessment func-tion calculated from one slice data, x-axis indicates the phase step, and the color map means evaluation value. From the graph above, we can find the minimum point for each column in the graph, and display the result in Fig.8. The solid line in blue and the dot line in red are represent estimated phase step from each row and col-umn respectively. The RMS of two curves are 0.018rad
and 0.028rad, while the average values are 1.597radand 1.610rad. We use the average of the two averages as the final estimated global phase shift. The running time is 0.32s (mean of 10 independent runs) based on a com-puter with a 3.3GHz i5 CPU and 8GB RAM using MATLAB®.
Using the same method, we calculate the global phase step between M1 (Fig. 6a) and M3 (Fig. 6c),
and plot the result in Fig. 9. The result indicates the phase step between these two frame is 3.14rad. From
Fig. 5Comparison of relative errors
those three phase-shift interferograms, the sought phase distribution ϕ(x, y) can be extracted by the equations below.
3 Xcosð Þδi
X sinð Þδi X
cosð Þδi X
cos2ð Þδi X
sinð Þδi cosð Þδi X
sinð Þδi X
sinð Þδi cosð Þδi X
sin2δ
i
ð Þ
2 6 4
3 7 5 D1D2
D3
2 4
3 5
¼
X
Mi X
Micosð Þδi X
Misinð Þδi 2
6 4
3 7 5;
ð8Þ
ϕðx;yÞ ¼−arctan D3
D2 ; ð
9Þ
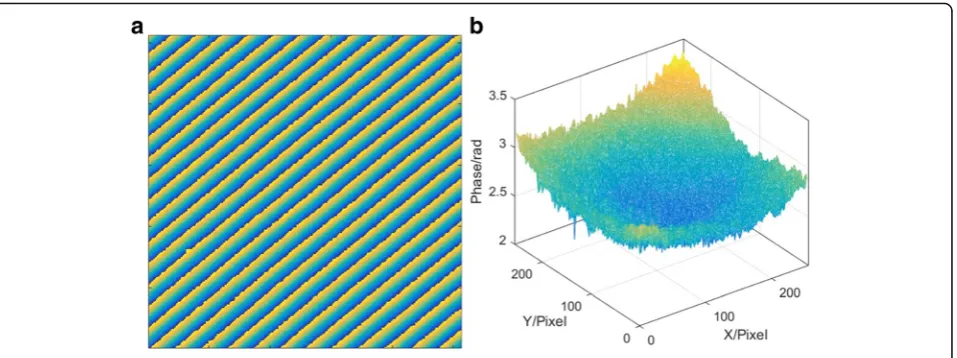
Where, i= 1,2,3,δ1= 0,δ2=1.6037rad, δ3= 3.146rad. The phase demodulation result for the considered experi-mental data is shown in Fig.10. The linear carrier frequency pattern has been removed from the unwrapping map.
Conclusions
This article reports a method to estimation the global phase shift with two interferograms. Compared with existing methods, this method requires no pre-filtering, nor does it have specific requirement for the carrier fre-quency of the interferograms. During the calculation, this method does not require the selection of a window for integration. It therefore increases the algorithmic adaptability and provides easy automatic processing. The
Fig. 7Assessment function value of each row and column. (a) row (b)column
Fig. 8Curves of estimated phase step from each row and column
method in this article may resolve the problem of global phase shift calculation when the interference signal faces a variety of factors such as nonperiodic apodization, un-even background and modulation. It also has better pre-cision and robustness than previous methods in scenarios of spectral aliasing between the + 1 order spectrum and the zero order spectrum. The method in this article can calculate the global phase shift with only two interferograms. We believe that this method has broad potential applicability in various aspects of inter-ferogram processing. And it could be extending to process the closed fringe patterns. In practice, this method can be used to screen out one or more sets of interferograms that meet the global phase shift needs from a series of interferograms for further calculation and analysis. This article provides the rationale and process of the calculation under this method, compares it with the existing method that needs Fourier Trans-form based on simulated interference signals, demon-strates the superiority of the method in this article, and confirms the precision of calculation with this method with data from experimental measurements.
Abbreviations
EMD:Empirical mode decomposition; EMFT: Energy-minimum fourier transform algorithm; HHT: Hilbert-Huang transform; HT: Hilbert transform
Acknowledgements
The authors are grateful to Jiangsu Key Laboratory of Micro and Nano Heat Fluid Flow Technology and Energy Application and Suzhou Key Laboratory for Precision and Efficient Processing Technology(SZS201712) for their support.
Funding
The work reported in this article is supported by the National Natural Science Foundation of China (11503017, 61378056); The“Summit of the Six Top Talents”Program of Jiangsu Province (2015-DZXX-026); Suzhou University of Science and Technology (XKQ201513); Suzhou Key Industry Technology Innovation Plan (SYG201646).
Availability of data and materials
Not applicable.
Authors’contributions
All authors read and approved the final manuscript.
Ethics approval and consent to participate
Not applicable.
Consent for publication
Not applicable.
Competing interests
The authors declare that they have no competing interests.
Publisher’s Note
Springer Nature remains neutral with regard to jurisdictional claims in published maps and institutional affiliations.
Received: 31 October 2017 Accepted: 15 February 2018
References
1. Malacara, D, Servin, M, Malacara, Z: Interferogram Analysis for Optical Testing. Marcel Dekker Inc., New York (1998)
2. Larkin, K: A self-calibrating phase-shifting algorithm based on the natural demodulation of two-dimensional fringe patterns. Opt. Express.9(5), 236 (2001) 3. Deng, J, Wang, H, Zhang, D, Zhong, L, Fan, J, Lu, X: Phase shift extraction
algorithm based on Euclidean matrix norm. Opt. Lett.38(9), 1506–1508 (2013) 4. Tian, C, Liu, S: Demodulation of two-shot fringe patterns with random
phase shifts by use of orthogonal polynomials and global optimization. Opt. Express.24(4), 3202–3215 (2016)
5. Xu, XF, Cai, LZ, Meng, XF, Dong, GY, Shen, XX: Fast blind extraction of arbitrary unknown phase shifts by an iterative tangent approach in generalized phase-shifting interferometry. Opt. Lett.31(13), 1966 (2006) 6. Bai, F, Liu, Z, Bao, X: Two-shot point-diffraction interferometer with an
unknown phase shift. J. Opt.12(4), 045702 (2010)
7. Xu, XF, Cai, LZ, Wang, YR, Yan, RS: Direct phase shift extraction and wavefront reconstruction in two-step generalized phase-shifting interferometry. J. Opt.12(1), 015301 (2010)
8. Farrell, CT, Player, MA: Phase step measurement and variable step algorithms in phase-shifting interferometry. Meas. Sci. Technol.3(10), 953– 958 (1992)
9. van Brug, H: Phase-step calibration for phase-stepped interferometry. Appl. Opt.38(16), 3549 (1999)
10. Goldberg, KA, Bokor, J: Fourier-transform method of phase-shift determination. Appl. Opt.40(17), 2886 (2001)
11. Guo, C-S, Rong, Z-Y, He, J-L, Wang, H-T, Cai, L-Z, Wang, Y-R: Determination of global phase shifts between interferograms by use of an energy-minimum algorithm. Appl. Opt.42(32), 6514 (2003)
12. Chen, W, Su, X, Cao, Y, Zhang, Q, Xiang, L: Method for eliminating zero spectrum in Fourier transform profilometry. Opt. Lasers Eng.43(11), 1267– 1276 (2005)
13. Cui, SL, Tian, F, Li, DH: Method to eliminate the zero spectra in Fourier transform profilometry based on a cost function. Appl. Opt.51(16), 3194– 3204 (2012)
14. Trusiak, M, Patorski, K, Wielgus, M: Adaptive enhancement of optical fringe patterns by selective reconstruction using FABEMD algorithm and Hilbert spiral transform. Opt. Express.20(21), 23463–23479 (2012)
15. Trusiak, M, Służewski,Ł, Patorski, K: Single shot fringe pattern phase demodulation using Hilbert-Huang transform aided by the principal component analysis. Opt. Express.24(4), 4221 (2016)
16. Wang, C, Kemao, Q, Da, F: Regenerated phase-shifted sinusoids assisted EMD for adaptive analysis of fringe patterns. Opt. Lasers Eng.87, 176–184 (2016)
17. Vishnyakov, G, Levin, G, Minaev, V, Nekrasov, N: Advanced method of phase shift measurement from variances of interferogram differences. Appl. Opt.
54(15), 4797–4804 (2015)
18. Vishnyakov, GN, Levin, GG, Minaev, VL: Measuring technique of a phase shift based on Fourier analysis of differential interferograms. Opt. Spectrosc.
118(6), 971–977 (2015)
19. Karray, M, Poilane, C, Gargouri, M, Picart, P: Mechanical behavior study of laminate composite by three-color digital holography. J Eur Opt Soc-Rapid Publ.13(1), 26 (2017)
20. Yu, G, Walker, D, Li, H, Zheng, X, Beaucamp, A: Research on edge-control methods in CNC polishing. J Eur Opt Soc-Rapid Publ.13(1), (2017) 21. Wang, W, Wu, B, Liu, P, Huo, D, Tan, J: Absolute surface metrology by shear
rotation with position error correction. J Eur Opt Soc-Rapid Publ.13(1), (2017)