www.adv-radio-sci.net/14/55/2016/ doi:10.5194/ars-14-55-2016
© Author(s) 2016. CC Attribution 3.0 License.
Advanced binary search pattern for impedance spectra classification
for determining the state of charge of a lithium iron phosphate cell
using a support vector machine
Patrick Jansen1,3, Michael Vollnhals1, Daniel Renner1,3, David Vergossen1, Werner John2,3, and Jürgen Götze3
1Audi Electronics Venture GmbH, Gaimersheim, Germany 2SiL GmbH – Paderborn/TU Dortmund, Dortmund, Germany 3Technische Universität Dortmund (AG DAT), Dortmund, Germany
Correspondence to:Patrick Jansen ([email protected])
Received: 16 December 2015 – Accepted: 19 May 2016 – Published: 28 September 2016
Abstract. Further improvements on the novel method for state of charge (SOC) determination of lithium iron phos-phate (LFP) cells based on the impedance spectra classi-fication are presented. A Support Vector Machine (SVM) is applied to impedance spectra of a LFP cell, with each impedance spectrum representing a distinct SOC for a pre-defined temperature. As a SVM is a binary classifier, only the distinction between two SOC can be computed in one it-eration of the algorithm. Therefore a search pattern is neces-sary. A balanced tree search was implemented with good re-sults. In order to further improvements of the SVM method, this paper discusses two new search pattern, namely a linear search and an imbalanced tree search, the later one based on an initial educated guess. All three search pattern were com-pared under various aspects like accuracy, efficiency, toler-ance of disturbtoler-ances and temperature dependancy. The im-balanced search tree shows to be the most efficient search pattern if the initial guess is within less than ±5% SOC of the original SOC in both directions and exhibits the best tol-erance for high disturbances. Linear search improves the rate of exact classifications for almost every temperature. It also improves the robustness against high disturbances and can even detect a certain number of false classifications which makes this search pattern unique. The downside is a much lower efficiency as all impedance spectra have to be evalu-ated while the tree search pattern only evaluate those on the tree path.
1 Introduction
As shown in Jansen et al. (2015) a support vector ma-chine (SVM) is a powerfull possibility to determine the state of charge (SOC) as defined in (Sauer et al. , 1999) of a lithium iron phosphate cell. Based on frequency domain data for a specific state of Health and defined temperature states. As an alternative to common SOC estimation methods such as the state space obserer or the kalman filter the SVM resigns an electric circuit diagram (ECD) with components such as the open circuit voltage curve and the element parameters of the electric network of said ECD (Piller et al. , 2001, Plett , 2004, Codeca et al. , 2008). The mentioned SVM and their charac-teristics have been discussed and it has been demonstrated that the method can correctly determine the SOC for a broad temperature range with respect to the signal to noise raito.
In order of further improvements on the SVM method this paper discusses two new search pattern, namely a linear search and an imbalanced tree search pattern, the later one being based on an educated guess start value for the SOC. All three search pattern are tested with a LFP cell by analyz-ing each impedance spectrum for every 10◦C temperature step from−30 to +40◦C and every 5 % SOC step from 0
to 100 %. While being trained with the measured impedance spectra the SVM is tested with an added disturbance to train-ing data.
w
·
x y
x3
x2 x1
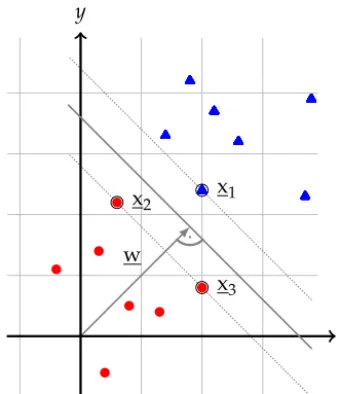
Figure 1. Support Vector Machine in 2-D space (Hearst et al. , 1998).
including was used. For optimization on SVM for SOC de-termination this paper discusses two new search algorithms, namely a linear search and an imbalanced tree search pattern are shown. These suggestions can improve several aspects of the SVM method like low successful classification rates at extreme temperatures.
2 Principle and methodology
The SVM is a binary classifier from the field of machine learning theory. The SVM is a support vector learning al-gorithm for pattern recognition, with the aim of classifying quantities with certain attributes and grade unknown samples to one of two classes. A binary support vector classifier such as the SVM is based on a class of linear hyperplanes, to sep-arate a number of elements into two specific classes, based on class specifying attributes using a hyperplane, see Fig. 1. The SVM is also applicable to non linear separable data, by using the so-called “Kernel Trick” to transform the data into a high-dimensional feature space where the data is linear sep-arable. The kernel depends on several usable funktions – for instance a polynomial or a radial basis function – to evaluate the hyperplane that separates the data in the feature space. A suitable kernel function has to be chosen specifically for the training data.
2.1 Impedance spectra classification
Impedance spectra classification is a valid technique to ob-tain information about electrochemical cells. Parameters like state of charge (Li et al. , 2010) and state of health (Waag et al. , 2010) can be derived from an impedance spectrum among others. However, these methods exhibit certain short-comings concerning accuracy, reproducibility and sturdiness
2.5 3 3.5 4
·10−3
-2 -4 -6 -8
</Ω
=
/
Ω
20%SOC 30%SOC
40%SOC
50%SOC
60%SOC
70%SOC 80%SOC 90%SOC
Figure 2.Impedance spectra frequency domain cutout 80–0.1 Hz.
against disturbances and cell aging. Determining the SOC via impedance spectra classification using SVM is an alternative method to achieve this aim.
The task of determining the SOC of a lithium iron phos-phate cell can be achieved with an optimal classifier such as the SVM by grading measured impedances to a certain class respectivly a classified impedance spectrum. The classes for the SVM are represented by all the impedance spectra for different SOC levels, corresponding to defined temperature and aging states, generated by an impedance spectroskopy, are the foundation of this classification method (see Fig. 2). The data of those spectra represents the training data of the SVM classification function – based on a polynomial kernel function – that is used to calculate the hyperplanes that sep-arate all impedance spectra to each other. As noted above, the SVM is only capable of a binary decision, therefore with more than two classes a separation of every impedance spec-trum to to each other has to be realized by a hyperplane via SVM. Sonclasses will yield ton−1 hyperplanes to be eval-uated by the SVM to separate all spectra.
The SVM decision function can only make binary deci-sions so that all the SVM decideci-sions have to be rated and con-textualized. The most efficient way to do so is to create a graph to arrange the hyperplanes. The whole quantity of the impedance spectra elements or the superset, the root of the graph, is separated by the median of the hyperplanes repre-sented by their specific linear combinations,
e
wmed=
l
X
k
evk, medykexk, med (1)
of lagrange multipliersevk, med, corresponding class labels
yk and the support vectorsexk, med of the represented SOC
classesci.
exk, med∈ n
[
i
Sn i=1{ci}
Sn=bn−n2c
i=1 {ci}
Sn=bn−n
2c
i=1 {ci}
{c1}
fSVM,(Z) =−1
Sn
i=bn−n2c+1{ci}
fSVM,(Z) =1
fSVM,(Z) =−1
Sn
i=bn−n2c+1{ci}
Sn=bn−n
2c
i=1 {ci}
fSVM,(Z) =−1
Sn
i=bn−n2c+1{ci}
{cn}
fSVM,(Z) =1
fSVM,(Z) =1
s=1
s=2
s=O(dlog ne)
··
·
·
··
··
·
·
··
··
·
·
··
··
·
·
··
· · ·
· · ·
Figure 3.Binary tree search.
2.05 2.1 2.15 2.2
·10−3
-0.5 -1 -1.5 -2 -2.5·10
−4
</Ω
=
/
Ω
Class{+1}support vectors
Class{−1}support vectors
Class{+1}graded impedance
Hyperplane
Figure 4.Impedance grading using SVM.
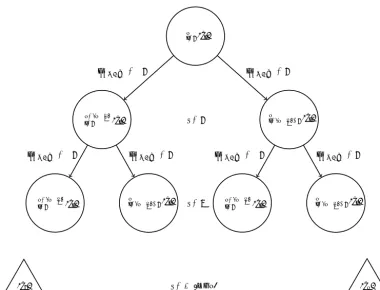
The two new nodes of the graph represent the two roughly equal power sets of the above superset. The separation of the generated power sets can be repeated recursively down to the power set elements representing a single impedance spectrum or SOC class ci. The resulting graph corresponds
to a binary search tree, where the root is the whole superset of all elements from the impedance spectra with the nodes as a power set of its parent superset and the leaves representing the single SOC classes (see Fig. 3).
This binary search tree can easily be parsed by a binary tree search algorithm where the edges of the graph repre-sent the binary decisions of the SVM decision function. So a binary tree search algorithm such as a divide and con-quer search algorithm, applied to the afore mentioned binary search tree, makes it possible to grade measured impedances
Ziusing the SVM decision function,
fSVM,(Z
i)=sgn
l
X
k=1
evk, med·yk
Zi,exk, medd+b
!
(3)
whered indecates the degree of the used polynomial kernel functionk.
k Zi,exk, med=Zi,exk, medd (4)
2.2 Impedance grading
{cs,cs+1}
{c1}
fSVM,(Z) =−1
{c2}
fSVM,(Z) =1
{cs,cs+1} {cs,cs+1} {cs,cs+1}
{cn−1}
fSVM,(Z) =−1
{cn}
fSVM,(Z) =1
s=O(n−1)
· · ·
··
·
··
·
· · ·
Figure 5.Linear search pattern for the SVM state of charge determination method.
algorithm on the binary search tree with the SVM decision function as a key criterion, the SOC can be determined by multiple binary decisions along the search tree.
This divide and conquer algorithm starts at the median hy-perplane of all separated impedance curves, that separates this superset into two roughly equal power sets. The binary decision, of the SVM decision function, whether the mea-sured impedance belongs to the power set on one side of the hyperplane or the other decreases the quantity of rele-vant SVM decisions by half. The remaining power set after the decision containing the measured impedance will there-fore also be divided by its median hyperplane into two sub-sidiary power sets. By continuing this recursive structure the SVM decisions on the binary search tree ultimately grade the measured impedance to a single dedicated SOC class. This class represents the SOC of the cell for the measured impedance. This implementation of this binary SVM based tree search algorithm makes an optimal execution time or compelxity respektivly of O(logn)for the grading of one measured impedance possible.
2.3 Alternative classification methods
Other methods for classification problems such as the nearest neighbor decision (NND) and its derivatives such as thekn
-nearest neighbor decision are also still under investigation. NND-methods use euclidean metrics to evaluate the distance
d between the sample and its classified single-nearest neigh-bor ordnforkn-nearest neighbors.
An a priori assumption of the underlying statistics of the training data as for a Bayes classifier is not necessary. There-fore the big advantages of this method are the simplicity and performance. A disadvantage in this regard is the fact that, as sets of training data increase, the classification probabil-ity decreases (Cover and Hart , 1967 and Dudani (1976)). Compared to the SVM method, NND-methods have higher costs in terms of memory space to store the entire volume of training data and in terms of runtime because all the train-ing data has to be evaluated to grade a strain-ingle sample. SVMs on the other hand resign on the storage of the training data. Their aim is to detect a pattern within the training data via its
class-specific attributes so that the data can be intersected by a hyperplane based on support vectors and the training data can be separated without errors (Cortes and Vapnik , 1995).
3 Further investigations on the SVM-Method
To improve the SVM method two modifications on the deter-mination algorithm to contextualize the binary SVM results are investigated. Therefore two new search methods are pro-posed, a linear search and an imbalanced tree search pattern. 3.1 Linear search
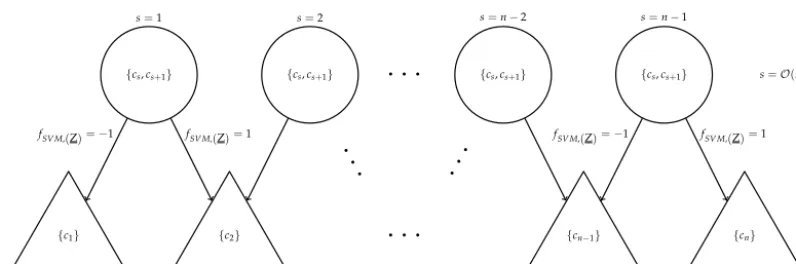
The Linear search pattern computes a result for every hyper-plane between two adjacent SOC classes, Fig. 5 illustrates the linear search for different SOC classes and hence hyper-planes between them. While the established balanced tree search algorithm only needs to compute hyperplanes along one tree path with a maximum ofO(dlogne)steps, the lin-ear slin-earch on the other hand computes all the hyperplanes with the need ofO(n−1)steps to generate a result vector withn−1 binary dessicions of every SVM corresponding hyperplanes.
s=1 s=2 . . . s=n−2 s=n−1
[ ±1 ±1 . . . ±1 ±1 ] (5)
Sn i=1{ci}
Sa i=1{ci}
Sa=ba−a
2c
i=1 {ci}
{c1}
fSVM,(Z) =−1
Sa i=ba−a
2c+1{ci}
{ca}
fSVM,(Z) =1 fSVM,(Z) =−1
Sn i=b{ci}
Sn=bn−n
2c
i=b {ci}
{cb}
fSVM,(Z) =−1
Sn i=b(n−b)−(n−b)
2 c+1{
ci}
{cn}
fSVM,(Z) =1 fSVM,(Z) =1
··
·
·
··
··
·
·
··
··
·
·
··
··
·
·
··
· · ·
· · ·
s=O(dlog ae+1) s=O(dlog(n−b)e+1)
Figure 6.Imbalanced tree search pattern for the SVM state of charge determination method.
This method is especially useful with a high number of hyperplanes, where several errors can be corrected. For the tree search pattern every wrong result of a hyperplane on the search path definitely leads to a wrong SOC estimation. 3.2 Imbalanced tree search
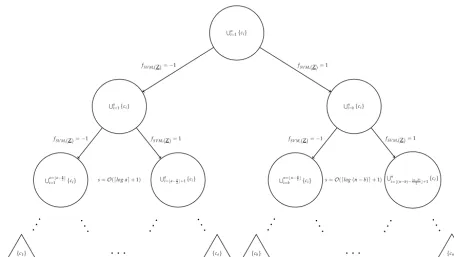
The imbalanced tree search pattern is a different approach based on an imbalanced search tree. While the common pat-tern from Jansen et al. (2015) is based on a balanced search tree, where the maximum difference in height between two arbitrary nodes is one, an imbalanced search tree on the other hand, has its root of the tree close the estimated SOC class and the height of two arbitrary nodes can vary. An initial edu-cated guess of the SOC – e.g. via voltage measurement – de-fines the starting point with the trunk of the imbalaced search tree. Figure 6 shows the tree structure. The imbalanced ver-sion of the search tree offers a complexity ofO(dlogne +1)
close to the balanced search tree. But nis a smaller subset of the whole set of SOC classes containing the wanted SOC class. To benefit from this concept in terms of the average compexity, it is important that the wanted SOC has to be in the lower branch. In this case and if the initial educated guess was sufficiently good the imbalanced tree search is an im-provement to the balancedtree search in both efficiency and classification rate. The difficulty lies in obtaining a suitable initial guess.
3.3 Comparison
The two new binary search pattern for the SOC determina-tion via SVM are presented and compared to the already known search pattern from Jansen et al. (2015). For the test trial test data is needed. The measured single impedances of the SOC related specta are charged with an error. Accord-ing to Orazem and Tribollet (2008) the most commen error in an electrochemical impedance spectrospy is white noise. To simulate this behavour on the impedance sprectra the sin-gle impedances are charged with normally distributed ran-dom noise. So for the test trails the test data is generated out of training data by charging with an error, in both di-rections(=&<), consisting of normally distributed random noiseX(ω)∼N µ, σ2 charged with different magnitudes
m,
X:→ < |X(ω)=
1
σ
√
(2π )e
−12
ω−µ σ
2
(6)
=X(ω)·m,
n
m∈ < |10−7≤m≤10−4o (7)
whereω is a random value, the mean value of µ=0 and the variance ofσ2=1, where added to each impedance of a impedance spectrum. These error charged impedance objects are the specification for the SOC determination algorithm, to clarify that they would be graded correctly to their origin impedance spectrum.
40 30 20 10
0 -10 -20 -30
X(ω)·10−4 X(ω)·10−5 X(ω)·10−6 X(ω)·100−7
10 20 30 40 50 60 70 80 90 100
Temperature /◦C Error /Ω
Classification Rate / % 0 5 10 15 20 25 30 35 40 45 50 55 60 65 70 75 80 85 90 95
Figure 7.Classification rates for the linear search pattern in depen-dancy of the charged errorand the temperature.
40 30 20 10
0 -10 -20 -30
X(ω)·10−4 X(ω)·10−5 X(ω)·10−6 X(ω)·100−7
10 20 30 40 50 60 70 80 90 100
Temperature /◦C Error /Ω
Classification Rate / % 0 5 10 15 20 25 30 35 40 45 50 55 60 65 70 75 80 85 90 95 100
Figure 8.Classification rates for the balanced tree search pattern in dependancy of the charged errorand the temperature.
the actual SOC of a cell. By a statistical verification throu grading a hundred impedances the error prone regarding false classification decreses. Therefore the linear search is able to correct a certain number of false classifications as there is no tree path. As shown in Fig. 7 the classification for low tem-peratures and high errors is quite around 100 %, but the clas-sification rate decreases with the increase of the temperature and increase of the error as well.
The balanced tree search pattern, see Fig. 8, shows a sim-ilar behaviour than the linear search pattern. In low tempera-ture ranges the classification rate is very high even with high errors. The classification rate decreases with the increase of the tmperature and with this comes a sensitivity against the increasing error.
The imbalanced tree search pattern on the other hand uses an initial value – called educated guess – for the creation of an imbalanced search tree. With a good initial guess a shorter search tree than for the balanced search tree can be achieved. Compared to the balanced search tree the imbalaced search tree gives the same results with an good initial guess. With an inital guess of each ±15 % as a worst case estimate the classification rate decreases in best cases from around 100 %
40 30 20 10
0 -10 -20 -30
X(ω)·10−4 X(ω)·10−5 X(ω)·10−6 X(ω)·100−7
10 20 30 40 50 60 70 80 90 100
Temperature /◦C Error /Ω
Classification Rate / % 0 5 10 15 20 25 30 35 40 45 50 55 60 65 70 75 80 85 90 95
Figure 9.Classification rates for the imbalanced tree search pattern in dependancy of the charged errorand the temperature.
0 100 200 300 400 500 600 40 30 20 10 0 −10 −20 −30 0 50 100 150 200
</ mΩ T /◦C
=
/
m
Ω
Figure 10.Impedance spectrum at different temperature states.
to around 68 %, see Fig. 9. The reason for that is the initial guess is so bad, that the search will end up in the wrong sub-sidary section tree with no possibility to determine the right SOC class.
The reason that the temperature has such a hugh effect on the sturdiness of all three pattern against the decrease of the classification rate regarding the increase of the error is the in-fluence of the temprature on of the original impedance spec-tra, see Fig. 10. At low temperatures the impedance spectra in general are bigger and decrease with the increase of the temperature.
4 Conclusion and further work
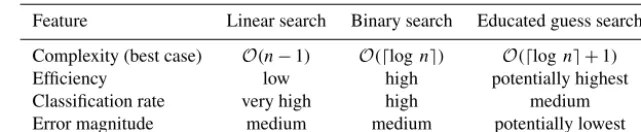
Table 1.Comparison of search pattern.
Feature Linear search Binary search Educated guess search
Complexity (best case) O(n−1) O(dlogne) O(dlogne +1)
Efficiency low high potentially highest
Classification rate very high high medium
Error magnitude medium medium potentially lowest
The linear search pattern improves the rate of exact classi-fications for every temperature. It also improves the robust-ness against high disturbances and can even detect a certain number of false classifications which makes this search pat-tern unique. The downside is a much lower efficiency as all hyperplanes have to be evaluated while the tree search pat-tern only evaluates those on the tree path. The imbalanced tree search pattern on the other hand does not find the correct SOC in many cases with a bad initial guess, but for a wide range of initial values this search pattern gives very small errors compared to the other search pattern. This is espe-cially useful for temperatures where linear search and bal-anced tree search fail to give acceptable results, for example
+40◦C. Figure 9 shows in comparison to the other search pattern good results for the imbalanced tree search method at
+40◦C.
The imbalanced tree search pattern shows to be the best and most efficient way to determine the SOC, if the initial guess is within less then±5 % SOC of the original SOC in both directions and exhibits the best tolerance for high dis-turbances with almost the same classification rate then the balanced tree search in low temperature ranges and an en-hanced classification rate in high temperature ranges. Al-though showing a higher number of inexact classifications the magnitude of errors is greatly reduced. The initial value for the SOC was simulated with an error of±15 %. The im-balanced tree search does not tolerate big errors – higher then 40–70 % –, depending on the temperature.
Table 1 compares basic attributes of the three presented search pattern. It shows that each search pattern has differ-ent advantages. The search pattern have thus to be chosen according to the specific requirements. The two new search pattern improve many aspects of the SVM-Method but not all. In a future work a combination of search pattern could be discussed to combine their strengths and create an algorithm with both high accuracy and low error magnitude.
Compared to time basd state of the art methods such as the the state space obsever (Codeca et al. , 2008), various ver-sions of the kalman filter (Hu et al. , 2014; Lee et al. , 2007) and the time based support vector regression (Álvarez An-tón et al. , 2013) the most important advantige of the novel frequency based SVM-Method is the fact, that this method resigns on an ECD and an OCV curve. Further investigation on classification methods such as the nearest neighbor deci-sion and artificial neural networks will follow up, to improve
further novel methods for the state of charge determination independent of the OCV curve.
The presented novel method shows an alternative way to determine the state of charge of a lithium iron phosphate cell based on SOC related impedance spectra out of frequency domain data by grading single measured impedances. For further improvements the more dynamic behaviour of the impedance spectra in terms of superposed direct current on electrocehemical impedance spectroscopy has to be investi-gated. With the results from this examinations anin operando
application based on an online impedance measurment as proposed by Klotz et al. (2011) becomes realistic and is worth further research on this topic.
This investigations on the SOC determination based on frequency domain data shall enable the path to novel hybrid algorithms combining the advantages of both worlds the fre-quency and the time domain. For instance the high dynamic of the time domain based methods combined with the high accuracy in the middle SOC range of the frequency damain based methods.
Acknowledgements. This contribution was developed within the scope of the project Drive Battery 2015 (Intelligente
Steuerungs-und Verschaltungskonzepte für modulare
Elektrofahrzeug-Batteriesysteme zur Steigerung der Effizienz und Sicherheit sowie zur Senkung der Systemkosten – AEV-Subproject: Optimierung des Energiemanagements von Fahrzeugen mit Lithium-Ionen Starter- und Bordnetzbatterien) which is funded by the BMWi (Bundesministerium für Wirtschaft und Energie) under the grant number 03 ET6003 I. The responsibility for this publication is held by the authors only.
Edited by: J. Anders
Reviewed by: two anonymous referees
References
Álvarez Antón, J. C., García Nieto, P. J., Viejo, C. B., and Vilán Vilán, J. A.: Support Vector Machines Used to Estimate the Bat-tery State of Charge, IEEE T. Power Electr., 28, 5919–5926, 2013.
Cortes, C. and Vapnik, V.: Support-vector networks, Machine Learning, Kluwer Academic Publishers, Boston, 20, 273–297, 1995.
Cover, T. M. and Hart, P. E.: Nearest Neighbor Pattern Classifica-tion, IEEE T. Inform. Theory, vol. IT-13, No.1, 21–27, 1967. Dudani S. A.: The Distance-Weighted k-Nearest-Neighbor Rule,
IEEE T. Syst. Man. Cyb., vol. SMC-13, No.4, 325–327, 1976. Hearst, M., Dumais, S., Osuna, E., Platt, J., and Schökopf, B.:
Sup-port vector machines, Intelligent Systems and their Applications, IEEE, 13, 18–28, 1998.
Hu, J., Hu, J., Lin, H., Li, X., Jiang, C., Qiu, X., and Li, W.: State-of-Charge Estimation for Battery Management System Using Opti-mized Support Vector Machine for Regression, J. Power Sources, 269, 682–693, doi:10.1016/j.jpowsour.2014.07.016, 2014 Jansen, P., Vergossen, D., Renner, D., John, W., and Götze, J.:
Impedance spectra classification for determining the state of charge on a lithium iron phosphate cell using a support vector machine, Adv. Radio Sci., 13, 127–132, doi:10.5194/ars-13-127-2015, 2015.
Klotz, D., Schönleber, M., Schmidt, J., and Ivers-Tiffée, E.: New approach for the calculation of impedance spectra out of time domain data, Electrochim. Acta, 56, 8763–8769, 2011.
Lee, J., Nam, O., and Cho, B.: Li-ion battery SOC estimation method based on the reduced order extended Kalman filtering, J. Power Sources, 174, 9–15, 2007.
Li, R.; Wu, J.; Wang, H and Li, G.: Prediction of State of Charge of Lithium-ion Rechargeable Battery with Electrochem-ical Impedance Spectroscopy Theory, C. Ind. Elect. Appl., 684– 688, 2010.
Orazem, M. E. and Tribollet, B.: Electrochemical Impedance Spec-troscopy, 1, Wiley, New Jersey, 2008
Piller, S., Perrin, M., and Jossen, A.: Methods for state-of-charge determination and their applications, J. Power Sources, 96, 113– 120, 2001.
Plett, G. L.: Extended Kalman filtering for battery management sys-tems of LiPB-based HEV battery packs Part 1. Background, J. Power Sources, 134, 252–261, 2004.
Sauer, D. U., Bopp, G., Jossen, A., Garche, J., Rothert, M., and Wollny, M.: State of Charge – What do we really speak about?, 21st International Telecommunications Energy Conference – IN-TELEC’99, Kopenhagen, Denmark, 6–9 June, 1999.
Waag, W., Käbitz, S., and Sauer, D. U.: Experimental investiga-tion of the lithium-ion battery impedance characteristic at various conditions and aging states and its influence on the application, Appl. Energ., 102, 885–897, 2013.