Assessing Reliability of Bending of Concrete Beams
Ex-posed to Freeze-thaw Conditions Based on Compressive
Stress Limit Reduction
S.M. Hosseinian
∗, F. Bahmani
Department of Civil Engineering, Faculty of Engineering, Bu-Ali Sina University, Hamedan, Iran.
Article info
Article history:Received23December 2018 Received in revised form 16March 2019
Accepted17March 2019
Keywords: Reliability
Freeze-thaw cycles Stress limit Concrete
Stochastic model Compression
Abstract
For existing reinforced concrete structures exposed to freeze-thaw conditions, there is an increasing engineering concernover their remaining safety. This paper presents a novel experimental-theoretical stochastic model for evaluat-ing the reliability of concrete structures subjected to freeze-thaw conditions based on stress limit reduction. Reliability theory and experimental works provide the basis for the model development. Water cement ratio, air content, and number of freeze-thaw cycles are considered as the model variables. Compressive stress limit reduction in freeze-thaw conditions was treated as a stochastic variable. The effectiveness of the proposed model was evaluated using an example concrete structure element. The paper demonstrates that after, for example, 10 years experiencing FT cycles in a cold city; the reliability of the example concrete beam reduces to 52.5 percent for −10◦C concrete freezing temperature. It was found that the results of the proposed method are accurate compared to the literature. It was also found that the results of the proposed method are in good agreement with those obtained based on concrete’s non-destructive tests.
1. Introduction
For existing reinforced concrete structures exposed to freeze-thaw (FT) conditions, there is an increasing en-gineering concern in their remaining safety and service-ability, including the expected remaining life. Freezing pressure in the cement paste or concrete aggregates in each FT cycle results in local redistribution of mois-ture during the freezing period. This is followed by the absorption of moisture from outside the concrete or in-ternal redistribution of moisture during the thawing period [1]. The freeze-thaw damage (deterioration) of concrete occurs when internally generated hydrostatic pressure during FT process is greater than the destruc-tion produced by tensile strength of concrete [2]. Sim-ilar to what occurs in normal mechanical fatigue, each
new cycle adds to cumulative internal damage [3, 4] resulting in the growth of microcracks caused by in-ternal damage of concrete. With higher FT cycles, microcracks gradually turn into macrocracks leading to major concrete internal damage. Another type of concrete frost damage is surface scaling (peeling) [5]. Internal damage seems to be more severe than surface scaling as internal damage leads to a considerable loss in the mechanical properties of concrete [6].
The methods available to assess the frost damage of concrete tend to be both experimental, mainly non-destructive, [7] and theoretical [3, 8]. The available methods generally look at the loss of dynamic modu-lus of elasticity as an indicator expressing the internal damage of concrete.
Tang et al. provided a review on the recent studies
∗Corresponding author: S.M. Hosseinian (Assistant Professor)
E-mail address: [email protected]
http://dx.doi.org/10.22084/jrstan.2019.17989.1075 ISSN: 2588-2597
on the durability of concrete exposed to environmental attacks, including FT conditions [9]. They called for new studies concerning on more accurate service life es-timate of concrete structures exposed to environmental attacks. Wawrzenczyk and Molendowska analyzed the damage process of concrete exposed to FT conditions stochastically based on the mass changes in specimens [10]. Ashra et al. developed a design approach for as-sessing the FT durability of concrete based on relative loss in dynamic modulus of elasticity using a sensitiv-ity analysis and a probabilistic approach [11]. It was found that paste content of the concrete mixtures, air content of hardened concrete, and number of FT cy-cles are the most sensitive factors. In another study, Smith et al. defined FT failure as the likelihood that the hydraulic pressure caused by freezing process ex-ceeds the tensile strength of the hardened cement paste [12]. FT data were used from literature to develop their probabilistic model using a lognormal distribution. It was concluded that air-void spacing, saturation state, freezing rate, and permeability of concrete significantly influence the concrete FT performance. Duan et al. developed a stochastic frost damage method based on micromechanical modelling, with two variables which were determined by a nonlinear regression analysis [13]. Based on conducting FT tests on seven high strength concrete mixtures, Bumanis et al. found coherence be-tween compressive strength and ultrasonic pulse veloc-ity results [14]. Fagerlund treated actual and critical moisture contents in concrete as stochastic variables to calculate the probability of frost damage using a triangular probability density function [15]. Penttala presented a nonlinear damage model based on three variables (water-cement ratio, air content, and curing time) and five coefficients which were determined by a regression analysis [7]. Nili et al. developed a theoret-ical model to predict the internal damage of concrete using mathematical modeling [8]. Jun et al. gave a frost damage model for initial and developing phases of concrete damage [16]. Similarly, Liu and Wang sug-gested a tri-linear model for internal deterioration of concrete [17]. Zhou and Sun looked at concrete freeze-thaw damage by combining stochastic damage theory with thermodynamics [2].
Despite of seminal works of above studies, they gen-erally look at damage mechanisms of concrete through foc using on the loss of dynamic modulus of elastic-ity. In practice, however, structural engineers need to know stress limit reduction of concrete (for example compressive stress) caused by FT attacks in order to assess the reliability of a given structure. Few studies have proposed a method which is appropriate for pre-dicting concrete compressive stress limit and the as-sociated reliability in FT conditions. This is mainly because of difficulty in conducting destructive tests of concrete (typically for assessing compressive stress of concrete) compared to non-destructive testes (typically
for assessing dynamic module of elasticity) under FT cycles. Shang and Song argued the lack of any report on the compressive stress limit of concrete subjected to FT cycles [18]. Nevertheless, most of existing frost damage methods are deterministic and therefore they fail to consider the stochastic nature of concrete [2]. FT processes involve great uncertainty [13]. Presumably, it is more practical to use a stochastic method rather than a deterministic one for evaluating the compres-sive stress limit of concrete. Stochastic methods have popularly been used for assessing the durability of con-crete exposed to carbonation or chloride ingress [e.g., 20, 21]. However, few stochastic methods have been proposed to assess the reliability of concrete exposed to FT conditions [13, 15].
In such light, this paper proposes a novel experimental-theoretical stochastic model for evaluat-ing the reliability of concrete structures subjected to FT cycles through focusing on the compressive stress limit of concrete. The model features both stochas-tic and stress limit. Mathemastochas-tical formulas, reliability theory, and experimental works provide the basis for the model development. Water cement ratio and air content of concrete were treated as random variables. The present model offers an experimental-theoretical basis for exploring the stochastic aspect of concrete compressive stress limit against FT attacks.
The rest of the paper is structured as follows. The problem formulation is first given. Then the proposed model is provided. This is followed by demonstrating the application and accuracy of the proposed model.
2. Material and Methods
2.1. Problem FormulationThe basic reliability problem considers one load effect S, also referred to as structural response or internal ac-tions, restrained by one limit (resistance)L, also known as an acceptable stress capacity for structural response [21]. Typically, S is calculated from the applied load via a conventional structural analysis procedure. Both S and L should be calculated in the same units. Owing to deterioration (frost damage) of concrete in FT con-ditions, the value of R decreases by time leading to a reduction in the reliability of the concrete structure. In evaluating the reliability of a concrete structure, a cri-terion should be established. In reliability theory, this criterion can be expressed by a limit state function, as follows [22],
G(S, L) =S−L (1)
From Eq. (1), the structural reliability, denoted by R, can be determined by [22],
R=P[G(S−L)<0] =P[S < L] (2)
whereP[ ]denotes the probability of an event. Follow-ing reliability theory [e.g., 24],S and Lare described
by a known probability density function, fS(u) and fL(v), respectively, where u and v are random vari-ables. It is followed directly that when S and L are random variables Eq. (2) can be expressed as,
R=
∫∫
D
fSL(u, v) dudv (3)
where fSL(u, v) is the joint probability density func-tion ofS andL; andD is the domain that represents S < L.
When S and L are independent, Eq. (3) can be obtained by (Melchers and Beck, 2018),
R=
∫ +∞
−∞
FL(z)fS(z) dz (4)
where F() is a cumulative distribution function; f()
is a probability density function; and z is a random variable.
As a special case whenS is a normal random vari-able and L has a deterministic value, the analytical solution of Eq. (4) is possible and can be obtained by the reliability index β [21]. But this might not be always the case in reliability problems.
To apply Eqs. (3) or (4) to the problem of reliabil-ity of concrete exposed to FT cycles, the main effort lies in developing stochastic models of load effect S and stress limitL. This is explained in the following section. For illustration, the reliability of a structure element rather than a whole structure is discussed.
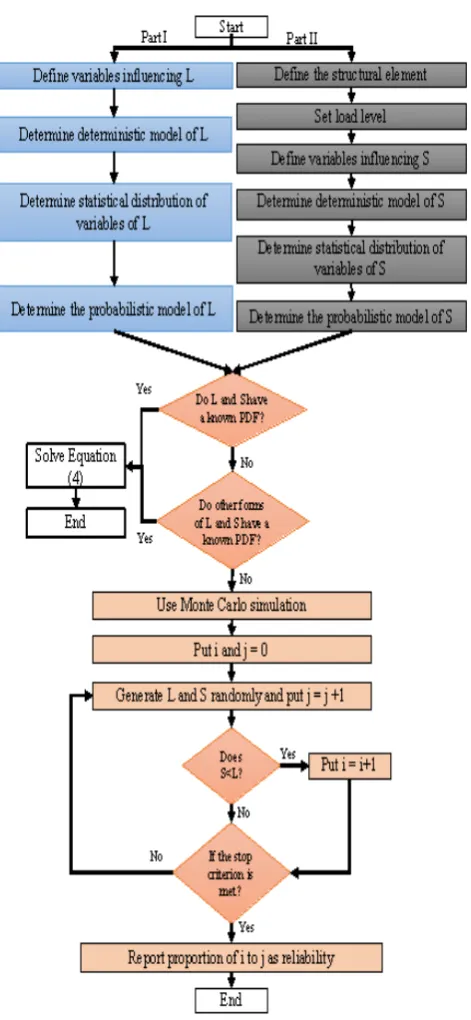
2.2. Proposed Method
Solving Eqs. (3) or (4) might be followed in two parts, namely part I and part II, shown in Fig. 1. In part I, first variables influencing stress limit (L) need to be de-fined. This is followed by determining a deterministic model ofL, for example based on laboratory observa-tions. Then, probability density functions of variables affecting L need to be established. Next, the proba-bilistic model ofS is calculated.
In part II, the probabilistic model of load effect S is determined. For this purpose, the structural ele-ment, its load and variables effecting S need to be defined. This is followed by determining the deter-ministic model ofS. Then by establishing probability density functions of variables of S, the probabilistic model ofS can be obtained. If both Land S possess known probability density functions, Eqs. (3) or (4) can be solved and reliability of the structural element can then be obtained. In order to investigate the exis-tence of aprobability density function forLandS, the Kolmogorov-Smironov qualitative test was used [23]. This test might be used to match a set of quantita-tive data to different probability distribution functions such as, normal, Poisson, exponential, and uniform.
In the case when L and S do not possess a prob-abilistic density function (PDF) other forms ofL and
S, such as reverse and logarithmic are tried for data matching. If other forms ofL andS possess a proba-bility density fuction, Eq. (3) can be solved for those forms (for example reverse). Otherwise, Eq. (3) can-not be solved in closed (analytical) form and instead a numerical technique (such as, Monte Carlo simulation) needs to be adopted to generate values ofLandS ran-domly (for example 10000 times). Then such values are compared pairwise. The ratio of number of pairs
with S < L to the total number of comparisons are
reported as the reliability value, as shown in Fig. 1.
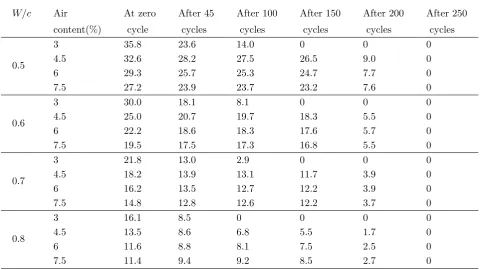
Table 1
Compressive stress limit of concrete (MPa).
W/c Air At zero After 45 After 100 After 150 After 200 After 250
content(%) cycle cycles cycles cycles cycles cycles
0.5
3 35.8 23.6 14.0 0 0 0
4.5 32.6 28.2 27.5 26.5 9.0 0
6 29.3 25.7 25.3 24.7 7.7 0
7.5 27.2 23.9 23.7 23.2 7.6 0
0.6
3 30.0 18.1 8.1 0 0 0
4.5 25.0 20.7 19.7 18.3 5.5 0
6 22.2 18.6 18.3 17.6 5.7 0
7.5 19.5 17.5 17.3 16.8 5.5 0
0.7
3 21.8 13.0 2.9 0 0 0
4.5 18.2 13.9 13.1 11.7 3.9 0
6 16.2 13.5 12.7 12.2 3.9 0
7.5 14.8 12.8 12.6 12.2 3.7 0
0.8
3 16.1 8.5 0 0 0 0
4.5 13.5 8.6 6.8 5.5 1.7 0
6 11.6 8.8 8.1 7.5 2.5 0
7.5 11.4 9.4 9.2 8.5 2.7 0
2.3. Reliability Assessment
In practice, generally a 60 percent loss in dynamic mod-ulus of elasticity of concrete exposed to FT cycles is considered as an acceptable limit for reliability of con-crete against FT conditions [24]. However, this lim-itmight not be practical for structural analysis as it is regarded as an indication showing the durability of concrete exposed to FT cycles. Concrete compressive stress limit might be more practical for reliability as-sessment, though other stress types such as shear stress might be considered. To provide a stochastic model for concrete compressive stress limit exposed to FT cycles it is first essential to develop a deterministic model of it. Unfortunately, such models have not well developed in the literature perhaps due to destructive nature of compressive tests coupled with time consumption na-ture of FT tests. An experimental test was conducted to develop a deterministic model for compressive stress limit of concrete against FT cycles as discussed below.
3. Results and Discussion
3.1. Experimental TestsFor developing a deterministic model for concrete com-pressive stress limit in FT conditions, a series of exper-imental tests with three variables, namely water to ce-ment ratios (0.5,0.6,0.7,0.8), concrete air contents (3,
4.5,6,7.5percent), and number of FT cycles were sidered. Sixteen mix designs wereconsidered for
con-crete samples. Type I ordinary Portland cement was used. Coarse aggregates were crushed stone (with max-imum aggregate size of9.5mm; with grading matched to curve no. eight of ASTM C33 [25]) and fine ag-gregates were limestone with fineness modulus of2.66, grading based on ASTM C33 [25]. For each compres-sive test, two specimens were considered and the aver-ages of the results were reported. The specimens were prepared in cubic forms (10∗10∗10centimeters), due to the space limit of FT apparatus. The FT tests were conducted based on ASTM C-666B. All specimens were removed from molds 24h after casting and then were cured under water in lab conditions (20±3◦C) for 14 days before they were exposed to FT tests. According to ASTM C-666B, each FT cycle lasted three hours, in which 20% of the time, specimens were in thawing, and in 80% of the time, specimens were frozen. Concrete specimens were exposed to 250 FT cycles and compres-sive tests were conducted after 0, 45, 100, 150, 200 and 250 cycles. Specimens were capped before compressive tests according to ASTM C617 for obtaining smooth and level surfaces [26]. The compressive test machine was electro-hydraulic with a capacity of 2000kN. The average loading rate was 0.38MPa/sec. Air content wasmeasured based on ASTM C231 [27]. Overall, 192 compressive tests were conducted. The slump of con-crete mixes were measured based on ASTM 143 [28]. The slump values varied between 70mm to 110mm. Table 1 presents the corresponding results. The de-tailed information on the FT tests and the compressive strength loss was reported earlier [29].
3.2. Deterministic Model of L
Using the data of Table 1, and conducting a regres-sion analysis, with R2 = 0.93, a deterministic model for compressive stress limit (L in Eq. (2) and Fig. 1) can be obtained by,
L= 15.97A
0.98 (W
c )0.51
N0.10 −10A (5)
whereA is the concrete air content (taking values be-tween three and 7.5 percent); is water cement ratio (taking values between0.5 and 0.8); and N is number of FT cycles (taking values between zero and 250).
3.3. Probabilistic Model of L
To develop a probabilistic model for L it is required to account uncertainty information in the variables in-volved. For this purpose, a probabilistic densityfunc-tionneeds to be considered for each involved variable to treat it as a stochastic variable. Different probability distribution functions might be considered. Following Li a normal distribution function was adopted in this research [30]. Table 2 sets out estimates for uncertain-ties in variables of Eq. (5) based on experimental data, Table 1, and the (limited) information in the literature [30].
Table 2
Uncertainty estimates for variables of Eq. (5).
Variable Mean Standard deviation
W
C 0.65 0.05
A(%) 5.25 0.76
By using Eq. (5) and Table 2, the probabilis-tic model of L can be obtained using a simulation technique. In this paper, Monte Carlo simulation is adopted. Such algorithmwas popularly used in the literature for example to simulate chloride diffusion in concrete exposed to de-icing salts [31], to study mesoscale fracture behavior of concrete with random aggregates [32] and to assess the strength of concrete columns [33]. A Monte Carlo simulation algorithm typ-ically utilizesa random sampling approach to obtain numerical results for the given dependent variable [34]. Such algorithm first, based on a uniform distribution function, generates a set of random numbers between zero and one. Then it uses the cumulative distribution function of each considered probabilistic independent variable and random numbers generated to find a value for the variable. By having values of all independent variables, next the algorithm calculates the value of the
dependent variable based on a given formula. This-procedure is repeated many times, for example 10000 times, to generate a set of data for the dependent vari-able [34].
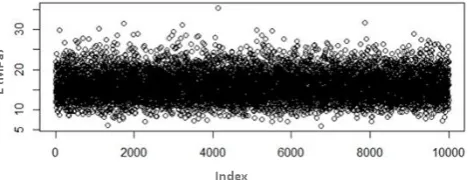
In the current study, the simulation was conducted in R which isa language and environment for statistical computing. For this purpose a code was written. Fig. 2 shows the simulation results after 45 FT cycles. The index in this Figure represents the iteration numbers. Similar results can be presented for different FT cycles.
Fig. 2. Stochastic compressive stress of concrete after 45 FT cycles.
To match the generated L data to a probability distribution function such as, normal, Poisson, expo-nential, and uniform, the Kolmogorov-Smironov qual-itative test was conducted [23]. This test might be used to compare a set of data with a reference proba-bility distribution via quantifying a distance between the empirical distribution function of the data and the cumulative distribution function of the reference dis-tribution. Given a set of data, the null hypothesis is that the set of data fits to a reference probability distri-bution and the alternative hypothesis is that the set of data failsto fit to the reference probability distribution. Ap-value less than 0.05 rejects the alternative hypoth-esis meaning the set of data comes from the reference probability distribution [23].
Table 3 presents p-values obtained from such test for different statistical distribution functionsin differ-ent FT cycles. A value for p bigger than 0.05, indi-cates the existence of a probability distribution func-tion. Table 3 shows that natural logarithm ofLat 45 and 100 cycles and square root of L at 150 and 200 cycles only match a probability distribution function (normal). Table 4 presents mean and standard devia-tion results for the probabilistic forms of compressive stress limitLin different FT cycles.
3.4. Example Application of Proposed Method
Table 3
Amount ofp-values forL.
Distribution forms
Form
Cycles
45 100 150 200
Normal
L 0.012 0.02 0.031 0.03
log(L) 0.0184 0.0159 0.0428 0.023
1/L 0.0249 0.0378 0.0215 0.028
√
L 0.0438 0.0251 0.0836 0.094
ln(L) 0.139 0.096 0.0119 0.010
Exponential L 0.0001 0.0001 0.0000 0.0000
Poisson L 0.0000 0.0000 0.0000 0.0000
Uniform L 0.0001 0.0001 0.0000 0.0000
Table 4
Mean and standard deviation results forL(MPa).
Freeze-thaw cycles 45 100 150 200
Function form ln(L) ln(L) √L √L
Mean 2.74 2.4 2.94 1.59
Standard deviation 0.21 0.26 0.45 0.22
Table 5
Cross-sectional and other properties, and their uncertainty estimates for example beam.
Variable Units Mean Standard deviation
L
mm
5000 10
h 400 10
b 250 10
d 350 10
As (reinforcement area) mm2 339.3 5
fy (yield strength of steel bars) MPa 400 0
W N/mm 38.4 0
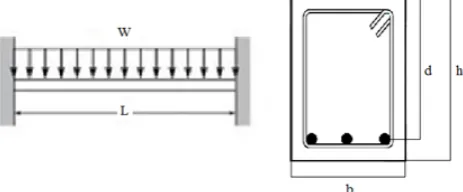
Fig. 3. Example beam, dimension layout, and cross-section.
The cross-sectional propertiesmay be treated as de-terministic. It is known that matters such as dimen-sions and concrete cover are subject tovariability in practice [35]. In this paper, following Melchers et al., (2008) [35] the cross-sectional properties were treated as stochastic variables with normal distribution. Ta-ble 5 shows the cross-sectional and other properties, and their uncertainty estimates for the example beam based onthe (limited) information in the literature [30].
3.5. Deterministic Model of S
To determine a deterministic model of the load effect S for the considered beam, its mechanical properties, such as bending moment and shear force need to be considered. For illustration, the maximum positive moment (Mn) at the middle of the span is considered and calculated according to the conventional structural analysis,
Mn=
W L2
24 (6)
whereW is the uniform load intensity. Assuming that the Whitney Stress Block is well-suited here (ACI 318-14) [36], the nominal momentcapacity of the beam can be written as,
Mn=Asfy (
d− Asfy
2×0.85×b×S
)
(7)
In Eqs. (6) and (7) the coefficients of load increase and capacity reduction are setone due to the stochastic nature of the problem. From Eq. (7), the deterministic
model ofS can be obtained,
S =Asfy 1.7b
(
d− W L
2
24Asfy )−1
(8)
By using Monte Carlo simulation, Eq. (8) and data of Table 5, the stochastic model ofS can be calculated by simulation in theRplatform. To investigate the ex-istence of any probability distribution function for sim-ulation results, the Kolmogorov-Smironov qualitative test was used. The corresponding results are shown in Table 6. These results demonstrate lack of any prob-ability distribution function matching (p < 0.05) for different forms ofS.
Table 6
Amount ofp-values forS.
Form S log(S) 1/S √S ln(S)
p-value 0.0248 0.0049 0.0119 0.0397 0.0412
3.6. Reliability Calculation
Due to the lack of any probability density function for Sit is not possible to calculate reliability of the example concrete beam from Eq. (3). Thus, as discussed early, a numerical method needs to be used, (see Fig. 1). For this purpose Monte Carlo simulation was used and a code was written in R. The corresponding results are shown in Fig. 4. This figure shows the reliability of the example beam in different FT cycles. According to the results, for example, the reliability of the beam decreases to 52.5percent after 100 cycles. This shows how vulnerable concrete is to FT attacks. Therefore concrete structures should be protected against FT in cold areas.
Fig. 4. Reliability of example beamin different FT cycles.
Typically, reliability of concrete structures needs to be calculated based on the age of structures rather than number of FT cycles. To present the reliabil-ity based on the structure age, the number of FT cy-cles per year in the region that the structure is
lo-cated needs to be identified. For illustration, a city, called Hamedan, with cold climate conditions, located in western Iran, was considered. The weather temper-ature data of this city, provided by the local weather forecasting authority, was studied in two recent years (2015 and 2016), due to difficulty in data collection. Unfortunately, there is no standard or universal agree-ment on the concrete freezing and thawing tempera-tures in nature. In this study negative10◦C was con-sidered as concrete freezing temperature, and zero◦C was considered as thawing one. Based on this assump-tion, Table 7 shows the number of FT cycles in different months in Hamedan in 2015 and 2016. The average of FT cycles for this city is 10 cycles per year for these two years. For illustration, the average FT cycles in this city was assumed to be 10 cycles per year. It is acknowledged that by enlarging the weather tempera-ture data over recent years a more accurate predication might be obtained.
By using Table 7, the reliability of the example concrete beam in the Hamedan climate can be calcu-lated. The corresponding results are shown in Fig. 5. This figure demonstrates that after, for example, 10 years experiencing FT cycles in Hamedan the exam-ple beam’s reliability considerably decreasesto52.5 per-cent. Fig. 5 also compares the reliability of the beam for different concrete freezing temperatures. As it is expected, this figure shows that the results for −8◦C are more conservative than those for−10◦C. For exam-ple according to Fig. 5, reliability of the beam after six years becomes 82 percent for−10◦C concrete freezing temperature while for −8◦C the reliability decreases to 52.5 percent. This demonstrates how sensitive is the reliability results to concrete freezing temperature. Further studies need to be conducted to address freez-ing and thawfreez-ing temperatures of concrete.
Table 7
Number of FT cyclesfor Hamadan in 2015 and 2016.
Year Jan Feb Mar Apr May Jun Jul Aug Sep Oct Nov Dec Total
2015 3 0 0 0 0 0 0 0 0 0 3 2 7
2016 6 0 0 0 0 0 0 0 0 0 5 3 14
3.7. Validation
There are almost no experimental or theoretical results concerning reliability of concrete exposed to FT con-ditions to compare the proposed method. The past studies generally focused on non-destructive methods such as reduction of the dynamic modulus of elastic-ity of concrete, and their approaches are generally de-terministic rather than probabilistic. Few stochastic methods have been proposed to assess the reliability of concrete exposed to FT conditions [13]. Following Nili et al. [8], the probabilistic model presented by Duan et al. [13] is used to compare the results. Duan et al. [13] developed a stochastic frost damage method based on micromechanical modeling without discussing the stress limit reduction of concrete structures, which is crucial for the structural engineer or asset manager to predict the remaining life of the structure. In order to provide a basis for comparing the results of the paper with those of the Duan et al. study [13], this paper-compared reduction in compressive stress limit of con-crete, denoted by DM odel, with those of the dynamic module of elasticity given in Duan et al. [13]. Fig. 6 comparing the model predictions with those of Duan et al. [13] illustrates a good agreement between these two models. The average value of DM odel/DDuan et al. is1.04, reflecting a good accuracy for the proposed model. To measure the significant of this, at-test anal-ysis was conducted. Using Fig. 6 data, Table 8 details the result of thet-test.
Fig. 6. Comparison of results with Duan et al. [13].
It is noted that the smaller the t-value is, the less likely the difference is significant. A critical t-value is the minimum t-value required to have p <0.05. If thet-value is less than or equal to the criticalt-value,
then the difference between the two data sets are not statistically significant [37]. According to Table 8, the t-value is less than the t-critical value with a p-value higher than0.05. This demonstrates that the difference between the results produced by the proposed method and those of Duan et al. [13] are not statistically sig-nificant [37]. This suggests that the proposed method can produce very similar, results to those generated by Duan et al. [13]. This provides support for the pa-per findings. The results also approve that reduction in the compressive stress limit of concrete is in a good agreement with the reduction in the dynamic modulus of elasticity. This confirms that measuring the amount of loss in the dynamic modulus of elasticity is a good indicator for showing frost damage and consequently reduction in reliability of concrete.
Table 8
Thet-test result for comparing results produced by the proposed model and that of Duan et al. [13].
t-value −0.026
p-value one-tail 0.489
t-critical-value (one-tail) 1.656
p-value two-tail 0.979
t-critical-value (two-tail) 1.977
To further validate the results of this paper the experimental data (tests), which was obtained from Zhang [38], presented in Table 9 was used. This data set was earlierused by Nili et al. [8] to validate their model. Fig. 7 comparing the model predictions with those of Zhang [38] demonstrates a good agree-ment between these two models. The average value of DM odel/DZhang is 0.97, showing a good accuracy for the proposed model.
Fig. 7. Comparison of results with Zhang [38].
Table 9
Values ofDfor different FT cycles.
W/c N DZhang DProposed model
0.4
25 0.069 0.010
50 0.123 0.205 75 0.149 0.341
100 0.179 0.435 125 0.246 0.505
150 0.303 0.562 175 0.345 0.609
190 0.398 0.634 200 0.458 0.649
0.45
25 0.072 0.010
40 0.14 0.127 50 0.192 0.205
60 0.315 0.267
75 0.439 0.341
0.5
25 0.086 0.010 50 0.2 0.205
75 0.253 0.341 100 0.329 0.435
115 0.404 0.479 125 0.467 0.505
175 0.345 0.609 125 0.467 0.505
0.4
25 0.174 0.010
40 0.326 0.127 50 0.363 0.205
0.6
25 0.363 0.010 30 0.479 0.025
40 0.691 0.127
4. Conclusions
This paper proposed a novel stochastic model for eval-uating the reliability of concrete subjected to FT cy-cles. The focus was on concrete compressive stress limit reduction. Mathematical formulas, reliability theory, and experimental works provided the basis for the model development. Water cement ratio and air con-tent weretreated as random variables. The results show that natural logarithm of compressive stress limit at 45 and 100 cycles and square root of it at 150 and 200 cycles only match the normal probability distribution. The paper also shows that the values of mean (standard deviation) of natural logarithm of compressive stress limit at 45 and 100 cycles are 2.74MPa (0.21MPa) and 2.4MPa (0.26MPa), respectively while those of square root of compressive stress limit at 150 and 200 cy-cles are2.94MPa (0.45MPa) and 1.59MPa (0.22MPa),
respectively. A case example was analyzed to show the application of the proposed method and to demon-strate its capabilities in predicting the reliability of a concrete structure element exposed to FT cycles. It was found that:
1. The results of the proposed method are accurate compared to the literature.
2. The reliability of concrete structures depends considerably on the freezing temperature of con-crete. For example, the paper demonstrates that aftersix years experiencing FT cycles in Hamedan, the reliability of the considered beam decreasesto 82 percent for−10◦C concrete freez-ing temperature, while for −8◦C concrete freez-ing temperature the reliability considerably de-creasesto 53 percent.
3. Predicting the reliability of concrete based on reduction in compressive stress limit is in good agreement with that of non-destructive methods.
4. The proposed method can serve as an accu-rate tool for structural engineers and asset man-agers in making decisions with regard to repairs, strengthening, and/or rehabilitation of frost af-fected bending strength of concrete beams.
5. It is acknowledged that the development on the stochastic model of concrete is based on a beam elementand its validity for other elements or structures should be investigated separately. This paper could be regarded as a basic frame-work for further development, and might be ex-pected to be applicable to different concrete ele-ment.
The empirical studies in this paper were conducted based on 192 samples, with normal concrete. Further empirical testing could be carried out on different types of concrete to enlarge the sample and provide further persuasive support for the paper’s findings.
References
[1] T. Cho, Prediction of cyclic freeze-thaw damage in concrete structures based on response surface method, Construct, Build. Mater., 21(12) (2007) 2031-2040.
[2] Z.Y. Zhou, M. Sun, Stochastic damage model of concrete during freeze-thaw process, Adv. Mater. Res., 450-451 (2012) 102-109.
[4] X. Luo, J. Wei, Sharp degradation point of con-crete under freezing-thawing cycles, Concon-crete, 13(11) (2005) 14-16.
[5] J.J. Valenza, G.W. Scherer, A review of salt scal-ing: I. Phenomenology, Cem. Concr. Res., 37(7) (2007) 1007-1021.
[6] M. Pigeon, R. Pleau, Durability of Concrete in Cold Climates, CRC Press Publisher, (1995).
[7] V. Penttala, Surface and internal deterioration of concrete due to saline and non-saline freeze-thaw loads, Cem. Concr. Res., 36(5) (2006) 921-928.
[8] M. Nili, A. Azarioon, S.M. Hosseinian, Novel internal-deterioration model of concrete exposed to freeze-thaw cycles, J. Mater. Civ. Eng., 29(9) (2017) 0401732-1-11.
[9] S.W. Tang, Y. Yao, C. Andrade, Z.J. Li, Recent durability studies on concrete structure, Cem. Concr. Res., 78(Part A) (2015) 143-154.
[10] J. Wawrzenczyk, A. Molendowska, Evaluation of concrete resistance to freeze-thaw based on prob-abilistic analysis of damage, Procedia Eng., 193 (2017) 35-41.
[11] W. Ashraf, M.A. Glinicki, J. Olek, Statistical analysis and probabilistic design approach for freeze-thaw performance of ordinary Portland ce-ment concrete, J. Mater. Civ. Eng., 30(11), (2018) 04018294-1-10.
[12] S.H. Smith, K.E. Kurtis, I. Tien, Probabilistic evaluation of concrete freeze-thaw design guid-ance, Mater. Struct., 51: 124(5) (2018) 1-14.
[13] A. Duan, Y. Tian, J.G. Dai, W.L. Jin, A stochas-tic damage model for evaluating the internal de-terioration of concrete due to freeze-thaw action, Mater. Struct., 47(6) (2014) 1025-1039.
[14] G. Bumanis, L. Dembovska, A. Korjakins, D. Bajare, Applicability of freeze-thaw resistance testing methods for high strength concrete at extreme-52.5◦C and standard-18◦C testing condi-tions, Case Stud. Constr. Mater., 8 (2018) 139-149.
[15] G. Fagerlund, Service life with regard to frost attack- a probabilistic approach, In: Lacasse MA, Vanier DJ (eds) Proceedings of the Eighth Inter-national conference on Durability of Building Ma-terials and Components, Vancouver, (1999) 1268-1277.
[16] W. Jun, W. Xing-hao, Z. Xiao-long, A damage model of concrete under freeze-thaw cycles, J. Wuhan Univ. Technol. Mater., 18(3) (2003) 40-42.
[17] M.H. Liu, Y.F. Wang, Damage constitutive model of fly ash concrete under freeze-thaw cycles, J. Mater. Civ. Eng., 24(9) (2012) 1165-1174.
[18] H.S. Shang, Y.P. Song, Experimental study of strength and deformation of plain concrete under biaxial compression after freezing and thawing cy-cles, Cem. Concr. Res., 36(10) (2006) 1857-1864.
[19] B. Sudret, G. Defaux, M. Pendola, Stochastic evaluation of the damage length in RC beams sub-mitted to corrosion of reinforcing steel, Civ. Eng. Environ. Sys., 24(2) (2007) 165-178.
[20] B. Teply, M. Chroma, K.P. Rovnanik, Durability assessment of concrete structures: reinforcement depassivation due to carbonation, Struct. Infras-truct. Eng., 6(3) (2010) 317-327.
[21] R.E. Melchers, A.T. Beck, Structural Reliability Analysis and Prediction, John Wiley & Sons Pub-lisher, (2018).
[22] C.Q. Li, R.E. Melchers, Time-dependent reliabil-ity analysis of corrosion-induced concrete crack-ing, ACI Struc. J., 102(4) (2005) 543.
[23] F.J. Massey Jr, The Kolmogorov-Smirnov test for goodness of fit, J. Am. Stat. Assoc., 46(253) (1951) 68-78.
[24] ASTM C666, Standard test method for resistance of concrete to rapid freezing and thawing, Annual Book of Standards, Philadelphia, (2003).
[25] ASTM C33, 2014, Standard specification for con-crete aggregates, Annual Book of Standards, West Conshohocken, (2014).
[26] ASTM C617, Standard practice for capping cylin-drical concrete specimens, Annual Book of Stan-dards, West Conshohocken, (2014).
[27] ASTM C231, Standard test method for air content of freshly mixed concrete by the pressure method, Annual Book of Standards, West Conshohocken, (2014).
[28] ASTM C143, Standard test method for slump of hydraulic cement concrete, Annual Book of Stan-dards, West Conshohocken, (2014).
[29] S.M. Hosseinian, Semi-experimental model for prediction of frost resistance of normal and high-performance concrete, MSc Thesis, Isfahan Uni-versity of Technology, (2001).
[30] C.Q. Li, Computation of the failure probability of deteriorating structural systems, Compu. Struct., 56(6) (1995) 1073-1079.
[31] P.J. Tikalsky, Monte Carlo simulation of chloride diffusion in concrete exposed to deicing salts, Con-crete for Transportation Infrastructure: Proceed-ings of the International Conference held at the University of Dundee, Scotland, UK on 5-7 July (2005).
[32] X.F. Wang, Z.J. Yang, J.R. Yates, A.P. Jivkov, Ch. Zhang, Monte Carlo simulations of mesoscale fracture modelling of concrete with random aggre-gates and pores, Constr. Build. Mater., 75 (2015) 35-45.
[33] L.H. Grant, S.A. Mirza, J.G. MacGregor, Monte Carlo study of strength of concrete columns,ACI J. Proc., 75(8) (1978) 348-358.
[34] R.Y. Rubinstein, D.P. Kroese, Simulation and the Monte Carlo Method, John Wiley & Sons Pub-lisher, (2016).
[35] R.E. Melchers, C.Q. Li, W. Lawanwisut, Proba-bilistic modeling of structural deterioration of re-inforced concrete beams under saline environment corrosion, Struct. Saf., 30(5) (2008) 447-460.
[36] ACICommittee318, Building code requirements for reinforced concrete, ACI 318-14, American Concrete Institute,(2014).
[37] D.C. Montgomery, G.C. Runger, N.F. Hubele, En-gineering Statistics, John Wiley & Sons Publisher, (2012).