Http://www.ijetmr.com©International Journal of Engineering Technologies and Management Research [1]
OILSPILL AND LOOK-ALIKE SPOTS FROM SAR IMAGERY USING
OTSU METHOD AND ARTIFICIAL NEURAL NETWORK
M. Sornam *1
*1
Department of Computer Science, University of Madras, Chepauk, Chennai, India Abstract:
Oil spill pollution plays a significant role in damaging marine ecosystem. Discharge of oil due to tanker accidents has the most dangerous effects on marine environment. The main waste source is the ship based operational discharges. Synthetic Aperture Radar (SAR) can be effectively used for the detection and classification of oil spills. Oil spills appear as dark spots in SAR images. One major advantage of SAR is that it can generate imagery under all weather conditions. However, similar dark spots may arise from a range of unrelated meteorological and oceanographic phenomena, resulting in misidentification. A major focus of research in this area is the development of algorithms to distinguish ‘oil spills’ from ‘look-alikes’. The features of detected dark spot are then extracted and classified to discriminate oil spills from look-alikes. This paper describes the development of a new approach to SAR oil spill detection using Segmentation method and Artificial Neural Networks (ANN). A SAR-based oil-spill detection process consists of three stages: image segmentation, feature extraction and object recognition (classification) of the segmented objects as oil spills or look-alikes. The image segmentation was performed with Otsu method. Classification has been done using Back Propagation Network and this network classifies objects into oil spills or look-alikes according to their feature parameters. Improved results have been achieved for the discrimination of oil spills and look-alikes.
Keywords: SAR; Artificial Neural Network (ANN); Segmentation; Look-Alikes; Oil Spills.
Cite This Article: M. Sornam. (2017). “OILSPILL AND LOOK-ALIKE SPOTS FROM SAR IMAGERY USING OTSU METHOD AND ARTIFICIAL NEURAL NETWORK.”
International Journal of Engineering Technologies and Management Research, 4(11),
1-10. DOI: https://doi.org/10.29121/ijetmr.v4.i11.2017.117.
1. Introduction
Http://www.ijetmr.com©International Journal of Engineering Technologies and Management Research [2] of training iterations and minimum time of training). The optimal solution was reached by minimum training time and minimum number of training iterations.
AlaaSheta, et. al [3] was proposed an method that consists of four main stages, namely: 1) Image enhancement; 2) Image segmentation 3) feature extraction; and 4) Object recognition of the segmented objects as oil spills or look-likes. The algorithm was trained on a large number of Synthetic Aperture Radar (SAR) images. The proposed thresholding algorithm can be considered an alternative to manual inspection for large ocean areas.
Promising results and high detection rates for the oil spills had been achieved. Anne H. Schistad Solberg, et. al [4] had presented algorithms for the automatic detection of oil spills in SAR images. The developed framework consists of first detecting dark spots in the image, then computing a set of features for each dark spot, before the spot is classified as either an oil slick or a “lookalike” (other oceanographic phenomena which resemble oil slicks). The classification rule is constructed by combining statistical modeling with a rule-based approach.
Camilla Brekke, et. al [5] presented the state of the art for oil spill detection in the world oceans. They discussed different satellite sensors and oil spill detectability under varying conditions. In particular, they concentrated on the use of manual and automatic approaches to discriminate between oil slicks and look-alikes based on pattern recognition. They concluded with a discussion of suggestions for further research with respect to oil spill detection systems. F. Nirchio, et. al [7] was proposed a probabilistic method was developed that distinguishes oil spills from other similar sea surface features in Synthetic Aperture Radar (SAR) images. It considers both the radiometric and the geometric characteristics of the areas under test. In order to minimize the operator intervention, it adopts automatic selection criteria to extract the potentially polluted areas from the images. Konstantinos N. Topouzeli [8], provided a comprehensive review of the use of Synthetic Aperture Radar images (SAR) for detection of illegal discharges from ships. It summarizes the current state of the art, covering operational and research aspects of the application.
Konstantinoskarantzalos, et. al [9] was proposed the level set based image segmentation was evaluated for the real-time detection and tracking of oil spills from SAR imagery. The developed processing scheme consists of a pre-processing step, in which an advanced image simplification, followed by a geometric level set segmentation for the detection for the detection of the possible oil spills. Finally a classification was performed for the separation of look-alikes leading to oil spill extraction. Krishna Kant Singh, et. al [10] was proposed importance of image segmentation and number of algorithms had been proposed to get the best results. In this paper the author had given a study of the various algorithms that are available for color image, text and gray scale image.
Http://www.ijetmr.com©International Journal of Engineering Technologies and Management Research [3] SAR images, the method developed had successfully detected oil spills and look-alikes. Mahinda P. Pathegama, et. al [12] was proposed an algorithm to extract edge-end pixels together with their directional sensitivities as an augmentation to the currently available mathematical models. RadhikaViswanathan, et. al [13] was proposed about the different feature extraction and classification method for oil spill detection and their preliminary results.
In the present work, a new approach was developed and tested to distinguish oil spills from other similar oceanic features in marine SAR images. The discrimination between oil spills and look-alikes is usually done with the use of a classification procedure based on the different values of certain characteristics that have been observed and reported both for oil spills and look-alikes. Dark spot detection has been done using the segmentation methods called Otsu method. Once the dark spots detected, then the features of the detected spots are extracted and classified to discriminate oil spills and look-alikes. Neural networks have been employed to process remote sensing images and have achieved improved accuracy compared to traditional statistical method. However, this method improved by using a classification algorithm called Back Propagation Algorithm for oil spill identification in low-resolution images, is now operative and completely automatic monitoring system.
The remainder of the paper is organized as follows; section 2 describes existing methodology, while section 3 describes the proposed methodology. Experimental results and discussions are drawn in section 4 and section 5 presents conclusion.
2. Materials and Methods
2.1. Existing Methodology
Cost effective satellite oil spill detection systems have been studied for approximately two decades. The disadvantages of optical sensors, including the absence of any clear discriminating feature between oil spills and the surrounding sea and the unavailability of data at night or in bad weather conditions, do not apply to Synthetic Aperture Radar (SAR) sensors. A typical SAR-based oil-spill detection process consists of three stages: image segmentation, feature extraction and classification. The segmentation stage identifies the candidate features within the imagery through a binary classification of image pixels. A feature dataset is then formed by extracting contiguous features from the segmented image and deriving a quantitative description of the shape and form of each feature. The final classification stage uses the feature vector information to segregate oil spills from look-alikes.
Http://www.ijetmr.com©International Journal of Engineering Technologies and Management Research [4] In the final processing stage, a K Nearest Neighbors' classifier was used to distinguish oil spills from lookalikes based on the feature vector describing each dark object. The neighbors are taken from a set of objects for which the correct is known. This can be thought of as the training set for the algorithm, though no explicit training step is required. The k-nearest neighbor algorithm is sensitive to the local structure of the data. Using this classification method oil spill classification is done.
2.2. Proposed Methodology
In the proposed work, the development of a new approach to SAR oil spill detection using Otsu method and Artificial Neural Networks has been developed. A SAR-based oil-spill detection process consists of three stages; they are dark spot detection, dark spot feature extraction and dark spot classification. Figure 1 shows the oil spill detection system.
Figure 1: Oil Spill Detection System
Dark Spot Detection
The dark spot detection involves segmentation of images [3]. The image segmentation was performed using the segmentation technique called Otsu thresholding. It is used to perform automatically clustering based image thresholding or the reduction of gray-scale image to binary image. Therefore, the output of the segmentation stage is a binary image separating dark object from the background. The algorithm for Otsu method is given.
Algorithm for Otsu method
Step 1: Start
Step 2: Read the input SAR image (either oil spill or look-alike images). Step 3: Reshape the image from 2D gray-scale to 1D image.
Step 4: Find the histogram of the image.
Step 5: Initialize a matrix with values from 0 to 255.
Step 6: Find the weight, mean and the variance for the foreground and background of the image. Step 7: Compute result = (wbk*varbk)+(wfg*varfg).
Http://www.ijetmr.com©International Journal of Engineering Technologies and Management Research [5] Step 8: Obtain the minimum value from the result.
Step 9: Finally, convert the image to binary with the calculated threshold value to get the segmented image.
Step 10: Stop.
Dark Spot Feature Extraction
Features are very important for the classification because they are used as inputs to the classifier. Therefore, the combination of features which discriminate oil spills from the look-alikes is of very high importance for the classifier and for the method’s accuracy. In general oil spill detection methodologies traditionally use arbitrary selected quantitative and qualitative statistical features for classifying dark objects on SAR images into oil spills or look-alike phenomena. Table 1 shows the feature parameters extracted from the detected dark spot.
Table 1: Feature Parameters
Category Features
Gradient Features
Gradient Mean
Gradient Standard Deviation Power to Mean Ratio
In order to determine the most suitable parameters (features) to characterize the slicks, an analysis has been carried out on the gradient features which were used as a feature vector for classifying the dark spots. The combination of features which discriminate the oil spill from the look-alikes is of very high importance for the classifier and for the method’s accuracy. The gradient power to mean ratio is used to represent the contrast in the gradient image in quantitative terms.
Dark Spot Classification
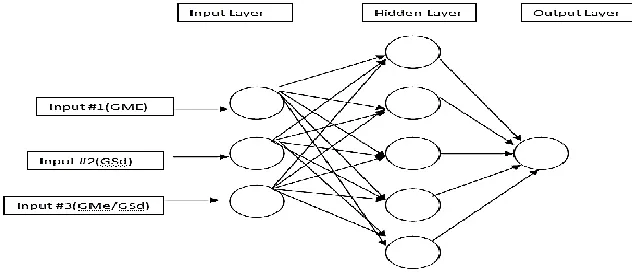
The purpose of the classifier is to differentiate the oil spills from look-alikes. Difficulty intensity of the classification task depends on the variability of the oil spill and look-alike examples [6]. During the training stage classifier learns the patterns from examples and at a later stage it is used to take a decision (classification step). Fig. 2 shows back propagation network with the topology of 3-5-1 neurons.
Http://www.ijetmr.com©International Journal of Engineering Technologies and Management Research [6] A different classification methodology is presented using artificial neural network to classify the dark formations. Artificial neural network is used as a classifier for the discrimination of oil spill from look-alikes. In this proposed method, back propagation algorithm has been implemented for oil spill classification, with network topology as 3-5-1, namely 3 input neurons, 5 neurons in the hidden layer and 1 output neuron.
3. Results and Discussions
In the proposed work, dark spot detection has been carried out by segmenting the spill area using segmentation operation based on Otsu method. Features from the segmented binary image would be extracted, then that feature parameter values were given as an input to the classifier and finally classification technique was implemented using feed forward backpropagation (BPN) algorithm. Finally, testing has been done for finding out the accuracy of classification.
The very first stage of oil spill monitoring system is segmentation operation using Otsu method. The following figure shows the segmentation operation of oil spill and look-alike SAR image.
Oil spill Otsu output Look-alike Otsu output
Figure 3: Otsu thresholding technique applied to the oil spill and look-alike SAR image
The next stage was feature extraction operation. In this, features were extracted from each binary image separating dark objects from the background. In order to construct the network architecture, these features parameter values were given as input to the artificial neural network classification. The statistical feature parameters considered for oil spill and look-alike, for the dataset [6] has been shown in table 2.
Table 2: Feature parameters used for oil spill and look-alike cases
Feature Parameter Look-alike Oil Spill
Min Max Min Max
Grad Mean Spot 0.37 0.86 0.07 0.35
Grad Std Spot 1.05 1.40 0.49 1.00
Grad Power to Mean Ratio 1.63 2.85 2.89 6.47
It was observed from Table 2, that the values for gradient mean, gradient standard deviation and gradient power to mean ratio were varied between the available examples of oil spill and look-alike spots.
Http://www.ijetmr.com©International Journal of Engineering Technologies and Management Research [7] recognizing the oil spill from look-alike give more accurate values. In all the cases, the 3-5-1 network architecture proved optimal among the other architectures. Fig. 4 shows the training accuracy of the neural network.
Figure 4: Training accuracy of neural network classifier
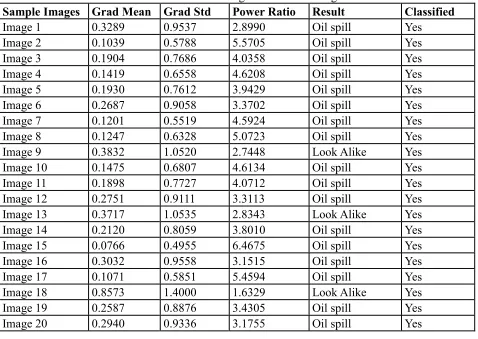
Table 3: 20 SAR images used for training
Sample Images Grad Mean Grad Std Power Ratio Result Classified
Image 1 0.3289 0.9537 2.8990 Oil spill Yes
Image 2 0.1039 0.5788 5.5705 Oil spill Yes
Image 3 0.1904 0.7686 4.0358 Oil spill Yes
Image 4 0.1419 0.6558 4.6208 Oil spill Yes
Image 5 0.1930 0.7612 3.9429 Oil spill Yes
Image 6 0.2687 0.9058 3.3702 Oil spill Yes
Image 7 0.1201 0.5519 4.5924 Oil spill Yes
Image 8 0.1247 0.6328 5.0723 Oil spill Yes
Image 9 0.3832 1.0520 2.7448 Look Alike Yes
Image 10 0.1475 0.6807 4.6134 Oil spill Yes
Image 11 0.1898 0.7727 4.0712 Oil spill Yes
Image 12 0.2751 0.9111 3.3113 Oil spill Yes
Image 13 0.3717 1.0535 2.8343 Look Alike Yes
Image 14 0.2120 0.8059 3.8010 Oil spill Yes
Image 15 0.0766 0.4955 6.4675 Oil spill Yes
Image 16 0.3032 0.9558 3.1515 Oil spill Yes
Image 17 0.1071 0.5851 5.4594 Oil spill Yes
Image 18 0.8573 1.4000 1.6329 Look Alike Yes
Image 19 0.2587 0.8876 3.4305 Oil spill Yes
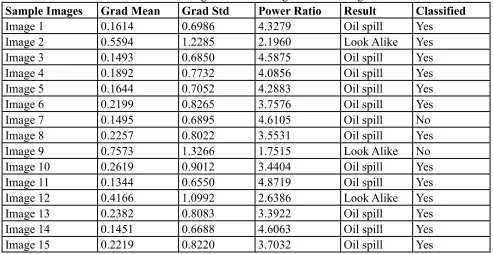
Http://www.ijetmr.com©International Journal of Engineering Technologies and Management Research [8] Table 4: Testing of 15 SAR images after training
Sample Images Grad Mean Grad Std Power Ratio Result Classified
Image 1 0.1614 0.6986 4.3279 Oil spill Yes
Image 2 0.5594 1.2285 2.1960 Look Alike Yes
Image 3 0.1493 0.6850 4.5875 Oil spill Yes
Image 4 0.1892 0.7732 4.0856 Oil spill Yes
Image 5 0.1644 0.7052 4.2883 Oil spill Yes
Image 6 0.2199 0.8265 3.7576 Oil spill Yes
Image 7 0.1495 0.6895 4.6105 Oil spill No
Image 8 0.2257 0.8022 3.5531 Oil spill Yes
Image 9 0.7573 1.3266 1.7515 Look Alike No
Image 10 0.2619 0.9012 3.4404 Oil spill Yes
Image 11 0.1344 0.6550 4.8719 Oil spill Yes
Image 12 0.4166 1.0992 2.6386 Look Alike Yes
Image 13 0.2382 0.8083 3.3922 Oil spill Yes
Image 14 0.1451 0.6688 4.6063 Oil spill Yes
Image 15 0.2219 0.8220 3.7032 Oil spill Yes
The developed system has been applied and tested with thirty five ESA and ENVISAT SAR images, which are available from the CEARAC SAR image database [6]. The above tables (Table 3 and Table 4) show training and testing of oil spill and look-alike SAR images in classification. So, it has been found that artificial neural network based on Backpropagation algorithm achieves the optimal result in discriminating oil spill from look-alike, since most of SAR images are correctly classified. The overall success rate of BPN network is shown in table 5.
Table 5: BPN Success Rate
Category Classification Result
Correctly Classified Mis-Classified Success Rate
Oil Spill 28 1 96.5 %
Look-alike 5 1 83 %
Table 6: Comparison between Existing Work and Proposed Work
Category K Nearest Neighbors Algorithm Back Propagation Algorithm
Number of Images 30 35
Success Rate 86% 94%
Http://www.ijetmr.com©International Journal of Engineering Technologies and Management Research [9] Figure 5: Final classification of oil spill through ANN training
Figure 6: Final classification of look-alike through ANN training
4. Conclusion
In the proposed method, an oil spill detection algorithm was implemented by hybridizing Otsu method and artificial neural network technique. The presented algorithm can distinguish between oil spills and look-alikes. The experimental results demonstrate that the proposed segmentation algorithm has the ability to detect the dark spot correctly and neural network was used as a classifier for discriminating the oil spills from look-alikes. Oil spill classification accuracies were highly dependent on the feature set selection. Here gradient features were used for the evaluation criteria for classification. The classification stage achieved an accuracy of 94%. Hence, this accuracy of algorithm shows that the system is valuable in order to reduce the amount of images for manual inspection in an operational oil spill detection service. The largest challenge in detection of oil spills in SAR images is accurate discrimination between oil spills and look-alikes. As the system is based on neural network training, the quality of the detection increases with increasing amount of data.
References
[1] A. Akkartal, F. Sunara, The Usage Of Radar Images In Oil Spill Detection, The International
Http://www.ijetmr.com©International Journal of Engineering Technologies and Management Research [10]
[2] Akram A. Moustafa, Performance Evaluation of Artificial Neural Networks for Spatial Data
Analysis, Contemporary Engineering Sciences, Vol. 4, 2011, no. 4, 149 – 163.
[3] AlaaSheta, MouhammdAlkasassbeh, Malik Braik and Hafsa Abu AyyashDetection of Oil Spills
in SAR Images using Threshold Segmentation Algorithms, International Journal of Computer Applications (0975 - 8887) Volume 57 - No. 7, November 2012.
[4] Anne H. Schistad Solberg, GeirStorvik, Rune Solberg, and EspenVolden, Automatic Detection of
Oil Spills in ERS SAR Images, IEEE Transactions On Geoscience And Remote Sensing, Vol. 37, No. 4, July 1999.
[5] Camilla Brekkea, Anne H.S. Solberg, Oil spill detection by satellite remote sensing, Remote
Sensing of Environment 95 (2005) 1–13, 2004 Elsevier Inc.
[6] CEARAC SAR images database: http://cearac.poi.dvo.ru/en//db/
[7] F. Nirchio, S. Di Tomaso, W. Biamino, E. Parisato, P. Trivero, A. Giancaspro,Oil Spills
Automatic Detection From Sar Images, Proc. of the 2004 Envisat& ERS Symposium, Salzburg, Austria 6-10 September 2004.
[8] Konstantinos N. Topouzelis, Oil Spill Detection by SAR Images: Dark Formation Detection,
Feature Extraction and Classification Algorithms, Review Sensors 2008, 8, 6642-6659.
[9] Konstantinoskarantzalos, DemetreArgialas, Automatic detection and tracking of oil spills in SAR
imagery with level set segmentation, International Journal of Remote Sensing, 2008.
[10] Krishna Kant Singh1 , Akansha Singh2, A Study Of Image Segmentation Algorithms For
Different Types Of Images, IJCSI International Journal of Computer Science Issues, Vol. 7, Issue 5,September 2010.
[11] K. Topouzelis, V. Karathanassi, P. Pavlakis and D. Rokos, Oil Spill Detection: SAR Multi-scale
Segmentation & Object Features Evaluation, Proceedings of SPIE Vol. 4880 (2003) © 2003.
[12] Mahinda P. Pathegama and ÖzdemirGöl, Edge-end Pixel Extraction for Edge-based Image
Segmentation, International Journal of Computer, Information, Systems and Control Engineering Vol:1 No:2, 2007.
[13] RadhikaViswanathan and PadmavathiGanapathi, Feature Extraction and classification of Oil spill
in SAR Imagery, IJCSI International Journal of Computer Science Issues, Vol. 8, Issue 5, No 2, and September 2011.
*Corresponding author.