www.geosci-instrum-method-data-syst.net/6/9/2017/ doi:10.5194/gi-6-9-2017
© Author(s) 2017. CC Attribution 3.0 License.
Video cascade accumulation of the total solar
eclipse on Svalbard 2015
Fred Sigernes1,8, Pål Gunnar Ellingsen1,8, Noora Partamies1,8, Mikko Syrjäsuo1,8, Pål Brekke2,8,
Silje Eriksen Holmen1,8, Arne Danielsen3, Bernt Olsen4, Xiangcai Chen1,8, Margit Dyrland1, Lisa Baddeley1,8, Dag Arne Lorentzen1,8, Marcus Aleksander Krogtoft5, Torstein Dragland5, Hans Mortensson5, Lisbeth Smistad5, Craig J. Heinselman6, and Shadia Habbal7
1The University Centre in Svalbard (UNIS), 9171 Longyearbyen, Norway 2Norwegian Space Centre, Oslo, Norway
3Brages 2, 1540 Vestby, Akershus, Norway
4Norwegian Broadcasting Corporation (NRK) Troms and Finnmark, Tromsø, Norway 5Lufttransport AS, Longyearbyen, Norway
6EISCAT Scientific Association, Kiruna, Sweden
7Institute for Astronomy, University of Hawaii, Honolulu, USA
8The Birkeland Centre for Space Science (BCSS), University of Bergen, Bergen, Norway
Correspondence to:Fred Sigernes ([email protected])
Received: 17 June 2016 – Published in Geosci. Instrum. Method. Data Syst. Discuss.: 1 September 2016 Revised: 22 December 2016 – Accepted: 28 December 2016 – Published: 13 January 2017
Abstract. This work presents a novel image accumulation filter technique that reveals small-scale features and details from intense luminosity or high dynamic range (HDR) video recordings. It was discovered and developed from the analy-ses of the Norwegian Broadcasting Corporation (NRK) film of the total solar eclipse that occurred Friday 20 March 2015 in Longyearbyen (78◦N, 15◦E) on Svalbard, Norway. The result of the filter is fused with a HDR image of the corona and the Solar Dynamic Observatory (SDO) image of the so-lar disk.
1 Introduction
Stacking or accumulating camera frames is a well-known technique in astrophysics (see Berry and Burnell, 2005). The track-and-stack technique is an effective method to obtain long exposures from many short ones of faint deep-sky ob-jects while tracking. Accumulation will reduce noise and in-crease the dynamical range. An inexpensive web camera sen-sor is capable of capturing a large number of faint and noisy exposures that can be stacked into sharp and clear images of deep-sky objects. Free software such as RegiStax (2008)
is widely used to align, stack, and process astronomical im-ages. Another benefit of high frame rate and short exposures is that it can be used to minimize atmospheric effects such as seeing (Law et al., 2006; Baldwin et al., 2008).
2 Target: the total solar eclipse on Svalbard 2015 The total solar eclipse on Friday 20 March 2015 started in the western Atlantic, 650 km west of Canada’s Labrador coast and 450 km south of the southern tip of Greenland. It then raced across the Atlantic Ocean touching land at only two places: the Faroe Islands (between Scotland and Iceland) and the Svalbard Archipelago.
In Longyearbyen (78◦N, 15◦E), Svalbard, the first con-tact, the start of the partial eclipse, started at 09:11:53 UT. About 59 min later, at 10:10:43 UT the second contact took place, marking the start of totality. After a mere 2 min and 27 s, the third contact occurred at 10:13:10 UT, which marked the end of totality and the disappearance of the corona. This was followed by a partial phase of about an-other 59 min before fourth contact and the end of the solar eclipse at 11:12:21 UT.
3 Experimental setup
Two cameras were used to capture the totality. A professional digital video camera captured 448 frames while a coronal telescope connected to a DSLR camera head captured 20 im-ages during the totality.
3.1 The digital video camera
The event was filmed by the Norwegian Broadcasting Corpo-ration (NRK) at Nordlysstasjonen, the old auroral station in Adventdalen. The station is located∼4 km east of Longyear-byen. The film was broadcasted in real time on the internet with close to 600 000 followers.
The NRK Sony camera model PXW-X500 was mounted on a tripod and the Sun was tracked manually. The camera is shown in Fig. 1. The lens was a Canon x 36 super zoom lens with the aperture set to f/5.6. Fully zoomed in, the effective focal length was close to 1000 mm. An Baader AstroSolar safety film was used as a protection filter prior to totality. The exposure time and aperture were manually controlled by the operator.
3.2 The coronal HDR telescope
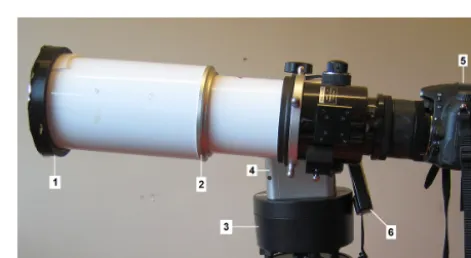
In order to image the full extent of the corona a Nikon D7000 DSLR camera mounted on a 400 mm focal length telescope was set up at Nordlysstasjonen. Figure 2 shows the exper-imental setup. The telescope is a triplet-lens apochromatic refractor with an aperture of 80 mm from the company Sky-Watcher, model Esprit-80ED. A field flattener corrector is in-stalled between the triplet and the camera head to match and optimize the illumination of the sensor chip. The telescope was mounted on an azimuth-elevation tracker, from the com-pany iOptron, model Minitower II. The assembled system tracked the total eclipse with a nominal maximum angular error of 0.1 arcsec.
Figure 1.Sony model PXW-X500 professional camcorder. Source: (http://www.sony.com).
Figure 2. The coronal high dynamic range (HDR) eclipse tele-scope. (1) Astro-Baader solar protection filter (ND=5), (2) Sky-Watcher Esprit 80ED telescope, (3) tripod head, (4) azimuth-elevation tracker, (5) Nikon D7000 DSLR camera, and (6) tracker controller.
Twenty images of the totality were taken with variable ex-posure time ranging from 0.002 up to 2 s at ISO 100. After alignment of the sequence, images with the same exposure were median filtered to reduce noise. The open-source soft-ware Luminance HDR (2015) was used to produce a final HDR image. Tone-mapping was used to improve the visual appearance employing the methods developed by Debevec and Malic (1997) and Mantiuk et al. (2006). The technique is well known in photography as exposure bracketing.
4 The video filter algorithm
4.1 Alignment of images
If we defineI0(x, y)andIj(x, y)as two frames in a sequence
ofj=0 to(N−1)images, where(x, y)are the pixel coor-dinates, the spatial shift between the frames can be found using the Fourier shift theorem (Reddy and Chatterji, 1996). The displacement between two images is found by locating the coordinates of the maximum value in the real part of the inverse Fourier transform (FT) of the ratio
R=F0· ¯Fj/ F0·Fj
, (1)
whereF0=F T (I0)andFj=F T (Ij). For local
optimiza-tion at sub-pixel scale, the maximum shift correlaoptimiza-tion be-tweenI0andIj is found by sub-pixel displacements of 0.1
within a window of±10 pixels in bothxandydirection. The linear Pearson correlation coefficient function and the float number shift routine by Lindler (1992) in IDL (Interactive Data Language) are used.
Note that rotation and scale changes due to atmospheric turbulence are neglected in the above calculations. ImageI0 should be kept fixed as a reference shift frame. Otherwise, the sequence will drift incrementally. In the following we as-sume that the frames are aligned and denoted Ij(x, y) for
simplicity.
4.2 Accumulation of video sequence
The video frames have small intensity level changes due to both instrument effects and manual adjustments by the cam-era crew. The target, the total eclipse, is assumed to be stable in intensity during the time the video was captured. Thus, we can use one of the images as the reference and mitigate the instrument effects by taking advantage of the time series. A simple linear model to estimate intensity changes between each color channel is defined as
I0(x, y)=αj·Ij(x, y)+βj. (2)
Hereαj andβj are defined as the effective software gain
and background level, respectively. If we choose pixel val-ues where the target is well defined in shape and stable in intensity, such as the diagonal crossing the center of the Sun, the above coefficients can be estimated for each frame by the least absolute deviation (LAD) method. The IDL func-tion LADFIT.PRO by Press et al. (1992) is used for this pur-pose. The method is robust and fast. In this study, we have assumed a linear response from the camera allowing a very trivial correction of fluctuations in gain and background lev-els by using Eq. (2). If the true intensity response curve is known, the intensities should first be converted into a linear scale to minimize estimation errors. Table 1 shows that the calculated values ofαj andβj are indeed fairly stable with
low standard deviations forN =448 video frames of the to-tality. This corresponds to a recording time of 17.92 s of the totality where the camera was not moved by the operator. The
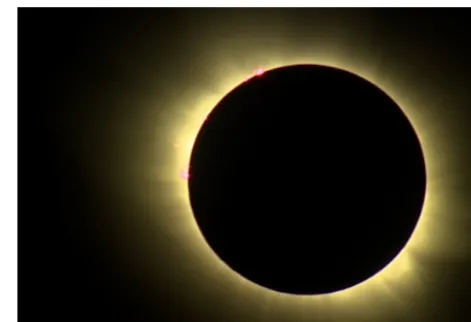
Figure 3.Accumulated color video frames of the total eclipse on Svalbard, 20 March 2015. A total of 448 frames of the NRK video are used.
camera was fixed with the eclipse moving in the field of view only due to the rotation of Earth.
Next, the accumulated frames are now defined as
I (x, y)= N−1 X
j=0
αj·Ij(x, y)+βj= N−1
X
j=0
Ijs(x, y). (3)
Ifj=0, thenα0=1 andβ0=0. The reference intensity I0 is then chosen to be the first frame in the sequence, al-though it can also be any other frame.
Figure 3 shows the result of applying Eqs. (1)–(3). Note the intense pink-colored bright features that rise out of the background continuum, localized close to the solar limb. These emissions are from hydrogen and helium and are asso-ciated with prominences. Coronal streamers are also clearly detected, but structures close to the limb appear too blurry to be identified.
4.3 High-pass cascading
Equation (3) may be modified to include a filter that en-hances small-scale edges in each of the frames in the se-quence. A high-frequency emphasis filter,F, is known to en-hance small-scale features and edges can be detected by the use of a histogram-scale Laplacian filter,S. The next step is to add the filtered result to the original frame
Ijc=Ijs+S(F (Ijs))=Ijs+S(k·Ijs−L(Ijs)), (4) whereL is a low-pass filter and k=1.1 the amplification factor recommended by Gonzales and Woods (1992). Higher values of k tend to increase the background too much. In IDL the low-pass filter L is the SMOOTH.PRO function. It uses the boxcar average of a specified pixel width, w. SHARPEN.PRO by Fanning (2003) is the Laplacian filter used. The IDL code for Eq. (4) then becomes
Table 1.Calculated average color channel software gain (α) and background values (β) according to Eq. (2) forN=448 frames of the NRK video sequence.σαandσβare the corresponding standard deviation forαandβ, respectively.
Color channel Averageα Standard deviationσα Averageβ Standard deviationσβ
Red 1.006 0.007 −25.58 0.48
Green 1.004 0.007 −23.27 0.27
Blue 1.020 0.016 −20.02 0.27
Figure 4.High-pass cascade emphasis filter applied to single green channel NRK video frame. (a) is input video frame, (b) high-frequency emphasis-filtered frame, (c)edge enhancement of (b), and(d)is(a)and(c)added.
The net accumulated result of Eq. (3) combined with Eq. (4) is named a high-pass cascade emphasis filter:
I0(x, y)= N−1
X
j=0
Ijc(x, y). (6)
Figure 4 shows an example of how the above filter works on a single green channel frame forw=5. The high-frequency emphasis filter increases noise and sharp intensity transitions in the image. The latter is enhanced by the gradient filter. The net result is added to the original frame. The detected transition points appear in Fig. 4c to be randomly aligned with the small-scale features that are seen in Fig. 4b. The variation must be caused by scintillation or any other high-frequency change in camera response and noise. Accumula-tion of a large number of frames should solve this problem.
5 Results and discussion
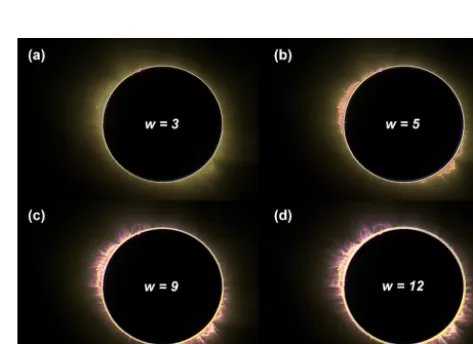
The accumulated high-pass cascade emphasis filter images are visualized in Fig. 5 as a function of boxcar width, w. It is clear that the accumulation of filtered frames makes the intense blurry chromospheric regions close to the solar limb appear more structured. Chromospheric loops, spicules, plumes, and prominences are now identified. These features
Figure 5. Accumulated high-pass cascade-filtered color images. Boxcar filter sizes in pixels are for panels (a) 3×3, (b) 5×5,
(c) 9×9, and (d) 12×12. A total of 448 color frames of the NRK video are used. The apparent color changes are predominantly caused by processing the frames without a rigorous camera calibra-tion, which is required to measure absolute colors.
have edges and abrupt changes in intensity representing the high-frequency components of the image. The choice of smoothing mask or boxcar size in the low-pass filter deter-mines the level of detail detected. The effect is seen as an increase of width of the circular solar limb as the pixel width wincreases. The best results to identify loops and spots are obtained withw∈ [3,5]. Higher values tend to emphasize larger-scale edges further out in the corona, with less detail in the chromosphere. It should be noted that our technique could be improved by applying a Fourier transform-based low-pass filter to reduce sharp intensity edge effects. There is also a color shift from faint green-yellow to pink with in-creasing boxcar width in Fig. 5 associated with change in color balance in the composite images, indicating that our technique is not conservative.
re-Figure 6.Two filter techniques side by side.(a)Accumulated high-pass cascade-filtered color image. A total of 448 color frames of the NRK video are used with a boxcar width of w=5. Identified features are (1) loops and spicules region, (2) bright plumes, and (3) prominences. Two zoom windows show the prominences mag-nified two times.(b)Wavelets enhanced image using the RegiStax (2008) software.
sults are shown side by side in Fig. 6 for a boxcar width of w=5. The spatial enhanced image is a combination of two layers of Gaussian wavelets. It is clear, even though the im-age appears to be noisy, that the same features are detected with the wavelet technique as with the cascade filter. The identified loops, spicules, plumes, and prominences are all known features that appear in the chromosphere. Also note the difference in the colors. Each color channel is indepen-dently processed in the cascade filter before the creation of the composite RGB. The emphasized edges and features have spatially distinct color difference as a function of color chan-nel. The prominences appear to be spatially multi-colored with a clear distinct blue core close to the solar limb sur-rounded by a red plume with yellow or weak green outward borders. The loops and spicules are more orange to red in appearance. The blue and red colors are most likely associ-ated with hydrogen Balmer line emissions (Hγ, Hβ andHα).
The yellow to green color is a mixture of the Hα and the
He (D3) lines. These are the strongest line emissions from prominences in the visible spectrum (see Slocum, 1912).
It must be emphasized that the wavelet transform is a pow-erful tool since it can produce an unlimited range of spatial frequencies and scales, but it requires interactive user input to produce the final image. Our attempt to reproduce the event might not be the optimum choice of wavelet scheme. The cascade filter does not require any interactive feedback, ex-cept for choice of boxcar size. On the other hand, a fused interactive combination of cascading as a function of boxcar size could also be used to emphasize features and structures with different size and scale. The novelty in our simple tech-nique is the accumulated effect of adding edge detection to the high-frequency emphasis component of each individual frame in a sequence of images. Only basic low- and high-pass filters are used, which makes the filter easy to implement in any high-level program language such as IDL or MATLAB.
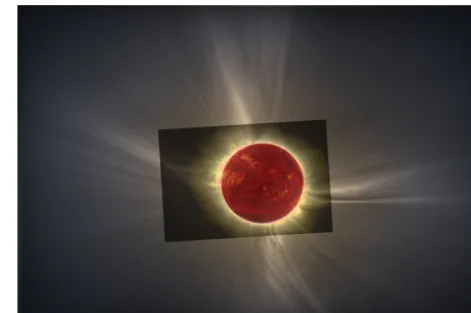
Finally, it is now possible to compose an image of the Sun using the video accumulation, the HDR image from the
tele-Figure 7. Composite image of the total eclipse as seen from Longyearbyen, 20 March 2015. The white light-colored corona is composed of 20 snapshots from a Nikon D7000 at ISO 100 with exposure times in the range 0.002–2 s. The inner yellow image with dark background is a video accumulation of 448 frames by NRK applying a high-frequency emphasis cascade filter. The solar disk is filled with a red-colored Helium II image at 304 nm from the Solar Dynamics Observatory (SDO).
scope, and the Helium II Solar Dynamic Observatory (SDO) image at 304 nm. The last was obtained at 10:24:20 UT, which is only 670 s after the end of the totality in Longyear-byen. The result is shown in Fig. 7. The HDR image is fused with the accumulated image in Fig. 3 and the filter image in Fig. 5a. The SDO image and the video accumulations are resized and rotated to match the HDR image. The program Paint.net for Microsoft Windows was used in the fusion. The matching criterion is based on aligning the two prominences located in the upper left quadrant and the Helmet streamers identified in both the video accumulation and in the coronal HDR image. The SDO image is rotated 23◦ clockwise and rescaled to match the diameter of the solar disk. As a result, the intense chromospheric regions in the SDO image align up with the detected loop region in the video accumulation.
Note that if we knew the power of the cascade filter prior to the eclipse, then the video sequence should have been recorded by the DSLR camera of the coronal telescope in-stead of the NRK video camera. The video frames will then match and align with the HDR image. No rotation between the different camera systems would then be necessary.
6 Conclusions
The principal results obtained in the study can be summa-rized as follows.
1. The total solar eclipse event on Svalbard on 20 March 2015 gave us a unique opportunity to image the up-per parts of the Sun’s atmosphere. High dynamic range imaging revealed four large structured coronal helmet streamer belts that fold beyond our field of view, close to five solar radii.
2. A novel high-pass cascade emphasis filter technique is presented that is capable of distinguishing multi-colored features such as loops, spicules, plumes, and promi-nences from the intense and blurry regions of the NRK video.
3. Based on our result, we encourage future eclipse pho-tographers to include – in addition to standard brack-eting – a∼15 s high-frame-rate video recording of the event. This makes it possible to apply our filter to en-hance the high-luminosity regions of the inner corona and chromosphere.
7 Data availability
The authors of the paper state that all the data are publicly available. The raw data for this paper can be downloaded here: http://kho.unis.no/Eclipse/Rawdata/Rawdata.zip.
Competing interests. The authors declare that they have no conflict of interest.
Acknowledgement. We wish to thank the Solar Dynamics Obser-vatory (SDO) for their excellent webpage (http://sdo.gsfc.nasa.gov) and free access to solar images. We also thank Kjellmar Oksavik from the Birkeland Centre for Space Science (BCSS) for fruitful discussions and media support during the eclipse.
Edited by: A. Benedetto
Reviewed by: R. Michell and three anonymous referees
References
Baldwin, J. E., Warner, P. J., and Mackay, C. D.: The point spread function in Luck Imaging and variations in see-ing on short timescales, Astron. Astrophys., 480, 589–597, doi:10.1051/0004-6361:20079214, 2008.
Berry, R. and Burnell, J.: The Handbook of Astronomical Image Processing, Willmann-Bell, Inc., 130–141, ISBN 0-943396-82-4, 2005.
Debevec, P. E. and Malik, J.: Recovering high dynamic range radi-ance maps from photographs, SIGGRAPH 97 Conf. Proc., 369– 378, doi:10.1145/258734.258884, 1997.
Fanning, D.: Coyote’s Guide to IDL Programming, http://www. idlcoyote.com, 2003.
Gonzalez, R. C. and Woods, R. E.: Digital Image processing, Addi-son Wesley World Student series, 196–197, ISBN 0-201-60078-1, 1992.
Law, N. M., Mackay, C. D., and Baldwin, J. E.: Lucky imag-ing: high angular resolution imaging in the visible from the ground*, Astron. Astrophys., 446, 739–745, doi:10.1051/0004-6361:20053695, 2006.
Low, B. C.: Solar Activity and the Corona, Sol. Phys., 167, 217– 265, doi:10.1007/BF00146338, 1996.
Lindler, D.: The IDL Astronomy User’s Library, http://idlastro.gsfc. nasa.gov/, 1992.
Luminance HDR: A complete open source solution for HDR pho-tography, http://qtpfsgui.sourceforge.net/, 2015.
Mantiuk, R., Myszkowski, K., and Seidel, H.-P.: A perceptual framework for contrast processing of high dynamic range im-ages, ACM Transactions on Applied Perception, 3, 286–308, DOI:10.1145/1166087.1166095, 2006.
Press, W. H., Teukolsky, S. A., Vetterling, W. T., and Flannery, B. P.: Numerical recipes in C, The Art of Scientific Computing, Sec-ond Edition, Cambridge University Press, 703–705, ISBN 0-521-43108-5, 1992.
Reddy, B. S. and Chatterji, B. N.: An FFT-based technique for trans-lation, rotation, and scale-invariant image registration, IEEE T. Image Process., 5, 1266–1271, doi:10.1109/83.506761, 1996. RegiStax: Free image processing software, http://www.astronomie.
be/registax/, 2008.