R E S E A R C H
Open Access
Directional association test reveals
high-quality putative cancer driver
biomarkers including noncoding RNAs
Hua Zhong
1and Mingzhou Song
1,2 *From14th International Symposium on Bioinformatics Research and Applications (ISBRA’18) Beijing, China. 8-11 June 2018
Abstract
Background: Most statistical methods used to identify cancer driver genes are either biased due to choice of assumed parametric models or insensitive to directional relationships important for causal inference. To overcome modeling biases and directional insensitivity, a recent statistical functional chi-squared test (FunChisq) detects directional association via model-free functional dependency. FunChisq examines patterns pointing from independent to dependent variables arising from linear, non-linear, or many-to-one functional relationships. Meanwhile, the Functional Annotation of Mammalian Genome 5 (FANTOM5) project surveyed gene expression at over 200,000 transcription start sites (TSSs) in nearly all human tissue types, primary cell types, and cancer cell lines. The data cover TSSs originated from both coding and noncoding genes. For the vast uncharacterized human TSSs that may exhibit complex patterns in cancer versus normal tissues, the model-free property of FunChisq provides us an unprecedented opportunity to assess the evidence for a gene’s directional effect on human cancer.
Results: We first evaluated FunChisq and six other methods using 719 curated cancer genes on the FANTOM5 data. FunChisq performed best in detecting known cancer driver genes from non-cancer genes. We also show the capacity of FunChisq to reveal non-monotonic patterns of functional association, to which typical differential analysis methods such ast-test are insensitive. Further applying FunChisq to screen unannotated TSSs in FANTOM5, we predicted 1108 putative cancer driver noncoding RNAs, stronger than 90% of curated cancer driver genes. Next, we compared leukemia samples against other samples in FANTOM5 and FunChisq predicted 332/79 potential biomarkers for lymphoid/myeloid leukemia, stronger than the TSSs of all 87/100 known driver genes in lymphoid/myeloid leukemia.
Conclusions: This study demonstrated the advantage of FunChisq in revealing directional association, especially in detecting non-monotonic patterns. Here, we also provide the most comprehensive catalog of high-quality
biomarkers that may play a causative role in human cancers, including putative cancer driver noncoding RNAs and lymphoid/myeloid leukemia specific biomarkers.
Keywords: FunChisq, Non-monotonic directional association, Human cancer, Cancer driver gene, Noncoding RNA, Leukemia, Biomarker
*Correspondence:[email protected]
1Department of Computer Science, New Mexico State University, University
Ave, 88003, Las Cruces, NM, USA
2Molecular Biology Graduate Program, New Mexico State University, University
Ave, 88003, Las Cruces, NM, USA
Background
Greatly outnumbering coding genes, noncoding RNA (ncRNA) genes remain elusive in our understanding of their function. Among various ncRNAs, microRNA, long noncoding RNA, and enhancer RNA are the most heav-ily studied and some are deregulated in cancer [1–3]. Due to technical challenges caused by their typically low abun-dance, ncRNA profiles of cancer are yet widely available. For example, even in The Cancer Genome Atlas (TCGA) project [4], the expression of non-polyadenylated ncR-NAs in tumor samples is not provided. Encouragingly, the Functional Annotation of Mammalian Genome 5 (FAN-TOM5) project [5] measured promoter-level transcrip-tome data at 209,911 transcription start sites (TSSs) in 752 human samples covering all major human tissue types, primary cell types, and notably many cancer cell lines represented by 225 samples. Such a sampling diversity captured a wealth of system dynamics. Additionally, tech-nical variations introduced in data acquisition are minimal because all samples in the project were sequenced at the same facility housed in RIKEN, Japan. More than half (107,139) of the TSSs are unannotated, pointing to most likely novel ncRNAs. Therefore, the FANTOM5 data set opens up an enormous opportunity to study the role for ncRNAs in cancer.
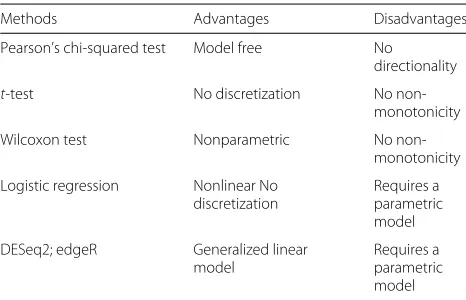
Most statistical methods used to identify cancer marker genes [6, 7] are either biased due to parametric model choices, insensitive to directional causal relationships, or unable to reveal non-monotonic patterns. Table1 summa-rizes advantages and disadvantages of several widely used biomarker detection methods. A symmetric association test reveals no directionality of a pattern, and thus cannot infer causality. Differential gene expression analysis meth-ods are often unable to detect non-monotonic patterns from gene to phenotype, commonly seen in biological systems. Logistic regression can fit a nonlinear function but requires a correct parametric model. To overcome these issues, the functional chi-squared test (FunChisq)
Table 1Comparison of widely used biomarker detection methods
Methods Advantages Disadvantages
Pearson’s chi-squared test Model free No
directionality
t-test No discretization No
non-monotonicity
Wilcoxon test Nonparametric No
non-monotonicity
Logistic regression Nonlinear No discretization
Requires a parametric model
DESeq2; edgeR Generalized linear
model
Requires a parametric model
[8–10] is a recently developed statistical test for direc-tional association via model-free funcdirec-tional dependency. The FunChisq test statistic is computed from a con-tingency table, where the row variable represents inde-pendent variable X and the column variable for depen-dent variable Y. When both X and Y are numeric or ordinal, we can define the monotonicity of a pat-tern. X to Y is monotonically increasing/decreasing if
Y never decreases/increases as X increases. X to Y is non-monotonic ifY can both increase at one point and decrease at another as X increases. The FunChisq test statistic is maximized by either one-to-one or many-to-one non-constant functions fromXtoY given marginal sums of dependent variableY. Thus, FunChisq is sensitive to both monotonic and non-monotonic functional pat-terns. The original FunChisq test established an asymp-totic chi-squared null distribution for the test statistic [8]. An exact functional test using the same test statistic has been developed to compute its statistical significance based on an exact, instead of asymptotic, null distribution [9]. We also introduce function indexξf, derived from the FunChisq statistic, to measure the effect size of functional dependency. The relationship of the index to thep-value of the FunChisq test statistic is analogous to that of fold-change top-value in differential gene expression analysis. The pair of fold change and p-value is often visualized together in a volcano plot. Similarly, examining both the function index and the FunChisq p-value disfavors pat-terns either weak in functional dependency or statistically insignificant, leading to increased confidence in causal inference.
On FANTOM5 data, we first evaluated FunChisq and six other methods using 719 curated cancer genes. Fun-Chisq performed best in detecting known cancer driver genes from non-cancer genes. We also show the capac-ity of FunChisq to reveal non-monotonic patterns, to which typical differential analysis method such as t-test are insensitive. We further applied FunChisq on unan-notated human TSSs in FANTOM5, and predicted 1108 ncRNAs as putative cancer drivers. They have directional association to cancer stronger than 90% of the curated cancer driver genes. Next, we compared leukemia sam-ples against other samsam-ples in FANTOM5 and FunChisq predicted potential biomarkers for lymphoid leukemia and for myeloid leukemia, stronger than all known driver genes of the two leukemia types.
This study demonstrates that FunChisq indeed detected many non-monotonic TSS-cancer association patterns, to which previous methods may be blind. As the TSS-cancer associations are predicted by directional functional dependency without assuming a parametric model, we have provided the most comprehensive and unbiased cat-alog of high-quality noncoding and coding RNA TSSs that may be causative factors to human cancers.
Results
FunChisq is powerful in detecting known human cancer genes
We evaluated the performance of FunChisq and six other tests in distinguishing 719 curated cancer genes on FAN-TOM5 human data. The six other tests include Pearson’s chi-squared test [12], Wilcoxon test [13],t-test [14], logis-tic regression [15], DESeq2 [16], and edgeR [17]. The curated cancer genes were obtained from Cancer Gene Census [18] in COSMIC Release v83. The ground truth in the evaluation was generated with true cancer driver genes and non-cancer-associated genes. For each cancer driver gene, we extracted its representative TSS, which was the most transcribed among all TSSs of the same gene. However, non-cancer-associated genes are not typically reported in the literature. Thus, excluding curated cancer genes, we randomly picked the same number of TSSs— most likely non-cancer TSSs. Then we evaluated all seven methods for their performance in revealing true cancer driver gene TSSs. DESep2 and edgeR were tested on raw read count data, while the other methods on discrete data transformed from expression data in the unit of tags per million (TPM). Specifically, we used the R package
Ckmeans.1d.dp[19,20] to discretize the log-transformed TPM abundance from all samples for each TSS, before which numbers of discretization levels for each gene were automatically determined by R package mclust [21] by fitting a finite Gaussian mixture model.
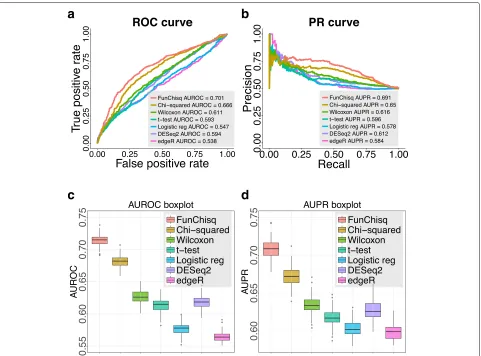
The performance of the seven methods on detecting cancer TSSs from FANTOM5 data is summarized in
Fig.1. The receiver operating characteristic (ROC) curves in Fig.1a and precision-recall (PR) curves in Fig.1b indi-cate that FunChisq outperformed the other six methods. We repeated the same evaluation on 100 different sets of randomly selected non-cancer TSSs. Figure1c,d show that the areas under the ROC and PR curves of FunChisq are markedly better than all other six methods, demon-strating the advantage of FunChisq. The fact that direc-tional FunChisq scored better than directionless Pearson’s chi-squared test suggests the importance of direction in detecting cancer genes. FunChisq also performed much better than the other five methods (Wilcoxon test,t-test, DESeq2, edgeR, and logistic regression) not designed for detecting non-monotonic patterns, suggesting the impor-tance of detecting such patterns when analyzing cancer driver gene expression, as demonstrated in the next sub-section.
FunChisq is sensitive to non-monotonic patterns
On the whole-body FANTOM5 human transcriptome data, we showcase non-monotonic interaction patterns between TSS abundance of two known cancer genes,
KAT6A(also known asMYST3andMOZ) [22] andBRAF
[23], and their cancer status of human samples in Fig.2. The non-monotonicity was detected only by FunChisq, while approaches based on comparison of means, such as
t-test, would fail, because the means of non-monotonic patterns between cancer and non-cancer samples may not differ significantly. KAT6A has been implicated to either promote or inhibit senescence [24], important for tumor formation and growth [25]. KAT6A is associ-ated with oncogenesis [22] in both leukemia [26–29] and breast cancer [30], because of dysregulation of its his-tone acetyltransferase activity or its aberrant expression. KAT6A was also hypothesized to suppress tumor when severe DNA damage happened [24, 31]. Thus, KAT6A may both promote and suppress cancer, playing compet-ing roles dependcompet-ing on the cellular context. BRAF has long been established as a proto-oncogene [32]. However, BRAF paradoxically inhibits stem cell renewal [33]; also in BRAF-driven mouse model of colon cancer, tumor for-mation is suppressed [33]. Therefore, BRAF may either promote or inhibit cancer depending on the context. Both examples illustrate the capacity of FunChisq in recog-nizing non-monotonic patterns, which t-test and other statistical analysis methods based on the comparison of group means may not manage to differentiate.
FunChisq is empirically efficient in runtime
Fig. 1FunChisq outperformed six widely-used methods in detecting known cancer genes from FANTOM5 data. FunChisq test, Pearson’s
chi-squared test, Wilcoxon test,t-test and logistic regression used transformed expression data. DESeq2 and edgeR used raw read count data.aROC curves of each method.bPR curves of each method.cAUROC distributions after repeating the randomized evaluation 100 times.dAUPR distributions after repeating the randomized evaluation 100 times
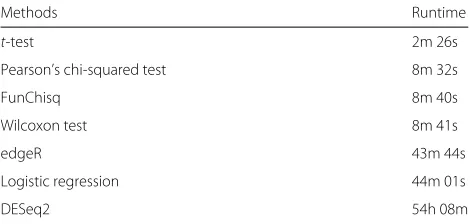
primary/tissue cells. The program ran on a single thread of a server with 12×2.40GHz Intel(R) Xeon(R) CPU E5645 and 192GB RAM under openSUSE Leap 15.0 OS. Fun-Chisq, Pearson’s chi-squared test, Wilcoxon test andt-test took the least time of less than 10 minutes. Logistic regres-sion and edgeR took much longer time fitting default models. DESeq2 costed most time due to raw read count normalization, dispersion estimation, and generalized lin-ear model fitting. In summary, the empirical runtime comparison suggests that FunChisq is practically efficient.
FunChisq reveals putative cancer driver noncoding rNAs The latest FANTOM5 annotation has identified most cod-ing genes in the human genome. Thus, we hypothesize that the majority of the 107,139 unannotated TSSs may belong to potential novel ncRNAs. To identify the direc-tional effect from TSS to cancer, we applied FunChisq on the expression of each TSS in cancer versus non-cancer
samples to report function indices andp-values. Figure3
shows the distribution of function index of representa-tive TSSs from the 719 known cancer genes, versus that of all other TSSs. The two distributions demonstrate that known cancer TSSs have a greater average function index than other TSSs, indicating that the cancer status has stronger dependency on known cancer TSSs than other TSSs.
Rather than picking a fixed function index cutoff, we selected the threshold at 90 percentile of known cancer TSS function index values (Fig.3). The criterion is strin-gent to select the most relevant candidates. At the 90 percentile function index cutoff of 0.40 and an adjusted
Fig. 2Non-monotonic directional interaction patterns from two known cancer genes to the cancer status of human samples. The horizontal axes are log-scaled abundance of the most expressed TSS of each gene from FANTOM5. The vertical axes of the two top plots represent tissue types. ‘Cancer’ indicates a sample is from a cancer cell-line, ‘Normal’ for a sample from a non-cancer tissue. The vertical axes of the two bottom plots are the probability density of gene expression level. FunChisq reported high statistical significance of both genes’ directional association with cancer suggested by the lowp-values, whilet-test returned insignificant results indicated by largep-values.ap1@KAT6A, the most transcribed TSS of known cancer geneKAT6A, is either up- or down-regulated in 527 non-cancer samples of various tissues, but has an intermediate level of expression in 225 samples of various cancers.bp1@BRAF, the most transcribed TSS of known cancer geneBRAF, has a similar non-monotonic expression profile directionally associated with cancer status
with a monotonic interaction pattern with cancer status and the other a non-monotonic pattern. All 1108 pre-dicted noncoding cancer TSSs are listed in Additional file1. We expect cancer biologists to find these ncRNA biomarkers interesting and to apply either RNA silencing or gene editing to study their functions in cancer.
Putative cancer-type specific biomarkers for lymphoid and myeloid leukemias
Both lymphoid and myeloid leukemia samples have the largest sample size among all cancer types sequenced by the FANTOM5 project. We contrast samples of a cancer type and all remaining samples which also include other cancer types, such that the markers identified are only specific to the cancer type of interest. This strategy is only possible with FANTOM5 data in that they cover all major tissue, cell, and cancer types in human.
Table 2Empirical runtime of seven methods in evaluating association of 209,911 transcription start sites with cancer
Methods Runtime
t-test 2m 26s
Pearson’s chi-squared test 8m 32s
FunChisq 8m 40s
Wilcoxon test 8m 41s
edgeR 43m 44s
Logistic regression 44m 01s
DESeq2 54h 08m
The methods are sorted in the increasing order of runtime
We first searched for potential biomarkers of lymphoid leukemia by testing the directional effect of each TSS on lymphoid leukemia status. Among all 752 samples from FANTOM5, there are 23 lymphoid leukemia and 48 related normal lymphoid samples. We divided the samples
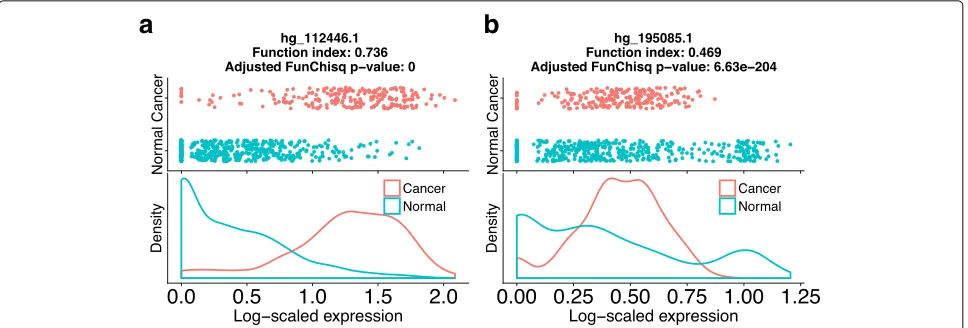
Fig. 4Two unannotated transcription start sites predicted as putative cancer driver ncRNAs. The horizontal axes are log-scaled TSS expression from FANTOM5. The vertical axes of the two top plots represent tissue types. ‘Cancer’ indicates a sample is from a cancer cell-line, ‘Normal’ for a sample from a non-cancer tissue. The vertical axes of the two bottom plots are the probability density of gene expression level.aPutative cancer ncRNA hg_112446.1has a monotonic pattern with cancer status.bPutative cancer ncRNAhg_195085.1exhibits a non-monotonic pattern with cancer status
into two groups: the first group contains 23 lymphoid leukemia samples and the second group has all other 729 samples (including the 48 normal lymphoid samples and all cancer types other than lymphoid leukemia). We then performed the FunChisq test on each TSS to hunt for ones on which lymphoid leukemia status functionally depend. By requiring ap-value under 0.05 and a function index greater than all 87 known lymphoid leukemia driver gene TSSs, we identified 332 putative lymphoid leukemia biomarkers.
Next we performed the same procedure to search for biomarkers for myeloid leukemia by contrasting the 28 myeloid leukemia samples with the remaining 724 sam-ples (including 26 normal myeloid samsam-ples and all cancer types other than myeloid leukemia). We detected 79 sta-tistically significant putative myeloid leukemia biomark-ers, with ap-value no more than 0.05 and function index greater than the TSSs of all 100 known myeloid leukemia driver genes.
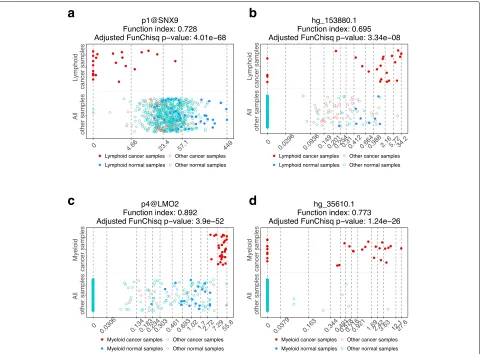
Figure 5 illustrates the expression patterns of four biomarker candidates that are distinct between the spe-cific leukemia and other samples. Only in lymphoid leukemia, p1@SNX9 is under-expressed but not in any other samples (Fig. 5a); hg_153880.1 is mostly highly expressed only in lymphoid leukemia (Fig.5b).p4@LMO2
is exclusively highly expressed in myeloid leukemia (Fig.5c);hg_35610.1also exhibited the highest expression in myeloid leukemia (Fig.5d).
Distributions of detected biomarkers along each chro-mosome for lymphoid and myeloid leukemias are shown in Fig. 6. In lymphoid leukemia samples, chromo-somes 12 contain the highest number of biomark-ers, while in myeloid leukemia samples, chromosome 6 and 19 has much more biomarkers than others. In
chronic lymphocytic leukemia (CLL), trisomy 12 has been reported to be the third most frequent chromosomal aberration and is often present as a unique cytogenetic alteration [34]. In acute myeloid leukemia (AML), tri-somy chromosome 6 has been reported as a sole cyto-genetic abnormality in AML-M5 [35], and chromosome 19 abnormalities are commonly seen in AML-M7 [36]. Our findings of the biomarker genomic locations are con-sistent with these known chromosomal abnormalities in subtypes of leukemia, which supports potential cancer-related functions of the putative biomarkers detected.
The predicted biomarkers of both lymphoid and myeloid leukemias are reported in Additional file2 (see sectionAdditional files).
Discussion
FunChisq measures the functional strength from row vari-able X to column variable Y in a contingency table via a model-free approach. Given the column sums, a con-tingency table maximizes the FunChisq statistic if and only if column variableY is a non-constant mathemati-cal function of row variableX. This theoretical optimality makes FunChisq model-free in promoting all forms of functional patterns regardless of parametric family, lin-earity, or monotonicity. This flexibility unconstrained by functional forms offers one a greater capacity in inferring causality with reduced biases than other methods.
Fig. 5Gene expression patterns of four potential leukemia biomarkers are nearly exclusively cancer-type specific. The horizontal axes are TSS levels of gene expression from FANTOM5. The vertical axes are sample types.aPutative lymphoid leukemia biomarkerSNX9.bPutative lymphoid leukemia biomarkerhg_153880.1.cPutative myeloid leukemia biomarkerLMO2.dPutative myeloid leukemia biomarkerhg_35610.1
Conclusions
We have shown that the FunChisq statistical method is powerful in detecting directional association, sensitive to both monotonic and non-monotonic patterns. Strong functional patterns provide evidence for causality. Apply-ing the method on the FANTOM5 data coverApply-ing the largest number of potential noncoding genes for many cancer types, we revealed putative cancer driver ncRNAs with a directional effect on cancer status stronger than 90% of all 719 curated cancer genes. Furthermore, we predicted 332 potential cancer biomarkers for lymphoid leukemia and 79 for myeloid leukemia, stronger than all known lymphoid or myeloid leukemia genes. Our study thus contributes a catalog of novel biomarker candidates that may signify a deeper understanding of cancer biology.
Methods
We used the normalized functional chi-squared test with an asymptotic normal null distribution to discover direc-tional association in contingency tables [8,11]. The test
detects model-free functional dependency and does not need a prescribed functional form. The directional func-tional dependency can potentially indicate the causal direction of an interaction based on the causality-by-functionality principle [37].
An observedr×ccontingency tableOhasrrows rep-resenting the discrete levels for independent variable and
ccolumns representing the discrete levels for dependent variable. LetOij denote the sample counts at row i and columnj. LetOi·be the row sum of rowiandO·jbe the column sum of columnj, defined as
Oi·= c
j=1
Oij and O·j= r
i=1
Oij (1)
Letnrepresent the sample size of tableO. The FunChisq statistic of observed tableOis defined by
χ2 f(O)=
r
i=1 c
j=1
(Oij−Oi·/c)2
Oi·/c
−
c
j=1
Fig. 6Chromosomal locations of putative leukemia biomarkers. Chromosomal counts of putative biomarkers for (a) lymphoid and (b) myeloid leukemia. Genomic maps of putative biomarkers for (c) lymphoid and (d) myeloid leukemia
which asymptotically follows a chi-squared distribution withν=(r−1)(c−1)degrees of freedom, under the null hypothesis of the row and column variables being statis-tically independent and an assumption of the dependent variable being uniformly distributed. We further define the normalized FunChisq by mean-shifting and standard-deviation-scalingχf2(O)to
χ2 f(O)−ν
√
2ν (Normalized FunChisq) (3)
which asymptotically follows a standard normal distribu-tion when the degrees of freedom ν is high [38] under the null hypothesis. Our empirical evaluation in Fig. 1
suggests that the normalized FunChisq is effective at detecting functional dependency even ifνis small.
We also introduce the function indexξf to measure the effect size of FunChisq test:
ξf =
χ2 f(O)
n(c−1)− c j=1
(O·j−n/c)2 n/c
The index assesses the strength of functional dependency of column variableYon row variableX. It ranges from 0 to 1, with greater values representing stronger non-constant functionality. The index should be used in conjunction with the p-value of the test statistic to ensure both a sufficient effect and an acceptable statistical significance.
Additional files
Additional file 1:FunChisq predicted 1108 putative cancer driver ncRNAs with stronger directional effect to cancer than 90% of 719 known cancer driver genes. (XLSX 70 kb)
Additional file 2:FunChisq predicted 332 potential cancer biomarkers for lymphoid leukemia and 79 for myeloid leukemia, which were stronger than 87 known lymphoid leukemia and 100 known myeloid leukemia driver genes. (XLSX 25 kb)
Abbreviations
AML: Acute myeloid leukemia; CLL: Chronic lymphocytic leukemia; DREAM: Dialogue for reverse engineering assessments and methods; FANTOM5: Functional annotation of mammalian genome 5; FunChisq: Functional chi-squared test; HPN: Heritage provider network; ncRNA: Noncoding RNA; PR: Precision recall; ROC: Receiver operating characteristic; TCGA: The cancer genome atlas; TPM: Tags per million; TSS: Transcription start site
Acknowledgements Not applicable.
About this supplement
This article has been published as part ofBMC Medical Genomics, Volume 12 Supplement 7, 2019: Selected articles from the 14th International Symposium on Bioinformatics Research and Applications (ISBRA-18): medical genomics. The full contents of the supplement are available athttps://bmcmedgenomics. biomedcentral.com/articles/supplements/volume-12-supplement-7
Authors’ contributions
HZ designed the study, wrote software, and performed data analysis. HZ and MS wrote the manuscript. All authors have read and approved the final manuscript.
Funding
The reported work is supported by US National Science Foundation grant 1661331, USDA grant 2016-51181-25408, and in part by Partnership for the Advancement of Cancer Research NCI grants U54 CA132383 (NMSU) and U54 CA132381 (Fred Hutch). The content is solely the responsibility of the authors and does not necessarily represent the official views of the funding agencies.
Availability of data and materials SeeAdditional files.
Ethics approval and consent to participate Not applicable.
Consent for publication Not applicable.
Competing interests
The authors declare that they have no competing interests.
Received: 18 July 2019 Accepted: 29 July 2019 Published: 30 December 2019
References
1. Gibb EA, Brown CJ, Lam WL. The functional role of long non-coding RNA in human carcinomas. Mol Cancer. 2011;10:38.https://doi.org/10.1186/ 1476-4598-10-38.
2. Huang T, Alvarez A, Hu B, Cheng S-Y. Noncoding RNAs in cancer and cancer stem cells. Chin J Cancer. 2013;32(11):582–93.https://doi.org/10. 5732/cjc.013.10170.
3. Kita Y, Yonemori K, Osako Y, Baba K, Mori S, Maemura K, Natsugoe S. Noncoding RNA and colorectal cancer: its epigenetic role. J Hum Genet. 2017;62(1):41–7.https://doi.org/10.1038/jhg.2016.66.
4. Tomczak K, Czerwi ´nska P, Wiznerowicz M. The Cancer Genome Atlas (TCGA): an immeasurable source of knowledge. Contemp Oncol. 2015;19(1A):68–77.https://doi.org/10.5114/wo.2014.47136. 5. Lizio M, Harshbarger J, Shimoji H, Severin J, Kasukawa T, Sahin S,
Abugessaisa I, Fukuda S, Hori F, Ishikawa-Kato S, Mungall CJ, Arner E, Baillie JK, Bertin N, Bono H, de Hoon M, Diehl AD, Dimont E, Freeman TC, Fujieda K, Hide W, Kaliyaperumal R, Katayama T, Lassmann T, Meehan TF, Nishikata K, Ono H, Rehli M, Sandelin A, Schultes EA, ’t Hoen PAC, Tatum Z, Thompson M, Toyoda T, Wright DW, Daub CO, Itoh M, Carninci P, Hayashizaki Y, Forrest ARR, Kawaji H. Gateways to the fantom5 promoter level mammalian expression atlas. Genome Biol. 2015;16:22.https://doi.org/10.1186/s13059-014-0560-6.
6. Zhao X-M, Liu K-Q, Zhu G, He F, Duval B, Richer J-M, Huang D-S, Jiang C-J, Hao J-K, Chen L. Identifying cancer-related microRNAs based on gene expression data. Bioinformatics. 2015;31(8):1226–34.https://doi.org/ 10.1093/bioinformatics/btu811.
7. Lee J-H, Zhao X-M, Yoon I, Lee JY, Kwon NH, Wang Y-Y, Lee K-M, Lee M-J, Kim J, Moon H-G, In Y, Hao J-K, Park K-M, Noh D-Y, Han W, Kim S. Integrative analysis of mutational and transcriptional profiles reveals driver mutations of metastatic breast cancers. Cell Discov. 2016;2:16025.
https://doi.org/10.1038/celldisc.2016.25.
8. Zhang Y, Song M. Deciphering interactions in causal networks without parametric assumptions. arXiv Mol Netw. 20131311–2707.1311.2707. 9. Zhong H, Song M. A fast exact functional test for directional association
and cancer biology applications. IEEE/ACM Trans Comput Biol Bioinforma. 2019;16(3):818–26.https://doi.org/10.1109/TCBB.2018.2809743. 10. Zhang Y, Zhong H, Sharma R, Kumar S, Song J. FunChisq: Chi-Square
and Exact Tests for Model-Free Functional Dependency. 2018. R package version 2.4.5-3.https://CRAN.R-project.org/package=FunChisq. Accessed 6 Dec 2018.
11. Hill SM, Heiser LM, Cokelaer T, Unger M, Nesser NK, Carlin DE, Zhang Y, Sokolov A, Paull EO, Wong CK, Graim K, Bivol A, Wang H, Zhu F, Afsari B, Danilova LV, Favorov AV, Lee WS, Taylor D, Hu CW, Long BL, Noren DP, Bisberg AJ, The HPN-DREAM Consortium, Mills GB, Gray JW, Kellen M, Norman T, Friend S, Qutub AA, Fertig EJ, Guan Y, Song M, Stuart JM, Spellman PT, Koeppl H, Stolovitzky G, Saez-Rodriguez J, Mukherjee S. Inferring causal molecular networks: empirical assessment through a community-based effort. Nat Methods. 2016;13(4):310–8.https://doi.org/ 10.1038/nmeth.3773.
12. Pearson K. On the criterion that a given system of deviations from the probable in the case of a correlated system of variables is such that it can be reasonably supposed to have arisen from random sampling. Philos Mag Ser 5. 1900;50(302):157–75.
13. Wilcoxon F. Individual comparisons by ranking methods. Biom Bull. 1945;1(6):80–3.
14. Rice J. Mathematical Statistics and Data Analysis, 3rd edn. Belmont: Thomas Higher Education; 2006.
15. Hosmer Jr DW, Lemeshow S, Sturdivant RX. Applied Logistic Regression vol. 398, 3rd edn. Hoboken: John Wiley & Sons; 2013.
16. Love MI, Huber W, Anders S. Moderated estimation of fold change and dispersion for RNA-seq data with DESeq2. Genome Biol. 2014;15(12):550. 17. Robinson MD, McCarthy DJ, Smyth GK. edgeR: A Bioconductor package
for differential expression analysis of digital gene expression data. Bioinformatics. 2010;26(1):139–40.
18. Futreal PA, Coin L, Marshall M, Down T, Hubbard T, Wooster R, Rahman N, Stratton MR. A census of human cancer genes. Nat Rev Cancer. 2004;4(3):177–83.
19. Wang H, Song M. Ckmeans.1d.dp: Optimalk-means clustering in one dimension by dynamic programming. R J. 2011;3(2):29–33.https://doi. org/10.32614/RJ-2011-015.
20. Song J, Wang H. Ckmeans.1d.dp: Optimal and Fast Univariate Clustering. 2018. R package version 4.2.2.https://cran.r-project.org/package= Ckmeans.1d.dp. Accessed 1 Dec 2018.
22. Lv D, Jia F, Hou Y, Sang Y, Alvarez AA, Zhang W, Gao W-Q, Hu B, Cheng S-Y, Ge J, Li Y, Feng H. Histone acetyltransferase KAT6A upregulates PI3K/Akt signaling through TRIM24 binding. Cancer Res. 2017;77(22):6190–201.https://doi.org/10.1158/0008-5472.CAN-17-1388. 23. Sclafani F, Gullo G, Sheahan K, Crown J. Braf mutations in melanoma and
colorectal cancer: a single oncogenic mutation with different tumour phenotypes and clinical implications. Crit Rev Oncol Hematol. 2013;87(1): 55–68.
24. Sheikh BN, Phipson B, El-Saafin F, Vanyai HK, Downer NL, Bird MJ, Kueh AJ, May RE, Smyth GK, Voss AK, Thomas T. MOZ (MYST3, KAT6A) inhibits senescence via the INK4A-ARF pathway. Oncogene. 2015;34(47):5807–20.
https://doi.org/10.1038/onc.2015.33.
25. O’Brien W, Stenman G, Sager R. Suppression of tumor growth by senescence in virally transformed human fibroblasts. Proc Natl Acad Sci U S A. 1986;83(22):8659–63.
26. Deguchi K, Ayton PM, Carapeti M, Kutok JL, Snyder CS, Williams IR, Cross NC, Glass CK, Cleary ML, Gilliland DG. MOZ-TIF2-induced acute myeloid leukemia requires the MOZ nucleosome binding motif and TIF2-mediated recruitment of CBP. Cancer Cell. 2003;3(3):259–71. 27. Aikawa Y, Katsumoto T, Zhang P, Shima H, Shino M, Terui K, Ito E,
Ohno H, Stanley ER, Singh H, Tenen DG, Kitabayashi I. PU,1-mediated upregulation of CSF1R is crucial for leukemia stem cell potential induced by MOZ-TIF2. Nat Med. 2010;16(5):580–5.https://doi.org/10.1038/nm. 2122.
28. Aguiar RC, Chase A, Coulthard S, Macdonald DH, Carapeti M, Reiter A, Sohal J, Lennard A, Goldman JM, Cross NC. Abnormalities of chromosome band 8p11 in leukemia: two clinical syndromes can be distinguished on the basis of moz involvement. Blood. 1997;90(8):3130–5. 29. Borrow J, Stanton VPJ, Andresen JM, Becher R, Behm FG, Chaganti RS,
Civin CI, Disteche C, Dube I, Frischauf AM, Horsman D, Mitelman F, Volinia S, Watmore AE, Housman DE. The translocation t(8;16)(p11;p13) of acute myeloid leukaemia fuses a putative acetyltransferase to the CREB-binding protein. Nat Genet. 1996;14(1):33–41.https://doi.org/10. 1038/ng0996-33.
30. Yu L, Liang Y, Cao X, Wang X, Gao H, Lin S-Y, Schiff R, Wang X-S, Li K. Identification of MYST3 as a novel epigenetic activator of ERαfrequently amplified in breast cancer. Oncogene. 2017;36(20):2910.
31. Waks Z, Weissbrod O, Carmeli B, Norel R, Utro F, Goldschmidt Y. Driver gene classification reveals a substantial overrepresentation of tumor suppressors among very large chromatin-regulating proteins. Sci Rep. 2016;6:38988.
32. Eychène A, Vianney-Barnier J, Apiou F, Dutrillaux B, Calothy G. Chromosomal assignment of two human B-raf (Rmil) proto-oncogene loci: B-raf-1 encoding the p94Braf/Rmiland B-raf-2, a processed pseudogene. Oncogene. 1992;7:1657–60.
33. Tong K, Pellon-Cardenas O, Sirihorachai VR, Warder BN, Kothari OA, Perekatt AO, Fokas EE, Fullem RL, Zhou A, Thackray JK, Tran H, Zhang L, Xing J, Verzi MP. Degree of tissue differentiation dictates susceptibility to BRAF-driven colorectal cancer. Cell Rep. 2017;21(13):3833–45.https://doi. org/10.1016/j.celrep.2017.11.104.
34. Puiggros A, Blanco G, Espinet B. Genetic abnormalities in chronic lymphocytic leukemia: where we are and where we go. BioMed Res Int. 2014;2014:435983.
35. Gupta M, Radhakrishnan N, Mahapatra M, Saxena R. Trisomy chromosome 6 as a sole cytogenetic abnormality in acute myeloid leukemia. Turk J Haematol. 2015;32(1):77–9.https://doi.org/10.4274/tjh. 2013.0119.
36. Nimer SD, MacGrogan D, Jhanwar S, Alvarez S. Chromosome 19 abnormalities are commonly seen in AML, M7. Blood. 2002;100(10):3838. 37. Simon HA, Rescher N. Cause and counterfactual. Philos Sci. 1966;33(4):
323–40.
38. Box GE, Hunter JS, Hunter WG. Statistics for Experimenters: Design, Innovation, and Discovery 2nd edn. New York: Wiley-Interscience; 2005.
Publisher’s Note