Ann. Geophysicae 14, 1095—1101 (1996) (EGS — Springer-Verlag 1996
Studies of an artificially generated electrode effect at ground level
E. A. Mareev1,*, S. Israelsson2, E. Knudsen2, A. V. Kalinin3, M. M. Novozhenov3 1LPCE/CNRS, 3A Av. de la Rech. Scientifique, 45071 Orleans Cedex 02, France
2Department of Meteorology, Uppsala University, Uppsala, Sweden
3Department of Mathematics and Mechanics, Nizhny Novgorod State University, Russia Received: 9 June 1995/Revised: 9 April 1996/Accepted: 19 April 1996
Abstract. The outdoor experiments, using a metallic grid above the ground surface, have yielded well-defined verti-cal profiles of the space-charge density. The profiles showed strong evidence for the existence of an electrode effect, which could be named the artificial electrode effect and can serve as a very useful and well-controlled model for the study of atmospheric electric processes in the atmospheric surface layer. The build-up or break-down of an electrode-effect layer occurred in a time of the order of 10 s under the experimental conditions realized. The artifi-cially generated electrode effect is dependent on the elec-trical field strength supplied, wind speed, turbulent mixing and ion mobilities. Wind speed and ion mobility seem to be the dominant factors, defining space-charge density profiles. A theoretical model for the artificial electrode effect has been developed, taking into account turbulent mixing of charged particles in the air flow with the loga-rithmic profile of the wind velocity. The numerical analysis of the boundary value problem for the two-di-mensional equations for the light ion concentrations has been performed. The model presented shows a qualitative agreement of calculated space-charge profiles with meas-ured ones, and explains the dependence of the artificial electrode effect on the dominant control parameters. The limiting conditions for the developed theory are discussed.
1 Introduction
The electrical processes in the planetary boundary layer are complex and vary within a large range of space and time scales (see, for details, an overview by Hoppelet al., 1986). One of the most important phenomena, which characterizes the dynamics of fair-weather atmospheric electricity and serves as a source of space charge at the
* Permanent address: Institute of Appl. Physics, 46 Ulyanov St., 603600 Nizhny Novgorod, Russia
Correspondence to: E. A. Mareev
ground level, is the electrode effect (e.g. Israel, 1971): the imbalance between positive and negative atmospheric ions, related to the atmospheric electric field in the surface layer. The mathematical description of the electrode effect under convection and turbulent mixing is given by a num-ber of authors (Chalmers, 1967; Hoppel, 1967; Willett, 1978, 1979, 1983; Tuomi, 1982). However, the results of numerous experiments are confusing. Chalmers (1967) re-ported that ‘‘the simple electrode effect does not occur’’. Mu¨hleisen (1961) reported a well-pronounced effect over water, but none over land. Bent and Hutchinson (1966) concluded that ‘‘the electrode effect made itself felt in a number of different ways’’. Crozier (1963) found ‘‘a strong manifestation of the electrode effect’’ during night-time periods with a very low wind velocity.
These disparities can be explained, in part, by the different measuring methods and the varying local meteorological conditions during measuring. Varying surface radioactivity (trapped radon and thoron) and aerosol concentration also give differing results. Another complication is the large signal fluctuations during the measurement periods, observed by several researchers (Israel, 1973).
under conditions controlled as precisely as possible to single out the most critical parameters, and to compare the results with a theory adequate for the conditions considered.
It is the intention of this paper to present an experi-mental investigation of the electrode effect in the atmo-spheric surface layer under controlled electric-field and wind conditions, and to discuss the influence of these factors on the magnitude of this effect, which could be called the artificial electrode effect. A two-dimensional theoretical model for this phenomenon is developed and compared with experimental data.
2 Measurement site and experimental set-up
The measurements were made at the Marsta Observatory (59°55@N, 17°35@E), Sweden. The observatory is located in a very flat farming area 10 km north of Uppsala. The nearest forest is more than 1 km away from the observ-atory, which yields undisturbed micrometeorological conditions. No industrial establishments produced con-densation nuclei in the surroundings of the observation place and no burning took place during the observations. A map of the Marsta Observatory has been presented by Israelssonet al. (1973).
The micrometeorological parameters (wind, temper-ature and relative humidity) were continuously recorded with standard instruments.
The atmospheric electric potential gradient was mea-sured by a radioactive-collector method at a height of 1 m, and the electric polar conductivities (j` and j~) at a height of 0.5 m using two aspiration condensers accord-ing to the Kasemir-Dolezalek system (Israel, 1971, 1973). The questions concerning polar-conductivity measure-ments have been considered in the special paper by Israel-ssonet al. (1994) and are not discussed here.
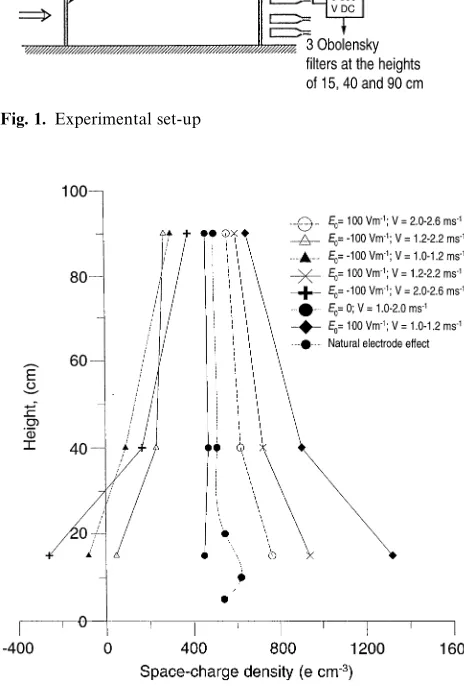
The aerosol-particle concentration was measured using a Gardner condensation nuclei counter 0.5 m above the ground surface. In the investigation a metal grid (10]4 m2) with mesh dimension 8]8 cm2 was used, placed on insulating poles 1.5 m high, as shown in Fig. 1. The grid was situated on an open flat field well apart from obstacles disturbing the wind. The ground was covered with short cut grass both under and in front of the grid. A voltage could be applied to control the field be-tween the grid and ground; in this investigation the values 0, 100 and 200 V m~1 were used. With three identical Obolensky filters, at heights of 0.15, 0.40 and 0.90 m at the lee side of the grid, the space-charge density profile was measured. With some minor modifications the filters are a copy of the construction given by Anderson (1966). The instruments have been used in other investigations with good results. To ventilate the filters, three standard vac-uum cleaners were used. The output currents from the Obolensky filters were measured in electrometer ampli-fiers operating as current to voltage converters. The time constant was adjusted to 3 s. By using the Obolensky filters the total space-charge density was measured.
[image:2.561.302.534.121.464.2]Simultaneous recordings of the three instruments were logged during 3-min periods, a total of 400 values, and
Fig. 1. Experimental set-up
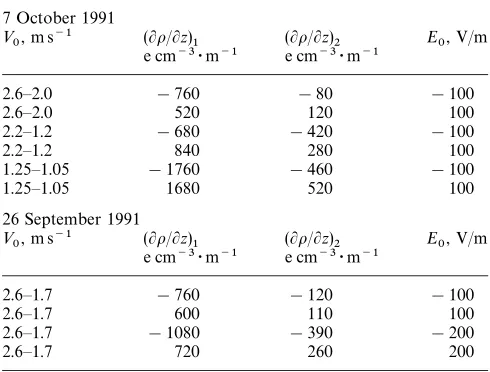
Fig. 2. Space-charge density profiles during different wind speeds and electric fields. Thedotted curverepresents measurements with-out the grid
means were calculated. Due to the small differences be-tween the individual gradient values of the space-charge density, very high sensitivity was required.
Even if the instruments were equally constructed, the sensitivity could not be expected to be the same. This was controlled in the following way; the three instruments were placed next to each other at the same height and 400 values were recorded for 3 min; the sensitivity of the in-struments was closely checked to be equal; offset controls and the calibration-adjustment routines were run fre-quently during the recording periods.
It should be desirable to measure the space-charge profile in front of the grid as well. The measurement at the lee side of the grid was however very time consuming. Considering the very small differences in space-charge densities (100—400 e cm~3, where e is the elementary charge) for the different levels, the stability of the instru-ments had to be frequently checked with respect to ther-mal drift and sensitivity. Besides, several profiles had to be recorded during the same meteorological conditions, es-pecially the same wind direction.
Fig. 3. Mean space-charge density profiles. Thedotted curve repres-ents measuremrepres-ents without the grid
stability and wind conditions. The method of measuring was described by Knudsenet al. (1989). One kind of the measured space-charge profiles fitted well with the me-teorological conditions (temperature, pressure, wind speed) of the present investigation, and this profile shows a well-developed electrode effect. This motivates the as-sumption that in the present study an electrode effect was present in front of the grid. For comparison this profile has been included in the Figs. 2 and 3.
3 Recordings and experimental results
As the recordings were very time-consuming, reliable measurement required:
— stable meteorological conditions for several hours;
— steady wind direction;
— frequent calibration and offset adjustments;
— preferably several runs to calculate the mean values. All recordings were carried out during 2 days under fair weather conditions with no clouds, dry ground surface, visibility'50 km, low to moderate wind speed and
tem-peratures 12—15°C. On both days the atmospheric electric field was about 80 V m~1 with a fluctuation of
$10 V m~1. Meteorological conditions corresponded to
the near-neutral atmospheric stability; the aerosol-particle concentration during measurements was fairly constant about 2000 cm~3.
After recordings of four profiles, relating to electric-field values of opposite signs (1600 values on each level), on 7 October 1991, the wind speed decreased and two additional profiles were recorded under conditions other-wise the same. The observations lasted 2 h: from 13 to 15 LT (from 12 to 14 UT, respectively). The space-charge density profiles are shown in Fig. 2.
On 26 September 1991 (Fig. 3), the wind speed was the same as for profile 1 shown in Fig. 2, but a field twice as high was applied to the grid. Altogether six space-charge profiles were recorded, and the mean profiles are shown in Fig. 3. The complete period of observations was 5 h, from 10 to 15 LT.
The vertical profiles in Figs. 2 and 3 show a well-defined decrease in the space-charge density with increas-ing height for different values of applied electric field.
The space-charge density for zero voltage at the grid differs only slightly from one profile to another. The differences were so small that for better clarity they were adjusted to the same value in the diagrams.
We consider that for zero voltage at the grid, no ion separation takes place in the air passing under the grid. The combination and recombination of ions is very lim-ited during the passage and the profile recorded is equiva-lent to that entering the grid. The diagrams show that the vertical gradient is close to zero. This means that the presumed electrode effect at the inlet of the grid is smoothed out by the turbulence under the metallic grid. Small deviations are within the accuracy of measure-ments.
It is obvious that the gradients shown in the diagrams are generated during the time of air-passage under the grid. The times required to generate the space-charge profiles in Fig. 2 are roughly 7, 10 and 15 s. The values are estimated assuming a logarithmic wind profile below the grid and then using a mean wind speed. A time of 7 s is apparently enough to smooth out a presumed electrode effect at the front of the grid.
Recordings with an Obolensky filter include the total space-charge density regardless of the mobility of the ions. Space charges consist of two components (see e.g. Knud-sen and Israelsson, 1994): small ions of high mobility and large ions of low mobility. The transport mechanisms of the two types differ basically; small ions are transported by the influence of the atmospheric electric field and by air movements, whereas large ions are transported mainly by air movements. In all the diagrams the space-charge den-sity will include both components, but only the small ions will contribute to the space-charge gradients. The large ions are assumed to be constant with height due to a low electric mobility, and therefore not dependent on the electric-field strength.
In Figs. 2 and 3, the space-charge profiles for zero field are in the positive range, which is explained by the occur-rence of a surplus of positive ions in the lowest layer of the atmosphere due to the natural electrode effect .
The ion separation due to the external electric field supplied results in a vertical component of the gradient of the space-charge density, i.e.
A
Lo LzB
1
"[o(0.4 m)
!o(0.15 m)]
0.25 m ;
A
Lo LzB
2
"[o(0.9 m)
!o(0.4 m)]
0.5 m .
Table 1. The influence of the wind speed and external electric field on space-charge density gradients
7 October 1991
»
0, m s~1 (e cmLo/L~3z)1·m~1 e cm(Lo/L~3z)2·m~1 E0, V/m
2.6—2.0 !760 !80 !100
2.6—2.0 520 120 100
2.2—1.2 !680 !420 !100
2.2—1.2 840 280 100
1.25—1.05 !1760 !460 !100
1.25—1.05 1680 520 100
26 September 1991
»
0, m s~1 (e cmLo/L~3z)1·m~1 e cm(Lo/L~3z)2·m~1 E0, V/m
2.6—1.7 !760 !120 !100
2.6—1.7 600 110 100
2.6—1.7 !1080 !390 !200
2.6—1.7 720 260 200
be determined; respective results are presented in Table 1. It is seen that by increasing the field from 100 to 200 V m~1, the gradient increases with a factor changing from 1.5 to 2.5. By increasing the wind speed by factor 2, the gradients decrease by a factor changing from 2.5 to 3.5. The ratios were about the same for both polarities.
4 Theoretical model
Our goal is to develop a theory which could explain the artificially generated electrode effect. This problem has to be considered in at least a two-dimensional approxima-tion, taking into account the limited volume and the wind passing through. One-dimensional theories of the elec-trode effect have been developed by many investigators (see Hoppel, 1967; Willett, 1978, 1979; Tuomi, 1982).
We will assume that in the absence of an electric field supplied between the grid and the ground, the space charge under the grid is distributed uniformly. We also suppose that the proper (self-consistent) electric fieldEof the volume space charge o(z) is small compared to the external fieldE+100 V m~1, so that the distribution of
space-charge density is mainly influenced by the external field, and non-linear effects can be neglected. A simple estimation shows that this assumption is correct. Indeed, from the Poisson equation we haveE+o¸/e
0, where¸is
the vertical scale of space-charge distribution, e
0 is the
permittivity of free space. For ¸&1.5 m and r&400 e cm~3, we find E&10 V m~1@E
0. Therefore,
we write for ion velocities:
V
1,2"V 0$k
1,2E0!D 1,2+ n 1,2 n 1,2 , (1) whereV
1,2are the velocities of positive and negative ions; k1andk2are their mobilities;D1andD2are the diffusion coefficients;n
1andn2are the positive and negative
small-ion densities;V
0is the wind velocity. We will suppose that
the wind velocity has a horizontal component only, while an electric field is vertical:V
0"»
0x0#º
0y0;E0"E 0z0,
wherex0,y0,z0are the unit vectors in the Cartesian coor-dinate system. Assuming thatx0is directed along the great side of the grid, we will consider a caseº
0"0.
If large ions are neglected (or embedded into the effec-tive ionization rateq), the balance equations for small ions are:
Ln 1
Lt#div(n1V1)"q!an1n2, (2) Ln
2
Lt#div(n2V2)"q!an1n2, (3)
whereais the coefficient of small-ion recombination. Under near-neutral stability conditions in the surface layer, the wind velocity increases with the height by the logarithmic law:
» 0"u*
i ln
A
zz0
B
, (4)where i"0.4 is the von Karman constant, u
* is the
friction velocity and z
0 is the surface-roughness
para-meter. Turbulent transport of small ions can be described in the frame of a gradient diffusion model. This model implies the solution of the balance equations, Eqs. (2), (3) for the mean values of ion densities, while the turbulent diffusion coefficient is defined in the usual manner (see e.g. Hoppel and Gathman, 1971):
D(z)"Sn@1 »@
zT
LSn1T/Lz" Sn@
2»@
zT
LSn2T/Lz, (5)
where angle brackets indicate the average value and
n@
12and»@
zare the fluctuating components of ion densities
and air velocity, respectively. In the surface atmospheric layer the turbulent diffusion coefficient is generally as-sumed to be nearly linear with height: D(z)"Cz#D
0,
where C&0.1 m s~1 is the constant and D 0&
5·10~6m2s~1is the coefficient of molecular diffusion. On average there is an equilibrium between the ioniza-tion rate and ion losses due to recombinaioniza-tion, so that the right-hand sides of Eqs. (2) and (3) equal zero. As a follow-ing approximation one can introduce a source with the effective ionization rateq
%&&(z), depending on the height.
We shall find the stationary solution of Eqs. (2) and (3). Assuming the rate of the small-ion densities’ change with the height is great as compared to the rate change along the x-axis, so that the inequality DL2n1,2/Lz2DA DL2n
1,2/Lx2D is satisfied, the equation for the positive-ion
density can be written in the following form:
» 0(z)L
n 1
Lx#k1E0 Ln
1 Lz!
L Lz
C
D(z)Ln 1
Lz
D
"0. (6)In this equation and henceforth, we write n 12"Sn
12T,
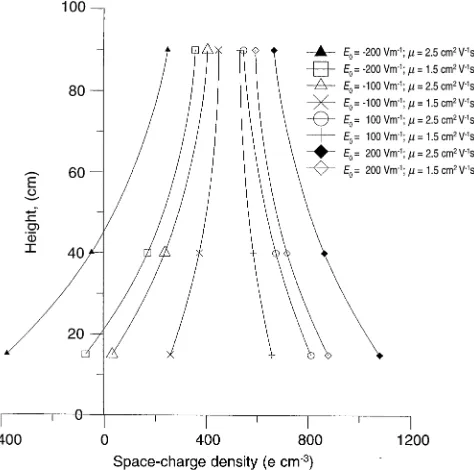
Fig. 4. Theoretical profiles of space-charge density (E —electric field strength,k—the small-ion mobility)
n(z) distribution being set at the given pointx"x*
propa-gates along the family of characteristics, defined by the ordinary differential equation:
dx" »
0(z) kE
0
dz" u* ikE
0
ln
A
zz 0
B
dz. (7)
Assuming that the external electric field, supplied by the voltage between the grid and the ground, is uniform and does not depend on the height under the grid, it is easy to integrate this equation:
x"u*z ikE0
C
lnA
z
z0
B
!1D
#x*. (8)Expressingz through x and a constantx*, we have the trajectory of a positive small ion, coming into the field (at
x"0) at the given height z'z
0 (z(1.5 m) and
ap-proaching the grid (according to the field directed alongz, i.e. the voltage at the grid is negative in the case con-sidered). The critical trajectory, coming atz"z
0, limits
space near the ground, where positive ions are absent due to the electric field. In reality the ion-density profile is smoothed out by diffusion, which in the presence of turbu-lence is very strong and defines a profile form. Its influence can be taken into consideration numerically.
Equation (6) has been investigated numerically by the finite-elements method. A boundary condition has been set in the following way: a uniform distribution
n
1"const."n
10was set atx"0; distributionsn
1(z) were
calculated under conditions dn1/dz"n
1/iz0B~1N at the
lower boundary z"z
0(the discussion of this boundary
condition is presented in the Appendix) andn 1"n
10 at
the upper boundary, placed atz"z
1"const. We took an
upper boundary atz
1"5 m to avoid an accumulation of
perturbations under the boundary in the numerical
pro-cedure. The density distribution of opposite-sign ions (negative for electric field, directed along the z-axis) was assumed, for simplification, to be constant: n
2" n
20(n
10. The valuesn20andn10were chosen in
accord-ance with averaged values of small-ion number densities, measured at the output of the system. As a result, the space-charge density profiles o
~(z)"e[n 1(z)!n
20] at x"10 m for different values of wind velocity, ion
mobil-ity, electric-field strength and other parameters of the problem have been found. For the opposite-directed fields applied, an equation for negative-ion density was solved in the same way, while the value ofn
1"n
10was assumed
to be constant. The space-charge density profile
o`(z)"e[n 10!n
2(z)] for the opposite sign of the
ex-ternal electric field has been found as a result. Theoretical profiles of space-charge density for both positive and negative signs of the external field, and two absolute values of the latter are presented in Fig. 4. The wind speed is 1 m s~1at the height of 0.75 m;n
1andn2are 1500 and
1000 cm~3, respectively. The small-ion mobilities are 1.5 and 2.5 cm2V~1s~1.
5 Discussion
A comparison of the experimental and theoretical curves for different values of set parameters allows us to advance the following assertions:
— The theory proposed gives the principal explanation of an artificial electrode effect and its dependence on the dominant parameters of the problem; mainly, on the wind speed, small-ion mobility and the turbulent diffusion.
— The greatest effect observed near the Earth’s surface is connected to the logarithmic fall of wind velocity to-wards the surface. Absolute values of the effect measured correspond (in the framework of the theory developed) to small-ion mobilities of the order 2—2.5 cm2V~1s~1, which are rather higher than usually measured small-ion values of the order 1.5—2 cm2V~1s~1.
— The perceptible difference between theoretical and experimental curves occurs for sufficiently great heights above the ground of order of 1 m. This discrepancy could be connected with inadequate boundary conditions used in the calculations. Besides, the redistribution of positive ions within the field of positive net-ground voltage can lead to an additional accumulation of positive ions under the grid, which has been not taken into account. These questions are in the field of general difficulties of elec-trode-effect theory, and they are worthy of a separate detailed investigation.
— A vertical change of the ionization rate near the ground, which takes place especially in summer with more pronounced exhalation of radon and thoron, represents the other important factor which can be taken into ac-count in computing and lead to an increasing effect near the ground. It is possible that the latter could reduce the ion mobility values necessary for the explanation of abso-lute values of the effect observed.
equation for the relaxation time of the atmosphere given by Israel (1971), which is valid in pure laminar motion, the actual value ofqwill in the present case be 730 s for a total conductivity of 50 fS m~1. This value is hundred times greater than the measured one. The observed time re-quired for annihilation of the natural electrode effect and for the setting up of its artificial counterpart is much shorter than either the electrical relaxation time or pre-sumably the small-ion lifetime in the medium of about 2000 aerosol particles per cm3. Therefore, the dominant physical processes in the experiment are turbulent diffu-sion and drift in the applied field of ambient small ions that have been advectived beneath the screen from up-stream.
6 Conclusion
The experiments with a metallic grid above the ground surface yielded very well defined vertical profiles of the space-charge density. The profiles showed strong evidence for the existence of an electrode effect in the atmospheric surface layer. The build up or break-down of an artificial electrode effect layer occurred in the time of order 10 s under the experimental conditions realized.
The artificially generated electrode effect is dependent on the electrical field strength, wind speed, turbulence and ion mobilities. Comparison between data from a the-ory adapted to the experimental set-up and the experi-mental data shows a good agreement. Wind speed seems to be somewhat more dominant than the other factors in the building up of the electrode layer. This can be ex-plained in the following way. When the field is increasing, all other parameters which contribute to the ion sepa-ration are unchanged, and only effects of the field strength are observed. On the other hand, increasing wind speed results in growing turbulent exchange together with short-er times for the ions to be exposed to the applied electric field.
The destruction of the natural electrode effect in front of the grid can be explained by the turbulent mixing of the air passing under the grid in the absence of ion separation without an external electric field.
By the present method it will be possible in future research to shed much light on one important question: the non-existence or smallness of the natural electrode effect over grass surface. By using data on the vertical distribution of natural radioactivity under different stabil-ity conditions, the influence of the ionization on the elec-trode effect can be studied more penetratingly. Besides, the aerosol attachment and large-ion charge density play major roles in the natural electrode effect which can be included in future studies.
Acknowledgments. The study was supported partly by grants from the Swedish Natural Science Foundation and the Swedish Institute, partly by INTAS grant No.94-1054, and partly by the Russian Foundation for Fundamental Research under grant No. 93-02-16920.
Topical Editor Eymard thanks S. Despiaux and C. Ziegler for their help in evaluating this paper
Appendix
A choice of a correct lower boundary condition in terms of the turbulent-electrode-effect description is very complicated; this ques-tion has been discussed by many authors (see for review Willett, 1983). It is generally agreed that the correct condition is one of vanishing ion densities on a rigid surface. However, if a surface is ‘‘aerodynamically rough’’ within the gradient diffusion model for the surface flux of ions, the correct form of the lower boundary condi-tion is the following:
dn dz(z0)
" n(z
0)
iz0B~1N , (A1)
where the value of the parameterB~1N depends on the surface proper-ties. In particular, Willett (1983) discussed specially the casesB~1
N P0,
B~1
N "8.4 and B~1
N "15.6 for different types of surface. It is of interest
to find analytically a ‘‘quasi-stationary’’ asymptotic solution of Eq. (6), which could relate to x great enough. The solution, which satisfies the condition (A1) at the lower boundaryz"z
0and the conditionn
1"n
10at the upper boundaryz"z
1, has the form:
n1"n
10
(z/z0)kE0@C#
A
kE0iCBN
B
!1
(z1/z0)kE0@C#
A
kE0iCBN
B
!1. (A2)
It is seen from this expression that if the inequalityBNAkE0i/Cis satisfied, the asymptotic solution does not depend on the parameter
B~1N . In our case this inequality means:B~1N @25. Under that condi-tion, the value of the ion density at the lower boundary is very small:
n1"n
10
A
kE0i
CBN
B
(z1/z0)kE0@C!1
+n
10
A
kCBE0NiB
@1,while the derivativedn1/dz(z"z
0)"n
1kE0/Cz0PRatz
0P0. It
is easy to show that in the case of the noted limitation onB~1N value, the boundary conditionn1(z"z
0)"0 leads to the same solution
(A2) for the heights where the space charge is measured in the considered experiments, if the upper boundary condition is kept. It explains the results of our numerical investigation, which give very close solutions for different lower boundary conditions, including the conditionn1(z"z
0)"0 and the condition (A1) forB~1
N 420.
Therefore, in the problem considered, these boundary conditions are equivalent in terms of the accuracy we need. In particular, the curves on Fig. 4 respect the condition (A1) with the valueB~1N "7.
References
Anderson, R. A., Absolute measurements of atmospheric charge density,J.Geophys.Res.,71,5809—5814, 1966.
Bent, R. B., and W. C. A. Hutchinson,Electric space charge measure-ments and the electrode effect within the height of a 21-m mast,J.
Atmos.¹err.Phys.,28,53—73, 1966.
Chalmers, J. A.,Atmospheric Electricity, 2nd ed., Pergamon Press, Oxford, 1967.
Crozier, W. D.,Electrode effect during night-time low-wind condi-tions,J.Geophys.Res.,68,3451—3458, 1963.
Hoppel, W.,Theory of the electrode effect,J.Atmos.¹err.Phys.,29,
709—721, 1967.
Hoppel, W., and S. G. Gathman,Determination of eddy diffusion coefficients from atmospheric electric measurements,J.Geophys.
Res.,76,1467—1477, 1971.
Israel, H., Atmospheric Electricity I, U.S. Dept. of Commerce, Springfield, 1971.
Israel, H., Atmospheric Electricity II, U.S. Dept. of Commerce, Springfield, 1973.
Israelsson, S., E. Knudsen, and E. Ungethum, On the natural b-activity of the air in the atmospheric surface layer,Atmos.En
-viron., Pergamon Press,7,1127—1137, 1973.
Israelsson, S., E. Knudsen, and S. V. Anisimov,Vertical profiles of electrical conductivity in the lowermost part of the turbulent boundary layer over flat ground, J. Atmos. ¹err. Phys., 56,
1545—1550, 1994.
Knudsen, E., and S. Israelsson,Mobility spectrum of ions in the electrode layer, J. Geophys. Res., 99, No. D5, 10709—10712, 1994.
Knudsen, E., S. Israelsson, and B. Hallberg,Measurements of the electrode effect over flat, snow-covered ground,J.Atmos.¹err. Phys.,51,521—527, 1989.
Muhleisen, R., Electrode effect measurements above the sea, J.
Atmos.¹err.Phys.,20,79—81, 1961.
Tuomi, T. J.,The atmospheric electrode effect over snow,J.Atmos.
¹err.Phys.,44,737—746, 1982.
Willett, J. C.,An analysis of the electrode effect in the limit of strong turbulent mixing,J.Geophys.Res.,83,402—408, 1978.
Willett, J. C.,Fair-weather electric charge transfer by convection in an unstable planetary boundary layer, J. Geophys. Res., 84,
703—718, 1979.
Willett, J. C.,The turbulent electrode effect as influenced by inter-facial ion transfer,J.Geophys.Res.,88,8453—8469, 1983.