Creative Components Iowa State University Capstones, Theses and Dissertations
Winter 2018
Study on OPAL-RT Simulation System Hardware in Loop and
Study on OPAL-RT Simulation System Hardware in Loop and
Simulation on Microgrid Black Start
Simulation on Microgrid Black Start
Jin Cui
Iowa State University, [email protected]
Follow this and additional works at: https://lib.dr.iastate.edu/creativecomponents
Part of the Power and Energy Commons
Recommended Citation Recommended Citation
Cui, Jin, "Study on OPAL-RT Simulation System Hardware in Loop and Simulation on Microgrid Black Start" (2018). Creative Components. 52.
https://lib.dr.iastate.edu/creativecomponents/52
Study on OPAL-RT Simulation System
Hardware in Loop and Simulation on
Microgrid Black Start
By
Jin Cui
A creative component paper to partial fulfillment of the
requirements for the degree of
MASTER OF SCIENCE NON-THESIS
Major: Electrical Engineering
Program of Study Committee:
Zhaoyu Wang
Table of Contents
CHAPTER 1. OPAL-RT SIMULATION SYSTEM ... 5
1.1 INTRODUCTION ... 5
1.2 THE APPEARANCE AND PORTS OF OP5700 SIMULATOR ... 5
1.3 SIMULATOR HARDWARE OVERVIEW ... 8
1.4 RT-LAB SOFTWARE OVERVIEW ... 8
1.5 SIMULINK MODEL SETUP ... 9
CHAPTER 2. THE SIMULATION OF MICROGRID BLACK START WITH DESCRETE GENERATOR ... 12
2.1 INTRODUCTION ... 12
2.2 SIMULINK SETUP ... 12
2.3 RENEWABLE ENERGY GENERATOR OUTPUT ... 17
2.4 THE INTRODUCTION TO MICROGRID BLACK START TEST ... 18
2.5 MICROGRID WITH ONLY SOLAR AND WIND GENERATOR, WITHOUT LOAD BALANCE CONTROL 19 2.6: MICROGRID WITH ONLY SOLAR AND WIND GENERATOR, WITH LOAD BALANCE CONTROL BUT NO SYNCHRONOUS CONDENSER. ... 21
2.7: MICROGRID WITH ONLY SOLAR AND WIND GENERATOR, WITHOUT LOAD BALANCE CONTROL, WITH SYNCHRONOUS CONDENSER. ... 23
2.8: MICROGRID WITH ONLY SOLAR AND WIND GENERATOR, WITH LOAD BALANCE CONTROL AND SYNCHRONOUS CONDENSER. ... 25
2.9: MICROGRID WITH SOLAR, WIND AND DIESEL GENERATOR, WITHOUT SYNCHRONOUS CONDENSER. ... 27
2.11 CONCLUSION ... 30
CHAPTER 3: HARDWARE IN LOOP SIMULATION ... 32
3.1 INTRODUCTION ... 32
3.2 PROGRAM VC707 FPGA ... 32
3.3 HARDWARE USED IN THE SIMULATION ... 34
3.4 TEST RESULT AND DISCUSSION ... 35
ABSTRACT
In power grid simulation able to provide real time simulation give us an
advantage to see how to power gird work in real time and let the electrical power grid
operator to make adjustment in a humane time scale much more easily. Before
OPAL-RT simulator system been sold in the market in late 1990s, real time simulation of the
Electrical Grid is much more difficult. The OPAL-RT simulation system use a dictated
computer system and efficient coding to make the power grid simulation runs much
faster and able to display the result of the simulation in real time. The OPAL-RT
simulation system also has many digital and analog output and input port, which can be
use to connect and control many external hardware, by using this feature we can make
a hardware in loop simulation to control and read the output of power simulation
hardware in real time. The scope of this project is to study how to program the
OPAL-RT simulation system to do the hardware simulation. I will also simulate the microgrid
during main electrical grid fault using OPAL-RT simulation system and study how to
improve the stability of the microgrid during black start after disconnect with the main
electrical gird. Finally I will create a hardware in loop simulation to find if the result of the
CHAPTER 1. OPAL-RT SIMULATION SYSTEM
1.1
INTRODUCTION
The OPAL-RT simulation system in my laboratory consist of a chassis called the
OP5700 simulator with many connection ports on the output and computer and control
hardware inside and, a interface software called RT-Lab that runs on the personal
computer in my lab. The OP5700 simulator has a powerful and dictated CPU that use to
run the simulation on the electrical grid and a FPGA that use to control the output and
hardware. The random access memory of the system is 16GB. The RT-Lab works as
the communication interface between the PC and OP5700 simulator, its job is to control
the function of the OP5700 simulator and translate the Simulink model into an efficient
code that can run on the OP5700’s CPU. The communication between PC and OP5700
is using the local area network or LAN via Ethernet cable. There the Redhat operating
system installed on the OP5700 simulation system, it has a monitor output via VGN
cable and accept the keyboard and mouse input, thus we can operate it locally without
using PC.
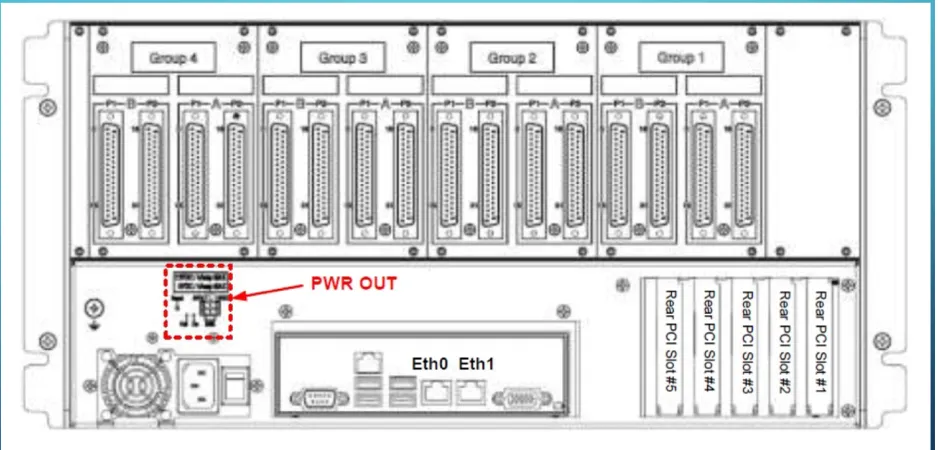
Figure 2: FRONTAL CONNECTION PORT
Figure 4: REAR CONNECTION PORT
Figure 5: DB-37 CONNECTOR FOR SINGAL I/O
As the image above shows the both front and rear connection port of the OP5700
simulator. The front end of the connection port is RJ-45 connector was mainly use to
monitor the signal from the oscilloscope, which signal to monitor depend on the
configuration of the Simulink file. The back side of the OP5700 simulator works as the
signal control port to control the signal send into the hardware we later on used in the
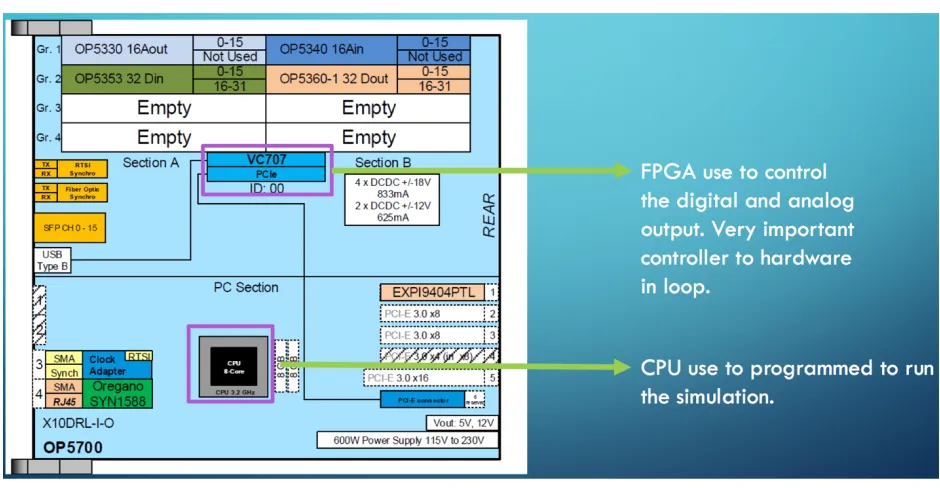
1.3
SIMULATOR HARDWARE OVERVIEW
Study the hardware used inside OP5700 simulator can help us greatly
understand how the system could be configured and how the system behaves.
[image:9.612.95.565.190.434.2]Below is the diagram of the hardware connection inside the OP5700 simulator.
Figure 6: OP5700 INTERNAL HARDWARE
As we can see from the image above, that CPU calculate how the simulation could
have played out, and it will tell the FPGA board when to output or acquire a signal.
1.4
RT-LAB SOFTWARE OVERVIEW
The other important tool to run the simulation is the RT-Lab software. In this section
I will only briefly talk about what kind of functionality do we expect from this software
without going into much detail discussion on how to use this software.
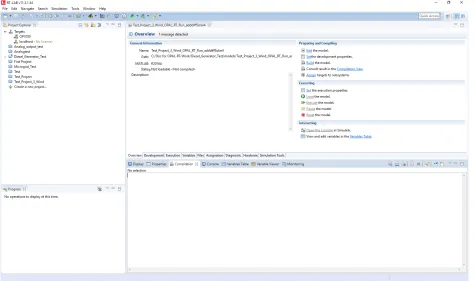
The RT-Lab software is developed by the same corporation that make OP5700
simulator, it works mostly as the translator to translate the Simulink model that created
be use to control the parameter of the simulation and execution. Below is an image
[image:10.612.72.547.128.409.2]about of RT-Lab software main window.
Figure 7: RT-LAB MAIN WINDOW
As you can see from the image above, it has a listed of the project that created
that can be run the on the simulator. It also controls the simulator to load the project,
execute the project or pause the running process. There are also other parameters that
we can set for the simulation but I will not list it here.
1.5
SIMULINK MODEL SETUP
Unlike the way we normally run the Simulink on the PC, there are some
requirements needed to setup the Simulink model in order for it to run on the simulator.
Here I will briefly talk about what the requirements are, and overall what the structure of
Basically when the Simulink model been run it will run in synchronize at the
simulator and PC, thus a model need to specify which part will run on the simulator and
which part will run on PC. The part run on the simulator will consist of the electrical grid
configuration and the variety system that came with it. The part that runs on PC will
consist of which signal from the electrical grid you wish to monitor in real time on PC. A
special Simulink block that came with the RT-Lab is needed in order for these two part
to communicate in real time. The naming of the two part is also need to follow a certain
rule in order for the RT-Lab to identify during the translation process. The part runs on
PC is called control subsystem, in Simulink model you need to name it to SC then follow
a name you want to give. The part that run the the simulator is called master
subsystem, in Simulink model you need to name it to SM then follow a name you want
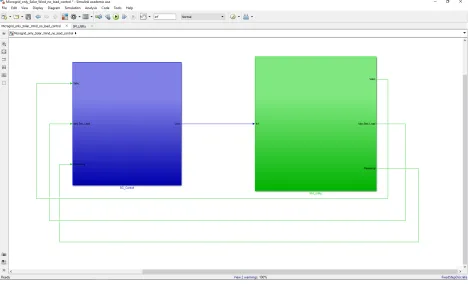
[image:11.612.73.541.405.689.2]to give. Below is an image to show the overall view of the Simulink model.
As you can see from the image above that the two subsystem are connected with
each other with a control signal going out of the part that runs on PC to the part that
runs on simulator, and monitor signal going the opposite way.
Another thing need to pay attention before running the simulation is that the
simulator will only accept discrete step simulation and have a certain restriction on the
sample time of the simulation. The sample time can’t go below 10^-5 second for the
simulation, or the simulator will not run.
After the Simulink model meet the requirement to run on the simulator, all you
need to do is to create a project on the RT-Lab software and upload your Simulink
model to the created project and let the RT-Lab translate and upload the code to the
CHAPTER 2. THE SIMULATION OF MICROGRID BLACK
START WITH DESCRETE GENERATOR
2.1 INTRODUCTION
The modern development of the wind and solar energy let smaller community at
remote locations around the world, put more wind turbines and solar panels to their
local electrical grid to get cheaper electrical energy [1]. By doing so these small
communities formed a local microgrid, with it own electrical energy producer and
consumer, but a recently hot research topic is on if the main electrical grid have a
electrical fault, will the discrete and localized generator can black start their own local
grid after disconnect with the main electrical grid [2] [3].
In this chapter we will experiment on the OPAL-RT simulator with main electrical
grid fault and microgrid black start in real time to see, if it possible for the microgrid to
return it its original frequency and voltage by using the generator available locally
connected the microgrid.
2.2 SIMULINK SETUP
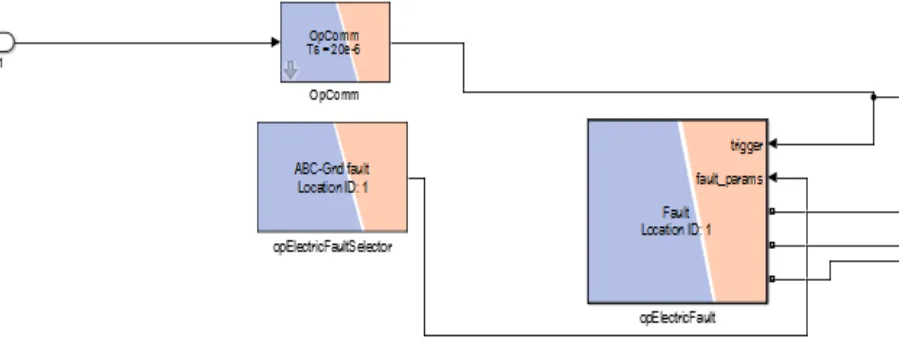
As I have state in pervious chapter that the Simulink need two subsystems in
Figure 9: SIMULINK MASTER SUBSYSTEM OVER VIEW
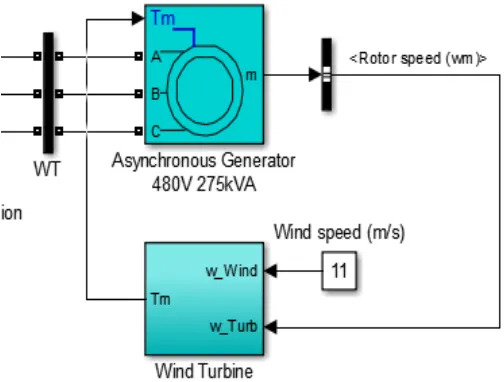
[image:14.612.91.545.490.662.2]Figure 11: MAIN GENERATOR MODULE
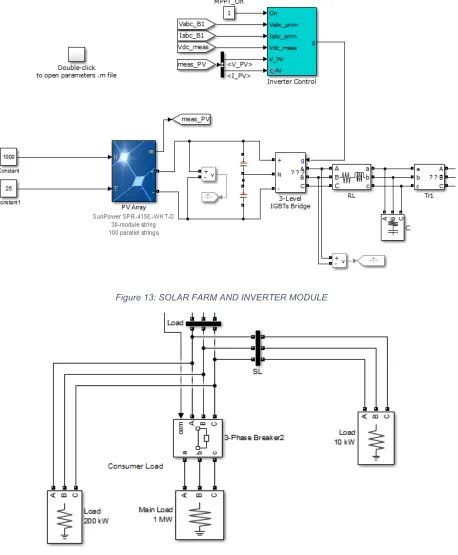
Figure 13: SOLAR FARM AND INVERTER MODULE
Figure 14: LOAD MODULE
Due to the close distance between the wind turbine and solar farm to the load
pure resistive. The electrical fault generator will generate a electrical fault that short all
generator in the microgrid, and after certain amount of time the main circuit breaker will
break the microgrid from main electrical grid and microgrid will work as an island mode,
I will then take the load voltage and frequency measurement to see if the load could
back to its normal voltage and frequency.
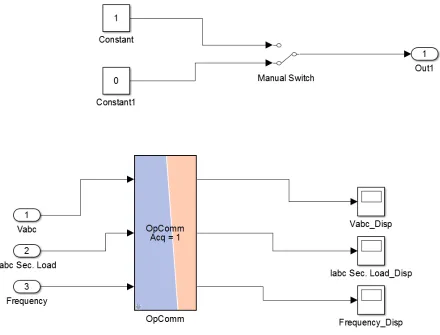
The part that runs on PC will take the measurement in real time, below is over
[image:17.612.89.529.277.612.2]view of the subsystem that runs on PC.
Figure 15: CONTROL SUBSYSTEM OVERVIEW
The control subsystem that runs on PC, have a manual switch that control the
electrical fault in the master subsystem. The scope in the control subsystem take the
2.3 RENEWABLE ENERGY GENERATOR OUTPUT
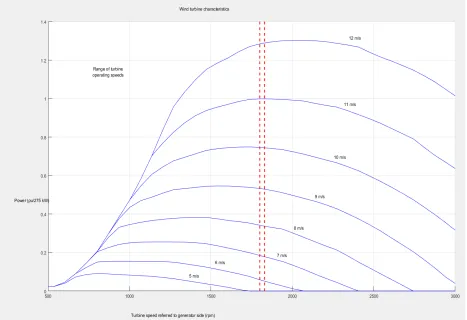
As you can see from the module above, that we have wind turbine generator,and solar farm in our microgrid, both of these two type of generator’s power output
depend on its local environment. Here I list the generator output plot of wind turbine
respect to wind speed, and solar farm at 1000 W/M^2 solar irradiation and ambient
[image:18.612.75.542.247.567.2]temperature.
Figure 17: SOLAR FARM POWER AT 1000 W/M^2
In my setup I will set the wind speed at constant 11m/s and solar irradiation at
1000W/m^2.
2.4 THE INTRODUCTION TO MICROGRID BLACK START TEST
With a relative simple microgrid to analysis and test, all we need to to came up aplan to do the black start test. Here down below is the different test that I will take:
1: Microgrid with only solar and wind generator, without load balance control.
2: Microgrid with only solar and wind generator, with load balance control.
3: Microgrid with only solar and wind generator, without load balance control, with
4: Microgrid with only solar and wind generator, with load balance control and
synchronous condenser.
5: Microgrid with solar, wind and diesel generator, without synchronous
condenser.
6: Microgrid with solar, wind and diesel generator, with synchronous condenser.
In order to say the simulation shows that the microgrid successfully black start
the frequency must return to 60Hz after disconnect with main electrical grid and the
voltage need to return to normal, which in this case is 1 per unit.
There are some parameters also need to concern in the simulation, the
parameter can change accordingly but I will list below what the parameter are and what
my setting was:
1: The amount of time that takes for the main power grid breaker to disconnect
with the main power grid after the fault. In all the cases I choose the breaker
responds time to 0.1 second.
2: The amount of load after main power grid disconnection. It can change when
there is a load balance controller.
3: When to disconnect and reconnect with main power grid. I choose manual
disconnect and reconnect in all cases.
In the following sections of this chapter, I will analysis case by case on each test result.
2.5 MICROGRID WITH ONLY SOLAR AND WIND GENERATOR,
WITHOUT LOAD BALANCE CONTROL
Figure 18: LOAD FREQUENCY
In the simulation the load consumes more power than the generator can provide.
As you can see from the simulation result above that the load frequency increase
uncontrollably and the voltage drop to almost none. We can not say the microgrid black
start in this case.
2.6: MICROGRID WITH ONLY SOLAR AND WIND GENERATOR,
WITH LOAD BALANCE CONTROL BUT NO SYNCHRONOUS
CONDENSER.
In this simulation, I going to add a control system that can adjust the amount of
[image:22.612.88.522.347.583.2]load to control the frequency back to normal. Below is the load control schematic.
Figure 20: LOAD CONTROL
As you can see there is a read out of the voltage from the bus that feed into the
load and that information was send to the frequency regulator to control the amount of
Figure 21: LOAD FREQUENCY
As we can see from simulation above that like the simulation without the load
control, the load frequency rises uncontrollably, and load voltage decrease to almost
none, thus a large amount of power is needed to provide right after the fault is cleared
to kick start the microgrid.
2.7: MICROGRID WITH ONLY SOLAR AND
WIND GENERATOR,
WITHOUT LOAD BALANCE CONTROL, WITH SYNCHRONOUS
CONDENSER.
In this simulation, we are going to try using the synchronous condenser to
provide some initial stability to provide power to drive the load and see if it works out
[image:24.612.71.547.379.675.2]The synchronous can store large amount of kinetic energy to convert to electrical
[image:25.612.71.544.128.407.2]energy and it can provide 300kVA of complex power. Below is the simulation result.
Figure 24: LOAD FREQUENCY
[image:25.612.75.543.430.696.2]The simulation result show that the synchronous condenser does stabilize the
voltage but the load frequency still rises uncontrollably, add the load frequency control is
needed.
2.8: MICROGRID WITH ONLY SOLAR AND WIND GENERATOR,
WITH LOAD BALANCE CONTROL AND SYNCHRONOUS
CONDENSER.
Since in the simulation above, shows that by adding the synchronous condenser
the load voltage does recover, but the frequency rises uncontrollably, thus in this
simulation we add the frequency controller to control the amount of load that applied to
[image:26.612.71.544.376.676.2]Figure 27: LOAD VOLTAGE IN PER UNIT
The simulation result show after certain amount to time after the main electrical
grid disconnection, the load frequency control did manage to drive back the frequency
back to 60Hz and the voltage like the previous simulation return back to normal. This
control scheme did work as we expect, but it going to expensive to add both
synchronous condenser and load frequency control into the microgrid, thus in next
simulation we going to add a diesel generator into the micro grid to see if it works better
2.9: MICROGRID WITH SOLAR, WIND AND DIESEL
GENERATOR, WITHOUT SYNCHRONOUS CONDENSER.
In this simulation, we going to add a diesel generator that has a rating of
3.125MVA which is enough to drive the load after main electrical grid disconnection.
[image:28.612.78.531.230.609.2]The diesel generator is model as below.
Figure 28: DIESEL GENERATOR MODEL
As you can see from the control scheme of the diesel generator, it will try to find
the amount of power available to control the amount of torque available to drive the
Figure 29: LOAD FREQUENCY
[image:29.612.71.542.430.672.2]The simulation result out preformed the simulation without diesel generator and,
the frequency is most stable. The assumption of the simulation was to operation the
diesel generator during the entire period of time, even before the main electrical grid
disconnection which is not a good idea. In next simulation we want to add a
synchronous condenser to stabilize the grid first after the main electrical grid
disconnection and then start up the diesel generator to provide the addition power,
which going to save some money since we only use diesel generator when the
microgrid is in island mode.
2.10: MICROGRID WITH SOLAR, WIND AND DIESEL
GENERATOR, WITH SYNCHRONOUS CONDENSER.
In this simulation we are going to add the synchronous condenser into the [image:30.612.73.547.424.686.2]Figure 32: LOAD VOLTAGE IN PER UNIT
As you can see from the result shown above, the load frequency changed rapidly
after the main electrical grid disconnection, this is due to the time that need to take for
the diesel generator to start, after the diesel generator start and it was able to drive the
load into stability in both voltage and frequency.
2.11 CONCLUSION
From the simulation study above, we find that it is possible to black start the
microgrid on it own with only solar and wind but there are other things needed to add
into the microgrid. By adding the synchronous condenser and load frequency control we
can let the microgrid to stabilize after a certain period of disturbance, but add load
frequency control is very hard due to most demand is most likely wasted, and quick
generator that can generate enough the power the microgrid, the performance is most
stable in both frequency and voltage, but realistically it will cost more to run due to we
need to run the diesel generate all the time, and electrical grid fault is rare event. The
better way of doing it is to add a synchronous condenser into the microgrid to make
sure it can provide enough power to let the diesel generate to start which will take some
time. The later method prove that it will cost some frequency instability as a trade off,
CHAPTER 3: HARDWARE IN LOOP SIMULATION
3.1 INTRODUCTION
The main idea of doing hardware in loop simulation is to test the physical
response of the system as close to reality as possible. The simulator need to connect
and control the physical power source and generator in order to run the simulation. In
my lab we do have the hardware that we need to do the hardware simulation. In order to
do the simulation that we need, we first need to have a controllable power source and a
load simulator, then I need to find a way to connect them with my simulator and use a
proper signal from the simulator to control the system. The OP5700 simulator did have
a FPGA that can generate signal and control the power source, thus work out how to
program FPGA is the first step toward doing hardware in loop.
3.2 PROGRAM VC707 FPGA
As what we have shown in the section 1.3, we do have an FPGA system code
name VC707, installed on the simulator, and we can use it control the signal for the
DB37 connector at the rear of the simulator.
In order to program the VC707 FPGA, a bitsteam file that can be used to
program the FPGA was needed. Fortunately, during the initial system setup, we did get
a copy of the bitsteam file, that can be use later on to program the FPGA. Below is the
Figure 33: SYSTEM OVERVIEW
[image:34.612.78.547.63.702.2]As you can see from system overview, the hardware initialization block is
reference to the bitstream file that will be used to configure the FPGA. The control
subsystem was like before to switch the electrical fault, and there is a monitor signal
from master subsystem to read the data from the hardware and send it to the control
subsystem for display.
3.3 HARDWARE USED IN THE SIMULATION
There are two hardware used in the simulation, one is power source, the other is
the programmable load. Both of them have input and output terminal, by utilize these
terminal available, we can control the hardware for the simulation.
The power source is called Chroma 61511 programmable AC source; it can read
an analog signal from the DB37 connector and output a corresponding voltage. The
ratio between the input and output voltage is shown below.
Figure 36: VOLTAGE OUTPUT CONVERSION
The load used in the simulation was Chroma 63804 programmable load, it has
terminals to read out the voltage and current, thus we can make the connection
between the terminal and DB37 connector analog read in port to gather the voltage and
frequency information during the fault. With everything we need, now we can do
3.4 TEST RESULT AND DISCUSSION
In this hardware in loop simulation, I going to simulate a simple electrical system
fault and black start, and see the result of the simulation. The simulation result is shown
[image:36.612.73.541.193.398.2]below.
Figure 37: NORMAL VOLTAGE FROM THE LOAD
[image:36.612.76.543.221.653.2]As you can see from the simulation result, as we can expect, that there is a
voltage overshoot during the initial start up, the power source has enough power to
quickly start the load, thus there is not to much voltage or frequency change right after
black start.
3.5CONCLUSION
The initial microgrid black start simulation did show some promising result, but due
to currently I did not use digital signal to control the load, thus there are more work can
be done, due to the short period of this project don’t have enough time to do the digital
signal control. Doing the hardware in loop by use digital control signal will give you more
control authority to the power source and read much more information from the load.
Both power source and load have parallel communication channel GPIB or serial
communication channel RS-232. OP5700 simulation do not came with these
communication channel directly.
More work need to study the digital communication protocol and use it to program
the digital output from the DB-37 connector and make a connection cable to convert the
DB-37 digital terminal to the digital communication terminal listed above. It will take
some time to study, program and make connection cable by yourself, due to no such
REFERENCE
[1] N. Hingorani “Future distribution system”, IEEE PES Innovative Smart Grid Technologies, 2012
[2] M. Farzinfar, M. Jazaeri, N. K. C. Nair, F. Razavi, "Stability evaluation of MicroGrid using real-time simulation", in Power Engineering Conference (AUPEC) Australasian Universities, 2014.