in the population sciences published by the Max Planck Institute for Demographic Research Konrad-Zuse Str. 1, D-18057 Rostock · GERMANY www.demographic-research.org
DEMOGRAPHIC RESEARCH
VOLUME 19, ARTICLE 18, PAGES 599-664
PUBLISHED 01 JULY 2008
http://www.demographic-research.org/Volumes/Vol19/18/ DOI: 10.4054/DemRes.2008.19.18
Research Article
Hungary:
Secular fertility decline with
distinct period fluctuations
Zsolt Spéder
Ferenc Kamarás
This publication is part of Special Collection 7: Childbearing Trends and Policies in Europe (http://www.demographic-research.org/special/7/)
© 2008 Spéder & Kamarás.
1 Introduction 600
2 Fertility 603
2.1 Fertility trends 603
2.2 The mean age of mothers at birth 605
2.3 Age-specific fertility 607
2.4 Fertility by parity 608
2.5 Romany population 610
2.6 Postponement or pattern change? 611
3 Birth control 614
3.1 Induced abortion 614
3.2 Contraception 618
4 Fundamental changes in partnership relations 619
4.1 Development of marriages 619
4.2 The spread of cohabitation 622
4.3 Childbirth propensity in marriage and cohabitation 625
4.4 Extramarital births 626
4.5 Divorce, stability of partnerships 629
5 Social, structural and institutional environment for childbearing 631
5.1 Education 632
5.2 Labour market 634
6 Values and attitudes 641
6.1 Ideational factors affecting childbearing in present-day Hungary (effects in micro-models)
641
6.2 Selected features of value changes in Hungary (macro-level associations)
642
6.3 Maturation of values or the spread of new values? 646
7 Population and family policies 647
7.1 Population policy measures 647
7.2 Evaluation and demographic effects of population policy measures 651
8 Phases of transformation. An attempt to segment fertility development in Hungary
654
8.1 1967–1985: The period of active population policy 654 8.2 1985–1990: incubation of the alternative family mode(s) 655 8.3 1990–1995: the period of institutional vacuum and anomie 655 8.4 1995– : Pattern change: adaptation to new social circumstances 658
Hungary:
Secular fertility decline with distinct period fluctuations
Zsolt Spéder1
Ferenc Kamarás 2
Abstract
In this study, we demonstrate from different angles that Hungarian fertility basically decreased between 1965 and 2005, but also clearly fluctuated, and showed different patterns in the different periods within this epoch. As a result, the clear communist-era family pattern of “early marriage and childbearing with two children” was replaced, but new family model(s) have not yet fully emerged. We could show that profound changes in partnership behaviour –divorce and cohabitation– started before the change of the political regime, but also that changes in partnership relations accelerated after 1990, and that partnerships have become more fragile. In addition, Western-style values of “empty individualism” and consumerism were clearly present under socialism, but their motivating force was tamed by the communist system, in which population policy played a significant role. Of these institutional changes, we ascribe the greatest importance to the expansion in the educational system and the changes in the labour market. We show that, following the changes in the economic system, the conflict between family and work intensified. The synchronic consideration of values, labour market relations, economic development, and population policy; and the relationship of these factors to fertility and nuptiality trends, enabled us to formulate a developmental scheme of four phases concerning the evolution of fertility since 1965.
1. Introduction
Over the past century, Hungary went from having an essentially growing population with a balanced age composition, to having a population that was gradually aging, and then declining. Population numbers almost doubled within a century, from 5.3 million in 1880, and reached a maximum of 10,709,000 people in 1980. Population size has been decreasing steadily since then, albeit with varying levels of intensity, falling to 10,066,000 at the beginning of 2007. This represents a decrease of about 650,000 (6%) over a quarter of a century.
The fluctuating, but basically declining fertility trend and the high level of morbidity may have also played a role in the early appearance of natural population decrease, which can be regarded as early even in a European comparison. The period total fertility rate (PTFR) dropped below the replacement level as early as the end of the 1950s, and in the first half of the 1960s, when most European countries were experiencing a “baby boom,” the Hungarian total fertility rate fell below 1.8, a uniquely low value even on a global scale. The improving trend of mortality after the Second World War came to a halt in the mid-1960s. During the “epidemiological crisis” of the following decades, life expectancy at birth for women increased a little, though intermittently, while life expectancy among men decreased significantly, and did not reach and exceed the level of three and a half decades earlier until the early years of the new millennium.
Consequently, it was not accidental that population decline – or, more precisely,
the problem of low fertility – often became the subject of social debates in Hungary.3
There was a perceptible degree of public awareness of the issue, and concerns about population decline resulted in political action after the mid-1960s. The appearance of low fertility relative to other European countries no doubt contributed to increased awareness of population related issues, as did the fact that the re-drawing of the borders of Hungary after the two world wars radically reduced the country’s territory, and millions of members of Hungarian communities became disconnected from their homeland and citizenship. Since the end of the 1960s, politicians have been formulating population goals, framing and initiating population measures cyclically, and in an incoherent fashion. However, it would be hard to claim that the problem of low fertility has been continuously at the centre of political action.
3 Considering important social issues before the second World War does not belong to the objectives of the
Population measures that evolved in the second half of the 1960s, and that intensified further in the 1970s, temporarily halted the decline in fertility, and even resulted in fertility above the replacement level for a few years. The 1.8 value of PTFR that characterised the 1980s was above the European average, but it was not sufficient to compensate for the effects that the high level of mortality had on population decline.
While the role of governmental measures – presented in detail in Section 7 – has
hardly been negligible in the development of Hungarian fertility over the last half
century, the change in the political and economic system4 starting in 1989–1990 had a
major role in the basic transformation of fertility conditions, and in fertility pattern change, as was the case in other ex-communist countries. These changes have created radically new conditions for everyday action, altered the system of opportunities for individual behaviours, and the ranking of preferences. Obviously, the circumstances of fertility choices and life course decisions were modified as well. In order to understand the shifts in fertility around the change of the political regime, we provide an overview of selected facets of economic transformation in detail, and compare the operation of the labour market before and after 1990, and its relation to childbearing. In addition, we discuss the potential effects of sudden changes in the supply of consumer goods on the desire to have children, and take into consideration the effects of educational expansion on the life course (Section 5).
Value orientations and attitudes play key roles in modern societies as individuals choose among socially available options related to shaping and ordering the course of their lives, including choices about whether or not they have children, when they have children, and how many children they have. Obviously, values not only affect individual decisions about childbirth; rather, there are a number of choices that narrow, widen or rearrange the conditions of childbearing. It is, therefore, necessary to identify when and what kind of shifts took place in this over the last quarter of a century (Section 6). A systematic overview of the trends in values and attitudes is impossible because we lack a standard instrument for the measurement of values, and because surveys of values are quite rare. Based on available surveys, we may be positive that value changes were not triggered by the change of political regime in Hungary, a country which may have been regarded alongside Yugoslavia as the most open among the former socialist countries from the mid 1960s (“the happiest barrack,” as it was often called by journalists).
Owing to the change of political regime, the new structural conditions, the diffusion of values, and the impact of these values on the new set of circumstances, the ever-changing system of institutions of family and population policy encouraged and made the emergence of a new fertility pattern possible. In line with European trends,
4 For a detailed discussion about the social, political and economic transition, see the volume of Admaski, et
childbirth has shifted to a higher age, and the number of extramarital births continues to grow. There are signs indicating that, not only the postponement of childbirth, but also a substantial differentiation of fertility behaviour is taking place; i.e., that new patterns of childbearing are emerging. This still incomplete pattern change led to the decrease in the level of fertility of 40% in the 1990s, and the level has remained unchanged at around 1.3 since 1997.
The starting point of our analysis is the accurate documentation and analysis of fertility trends (Section 2). It is essentially based on the analysis of vital statistics data and the fertility database that Kamarás has compiled from the data (KSH 1996, KSH 2006a). Survey data are only used as a complement to this analysis. The analysis of birth control (Section 3) also partly rests on the available vital statistic data, but is largely based on the results of special cohort analysis of induced abortions (KSH 2007). Unfortunately, survey data on the practice of contraception are only available from an earlier period, and for a population with limited representativeness.
We have also devoted ample space to the presentation of partnership trends, about
which the data of the Hungarian Generation and Gender Survey (HGGS), the so-called
“Turning points of the Life Course”5 provide indispensable information (Section 4). Hungary, on the verge of the Hajnal line (Hajnal, 1965), was characterised by the general practice of early marriage until the 1980s. This behaviour pattern started to change in the 1980s, and it has been fundamentally transformed over the past 15 years. The values of total first marriage rate (TFMR), around 0.8–0.9 during the 1970s–1980s, was almost halved in the 1990s, and has remained stuck at around 0.45 in recent years. With the aid of HGGS data, we are able to track the spread of cohabitations, which have become dominant in the establishment of first unions. Importantly, cohabitating unions are less stable than marriages; consequently, they certainly reduce the childbearing propensity of couples living in partnership.
In the concluding section of our chapter, we attempt to periodise fertility
tendencies of the last 50 years (Section 8). In general, we agree with those who claim
that the change of political regime marks a sharp break in fertility trends in former socialist countries (Sobotka, et al. 2003). At the same time, the analysis of data on fertility and nuptiality, taking social structural conditions into consideration, as well as the identification of value changes and the overview of political measures, motivated us to segment the fertility conditions of the last half century into four separate phases. We suppose that, during state socialism, the long period of active population policy, the seeds of alternative family formations had already appeared, and then disembogued into an incubation period. The development of the characteristic fertility behaviour under the new, stabilised socio-economic regime (which is often manifested by a shift towards later timing of childbearing, commonly labelled as ‘postponement’) was preceded by a
period of institutional vacuum/anomie,6 when routine and non-conformist behaviours coexisted. Numerous characteristics of the new childbearing practice manifest themselves in the fourth transformation phase; however, we think that fertility pattern change has not yet reached its end.
2. Fertility
2.1 Fertility trends
The Hungarian fertility of past decades is characterised by a strongly fluctuating, but basically decreasing trend. The secular decreasing trend could be attributed to the longstanding fertility transition and, arguably, to the two fundamental political regime changes during the second half of the twentieth century: to the ‘introduction’ of communism after the Second World War, and to the political transformation to the market economy at the end of the century. The considerable fluctuations in fertility, apparent in the repeating pattern of peaks followed by troughs, are largely the result of social policy endeavours aimed at affecting and changing the basically decreasing trend by applying “external” means, sometimes in the form of restrictions (prohibition of abortion), and sometimes using incentive measures.
Hungary was the first European country in which the period total fertility fell below the replacement level following the Second World War, and, except for a four-year period, fertility has remained below replacement level for the last 50 four-years. The baby boom of the mid-1950s was mainly the outcome of the strict prohibition on abortion that lasted for a few years; however, after this period, the level of fertility decreased by 40% between 1954 and 1962, and the total period fertility rate (PTFR) of below 1.8 at the beginning of 1960s was, alongside Estonia, the lowest in the world. Policy measures, which resulted in a sudden but temporary increase in fertility rates, contributed to the comparatively large size of the baby boom birth cohorts of the
mid-1970s.7 The PTFR of around 1.8 of the 1980s, however, fell behind governmental
expectations and goals, but it was above average in a European comparison. From the beginning of the 1990s onwards, there was a significant and permanent drop from this level. Principally, the phenomenon of 35 years ago was repeated: namely, the level of PTFR decreased by 40% within eight years. The PTFR sank below the ‘lowest-low’
6 We agree that rising anomie was important for fertility decisions, as emphasised by Philipov (e.g., Philipov
et al. 2006), however, we suppose that this role was only valid for one particular period of the transition from communism to the market economy. Since post-communist countries have not gone through the same routes of transition, the role and content of anomie, and its duration may differ in them.
level of 1.3. In the new millennium, a slow but hesitant move was perceptible from this historical nadir that resulted in a PTFR of 1.35 in 2006 (Figure 1.)
Figure 1: Period (1947–2006) and cohort (1918–1970) total fertility rates
1 1.2 1.4 1.6 1.8 2 2.2 2.4 2.6 2.8 3
1950 1954 1958 1962 1966 1970 1974 1978 1982 1986 1990 1994 1998 2002 2006
T
o
ta
l
fe
rt
il
it
y
r
a
te
Period TFR Cohort TFR
1970 cohort 1917 cohort
Source: Vital statistics data, Demographic Yearbooks HCSO. Completed cohort TFR: Census 1970 for birth cohorts 1917–1921; Fertility database for birth cohort 1921–1970.
Note: The time lag between the period TFR and cohort TFR is 30 years. Cohort TFR for birth cohorts 1960 through 1970 until the age reached in 2006.
2.2 The mean age of mothers at birth
For a long period, Hungarian fertility was characterised by entry into motherhood at a young age. During the previous century, the decrease in fertility was accompanied by mothers becoming younger; after the number of higher-order births started to fall, the ratio of families with four, five, or more children declined radically. The mean age of mothers at birth was under 25 years in the 1970s: their first child was born when they were 22–23 years old, and on average, they gave birth to their second child before turning 26. The dual earner family with two children became the general model, which meant that women and couples basically realised their planned family size by the end of their twenties. The fertility of teenagers was high, and the most frequent age of mothers at birth was between 20 and 24 years. The fertility of women under 25 years of age amounted to 60% of the total period fertility rate, while the fertility of women under age 30 numbered 85% of PTFR.
The signs of change were already apparent in the 1980s, but became explicit from the mid-1990s onwards. The new phenomenon of delayed motherhood set in and gradually rose in prominence. This trend, in turn, negatively affected period fertility rates for the first time. Whereas during the 20 years between 1975 and 1995, the mean age of mothers at birth increased by only slightly more than one year, it rose by nearly three years during the following decade. The lower the birth order of the child, the higher the increase in the mean age; in other words, the birth of the first and second child at a later age plays the most significant role in the increase in the mean age of mothers. In 2006, the mean age of mothers at the birth of their first child was 27.3 years; at the birth of the second child, the mean age was 29.5 years. Compared to the mid-1990s, these ages represent increases of four and three years, respectively (Figure 2.)
Figure 2: Mean age of mothers by birth order 1970–2006
20 22 24 26 28 30 32
1970 1975 1980 1985 1990 1995 2000 2005
M
ea
n
a
g
e
(i
n
y
e
ar
s)
1. 2. 3. 4. All orders
Source: Vital statistics data, Demographic Yearbooks HCSO.
Figure 3: Fraction of period total fertility rate contributed by age groups of women, 1959–2006
0 5 10 15 20 25 30 35 40 45
1959 1964 1969 1974 1979 1984 1989 1994 1999 2004
P
er
ce
n
t
o
f
to
ta
l
fe
rt
il
it
y
15–19 ages 20–24 ages 25–29 ages 30–34 ages 35–39 ages 40–49 ages
2.3 Age-specific fertility
Despite the strong oscillations of period fertility, there was no fundamental change in the age-specific profile of fertility until the 1990s: at times when fertility suddenly increased or dropped, this shift was manifested across all childbearing ages. The first signs of change may be perceived in the age-specific distribution of 1990; later, the profile of the curve radically changes, increasingly resembling normal distribution. Parallel to the rapid decrease in fertility, the modal age shifts to an increasingly later age: in 2000, childbirth was most frequent at the age of 27; while in 2006, most mothers were 29 years old. The fertility curve for 2006 already showed signs of the ‘recuperation’ of births that, presumably, had been delayed at younger ages. The rise in fertility in 2006 is chiefly due to the more frequent childbirth of women over 30, whereas the fertility of women under 25 further decreases (Figure 4). The future level of fertility will be determined by the extent to which the more frequent births by women over 30 compensate for the ‘missing births’ among young generations.
Figure 4: Age-specific fertility rates, selected years
0 20 40 60 80 100 120 140 160 180
14 16 18 20 22 24 26 28 30 32 34 36 38 40 42 44 46 48 Age
F
er
ti
li
ty
R
at
e
(
p
er
1
0
0
0
w
o
m
an
)
1960 1970 1980 1990 2000 2006
2.4 Fertility by parity
By breaking down period total fertility rate (PTFR) by birth order, we get an idea of what role different birth orders played in the decade-long fluctuation of fertility (Figure 5). The increase of fertility that commenced in the second part of the 1960s and reached its peak in the mid-1970s was primarily due to the more frequent births of second children, whose share increased from 30% to 40% between 1965 and 1975. In addition, advancement of second births due to policy measures in 1973 could contribute to the increasing share of second births. The drop of the 1990s is primarily attributable to the decreasing rate of second children, while the slow increase of fertility in recent years is largely due to the increasing rate of first children. It seems that the socio-economic change of the last fifteen years had less influence on third or higher-order children. Their share rose from 15% to 24% between 1980 and 1994; it soon decreased again, but their present share is still slightly higher than it was at the beginning of the 1990s.
Figure 5: Fraction of period total fertility rate contributed by birth orders
0 10 20 30 40 50
1961 1966 1971 1976 1981 1986 1991 1996 2001 2006
P
e
rc
en
t
o
f
to
ta
l
fe
rt
il
it
y
1. 2. 3. 4.+
Source: Authors’ computation based on vital statistics data, Demographic Yearbooks HCSO.
The picture is more nuanced when we look at parity progression ratios (PPRs) by birth cohorts. We are able to examine PPRs and completed fertility for the cohorts born between 1918 and 1965. The probability of the birth of a first child for childless
women, a0, shows a slow but constant increase, and surpasses 0.9 for each cohort born
The probability of a second child’s birth, a1, starts to rise dynamically among generations born after the Second World War, and its value reaches a maximum of close to 0.8 among cohorts born after 1950. These generations gave birth to their children mostly during the 1970s and 1980s, the period when the two-child family model became the norm. The probability of the birth of higher-order children had rapidly decreased among women born in the 1920s–1940s. Then, after a period of stagnation, a slow but steady rise in higher-order birth rates was seen among cohorts born in the second half of the 1950s and the first half of the 1960s. Thus, the previous decreasing trend of completed cohort fertility came to a halt and rose slightly among these generations because a0 and a1 were relatively high and stable, and because the third- and fourth-birth progression rates were rising (Figure 6).
Figure 6: Parity progression ratios among women cohorts born in 1918–1965
0 0.1 0.2 0.3 0.4 0.5 0.6 0.7 0.8 0.9 1
1918 1923 1928 1933 1938 1943 1948 1953 1958 1963 Year
P
ar
it
y
p
ro
g
re
ss
io
n
r
at
io
a0 a1 a2 a3 a4
Source: Authors’ computation based on census and fertility data. PPRs: Census 1970 (for birth cohorts 1918–1921); Fertility database (for birth cohort 1921–1965).KSH 2006a.
case of generations born in the 1970s. Essentially, the change indicates that the two-child family loses part of its previous hegemony, the proportion of two-childless and one-child families increased significantly, and at the same time, the share of families with three or more children stabilises.
Figure 7: Percentage distribution of women by final number of children, women born in 1929–1965
Number of children
0 10 20 30 40 50 60
1929 1934 1939 1944 1949 1954 1959 1964
N
u
m
b
er
o
f
ch
il
d
re
n
e
v
e
r
b
o
rn
(
in
p
er
ce
n
t)
0 1 2 3 4+
Source: Authors’ computation based on fertility database. KSH, 1996, KSH, 2006.
2.5 Romany population
Future trends of fertility may become increasingly affected by the demographic behaviour of the Romany population, because their share in the population of Hungary
is growing dynamically.8 According to the estimates, in 2003, at the time of the second
representative Roma survey, 569,000 Romany lived in Hungary. Their age composition is considerably younger than that of the total Hungarian population (see Hablicsek, 2007). While 16.1% of the Hungarian population was under 15 years of age in 2003, the
8 It is necessary to mention that identification of the Roma ethnicity is not an easy task. No full consensus has
corresponding estimated figure was 34.1% in the Roma population. Besides censuses, Hablicsek used the above-mentioned Roma surveys and the HGGS for the projection of the Romany population and the description of their fertility behaviour. According to his estimates, total fertility rate was 3.12 in the Roma population between 1990 and 2000, and the available data indicated a declining tendency (it dropped from 3.29 to 3.00 during the 1990s). However, Hablicsek draws our attention to the fact that Romany fertility shows considerable regional variation. An analysis conducted by Durst tends to confirm these results: she describes in detail the situation of a “ghettoising” Roma community, in which the mean age at first childbirth has declined and childbearing propensity has increased due to the intensification of school segregation (Durst, 2006). Supposedly, the fertility of the Roma population is strongly connected to the circumstances of integration: integration into the non-Romany community involves the convergence of fertility practices, while segregation brings divergence.
2.6 Postponement or pattern change?
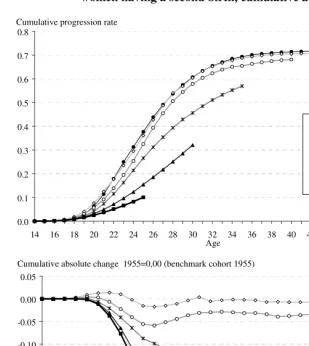
The fertility behaviours and practices of today’s young and middle-aged generations basically differ from those of their parents. The different childbearing strategies of the generations of parents and children become overt when comparing cohort age-specific fertility rates by parity. Their cumulated values indicate what proportion of women of different cohorts gave birth to their first, second, or third children up to a given age (Figures 8 and 9).
The most obvious trend is that there is no essential difference in the childbearing strategies of the generations born between 1955 and 1965. Women of these cohorts gave birth to first and second children at high rates and at young ages: by the age of 30, 80% of them had given birth to their first child, and 60% of them had had their second child. There is no significant difference in the average number of children they had at age 40. Women born in 1970 and thereafter began to give birth to their first and second children at later ages, and were making up for lost time when they reached their late twenties and thirties. The extent of this ‘recuperation’ largely depends on fertility trends in the upcoming years.
Figure 8: Cumulative first births per woman and cumulative absolute change by age, selected birth cohort (benchmark cohort 1955) (Proportion of women having a first birth, cumulative absolute change)
0 0.1 0.2 0.3 0.4 0.5 0.6 0.7 0.8 0.9 1
14 16 18 20 22 24 26 28 30 32 34 36 38 40 42 44 46 48
Age
1955 1960 1965 1970 1975 1980 Cumulative progression rate
-0.5 -0.4 -0.3 -0.2 -0.1 0.0 0.1
14 16 18 20 22 24 26 28 30 32 34 36 38 40 42 44
Cumulative absolute change 1955=0,00 (benchmark cohort 1955)
Age
1960 1965 1970 1975 1980
Figure 9: Cumulative second births per woman and cumulative absolute change by age, selected birth cohort (benchmark cohort 1955) (Proportion of women having a second birth, cumulative absolute change)
0.0 0.1 0.2 0.3 0.4 0.5 0.6 0.7 0.8
14 16 18 20 22 24 26 28 30 32 34 36 38 40 42 44 46 48
Age
1955 1960
1965 1970 1975
1980 Cumulative progression rate
-0.35 -0.30 -0.25 -0.20 -0.15 -0.10 -0.05 0.00 0.05
14 16 18 20 22 24 26 28 30 32 34 36 38 40 42 44
Cumulative absolute change 1955=0,00 (benchmark cohort 1955)
Age
1960
1965
1970
1975
1980
still a very significant difference in the rates of first and second births, not to mention a sizeable decrease compared to the “benchmark” generation born in 1955. The younger the generation, the more it lags behind the reference cohort in the number of children at younger ages. This may be seen as birth postponement, and a full recuperation of postponed births is not yet out of the question, but the extent of the lag is so great that it hints at an intentional or unintentional decline in completed cohort fertility.
3. Birth control
At the beginning of the 20th century, a Hungarian woman had an average of about 7.0 pregnancies during the course of her lifetime, whereas, in 2006, the period total pregnancy rate (PTPR) was only 2.24. Of this figure, live births amounted to 1.35, induced abortion to 0.65, and 0.24 was attributable to other foetal loss. The practice of induced abortion and contraception played an ever-changing role in fuelling the decrease in the number of pregnancies and the termination of unwanted pregnancies.
3.1 Induced abortion
In Hungary, the 50-year-old history of the authorisation of induced abortion is characterised by diverse regulatory practices, from strict prohibition to total liberalisation. A strict ban on abortion took effect in 1953 and the participating physicians and midwives were sent to prison. This abortion ban aimed at halting the decrease in births that began in the early 1950s. However, from 1956, a totally liberalised practice was introduced, which was based on the Soviet example and permitted abortion practically without limitations, upon demand. As one element of the population-related measures of 1973, the authorisation process was re-introduced: a committee made the decision, taking into consideration the age, family status, number of children, social and financial circumstances, and health of the woman. The Foetus Protection Act of 1992 introduced a legal provision to the authorisation process, which had previously been regulated by a ministerial decree. According to this law, which is still in effect, permission is granted only if the health of the mother or the foetus is in danger, if the pregnancy is the result of criminal act, or if the woman is in a severe crisis situation. This regulation did not, however, modify access to abortion in practice. At present, a severe crisis situation is named as the reason for an abortion in 96%–98% of cases.
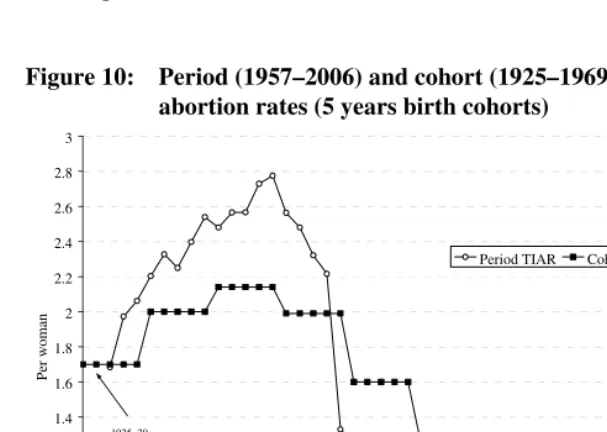
abortion rate (PTIAR) reached its maximum with 2.78 at the end of the 1960s. The subsequent decrease was partly attributable to the introduction and a rapid spread of modern birth control pills that appeared in Hungary at the end of the 1960s. The 40% drop in 1974 is mostly due to population-related measures coming into effect, which, besides reintroducing the authorization of induced abortions, included several measures to encourage childbirth, further expanded the availability of modern birth control pills, and made the conditions of access easier. The value of PTIAR reached a low of 1.03 at the beginning of the 1980s, and then started to increase again. The introduction of the Foetus Protection Act brought an almost 15% decrease in 1993, and a further 40% drop took place over the next 10 years. As a result, PTIAR per one woman was 0.64 in 2006 (Figure 10).
The induced abortion practice of particular cohorts can be tracked until the end of their fertile life periods for generations born between 1925 and 1964, and, in the case of younger cohorts, until the age reached on January 1, 2007. The results indicate that the highest number of abortions was carried out during the lives of generations born between 1935 and 1944. During the period of strict abortion prohibition in 1953–1955, these generations were too young to be influenced by the ban; however, they were at the zenith of their childbearing age during the time of free abortion choice. Due to the lack of modern contraceptive methods, induced abortion became the chief means of birth control. Consequently, these cohorts had more abortions than live births. A clear decreasing trend may only be perceived among generations born after the Second World War. The value of the cohort total induced abortion rate (CTIAR) decreased continuously, albeit unevenly, among cohorts born after the second half of the 1940s. All in all, the value of CTIAR dropped to nearly one-third, from 2.14 to 0.74, among cohorts born between 1935 and 1965.
The decrease of cohort abortion rates is primarily due to the drop in the rate of repeated induced abortions. The ratio of women having two or more abortions decreased from 50% to 21% among cohorts born between 1935 and 1965.
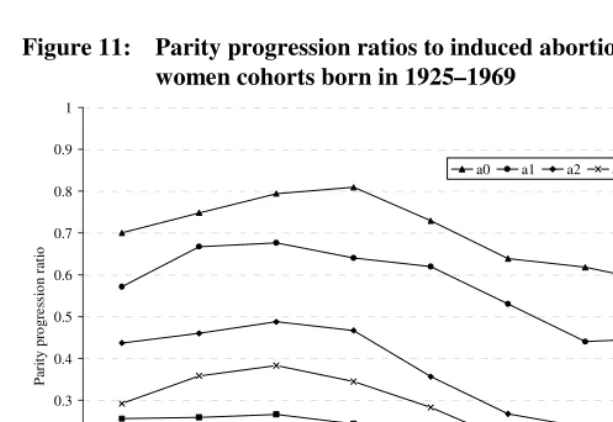
The trends of parity progression ratios for induced abortion demonstrate that the
value of a0 rose above 0.8 for the cohorts born during the Second World War, and then
gradually decreased. The values of induced abortions at higher parity were highest among the cohorts born in the 1930s, and then markedly decreased. However, the downward trend slowed and then halted among cohorts born in the 1960s. This means that the ratio of women with repeated abortions was still high among these generations (Figure 11).
age-specific curve of 2006 shows a significant decrease in all age groups, compared to the rates of 1990 or 2000. The most noteworthy decline occurred among teenagers, who are most exposed to the harmful influences of induced abortions (Figure 12).
Figure 10: Period (1957–2006) and cohort (1925–1969) total induced abortion rates (5 years birth cohorts)
0.6 0.8 1 1.2 1.4 1.6 1.8 2 2.2 2.4 2.6 2.8 3
1955 1960 1965 1970 1975 1980 1985 1990 1995 2000 2005
P
er
w
o
m
an
Period TIAR Cohort TIAR
1925–29 cohorts
1955–59 cohorts
Source: Authors’ computation based on vital statistics data, Demographic Yearbooks HCSO. Cohort TIAR: Induced abortions HCSO 2000, for birth cohorts 1925–1954, and induced abortions HCSO 2007, for birth cohort 1955–1969
Figure 11: Parity progression ratios to induced abortions among women cohorts born in 1925–1969
0 0.1 0.2 0.3 0.4 0.5 0.6 0.7 0.8 0.9 1
1925–1929 1930–1934 1935–1939 1940–1944 1945–1949 1950–1954 1955–1959 1960–1964 1965–1969
P ar it y p ro g re ss io n r at io
a0 a1 a2 a3 a4
Source: Authors’ computation based on Induced abortions HCSO 2000, for birth cohorts 1925–1954, and Induced abortions HCSO 2007, for birth cohort 1955–1969.
Figure 12: Age-specific induced abortion rates, selected years
0 5 10 15 20 25 30 35 40 45 50 55 60
12 14 16 18 20 22 24 26 28 30 32 34 36 38 40 42 44 46 48 50 52 54 Age In d u ce d a b o rt io n r at e (p er 1 0 0 0 w o m en ) 1975 1990 2000 2006
3.2 Contraception
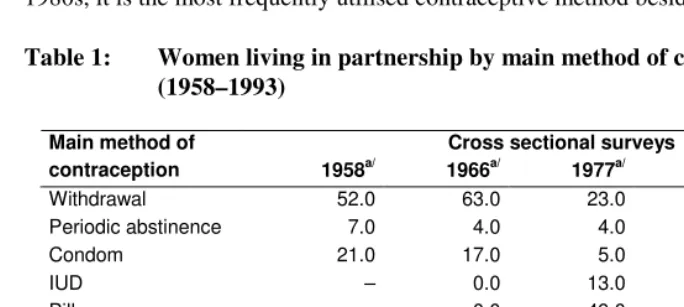
Using various types of representative surveys, the birth control practices of Hungarian women may be traced from the end of the 1950s. In this period, effective contraception was not accessible; therefore the 1950s and 1960s are characterised by the dominance of traditional means of birth control, especially coitus interruptus. A significant change took place in the second part of the 1960s, when the first oral contraceptive pills were introduced. Their use spread rapidly, and the selection also expanded from the 1970s. Starting in the first half of 1980s, six types of oral contraceptives were accessible. The use of intrauterine devices accelerated from the mid-1970s onwards, and since the 1980s, it is the most frequently utilised contraceptive method besides the pill (Table 1).
Table 1: Women living in partnership by main method of contraception (1958–1993)
Cross sectional surveys Main method of
contraception 1958a/ 1966a/ 1977a/ 1986a/ 1993b/
Withdrawal 52.0 63.0 23.0 11.0 8.0
Periodic abstinence 7.0 4.0 4.0 3.0 3.0
Condom 21.0 17.0 5.0 5.0 11.0
IUD – 0.0 13.0 26.0 24.0
Pill – 0.0 49.0 54.0 52.0
Other methods 20.0 16.0 6.0 1.0 2.0
Total 100.0 100.0 100.0 100.0 100.0
Of 100 women
Users 59.0 67.0 72.0 73.0 73.0
Non users 41.0 33.0 28.0 27.0 27.0
Source: Fertility differentials, family planning practice and birth control behaviours 1966–1986 HCSO 1989, FFS Survey Standard Country Report Hungary UN 1999.
a/ Married women aged 15–39 years. b/ Women living in partnership aged 18–41 years.
also low. The majority of young women who use no contraception methods are pregnant or want to have a child; however, the ratio of infecund women increases at higher reproductive ages. Contraceptive sterilisation is relatively rare in Hungary, and it has been permitted only above a certain age and number of children. Under a new law introduced in 2007, women over age 18 would have the constitutional right to use contraceptive sterilisation.
4. Fundamental changes in partnership relations
In recent decades, fundamental changes have taken place in partnership relations: cohabitation has become widespread, the popularity of marriage has decreased, and timing of partnerships and marriage over the life course, as well as the dissolubility of partnerships, have changed. Almost no aspect of partnerships has remained intact. (see Carlson–Klinger, 1987; Csernák, 1992; Bukodi 2004, Spéder, 2005). Most of these changes may be strongly connected to the social-economic transformation that started in 1989–1990. At the same time, it is apparent that several processes, albeit with moderate dynamics, were present prior to political changes (see Hoem et al., 2007 Spéder, 2006). Furthermore, the spread of divorce – which Lesthaeghe regarded as one of the key indicators of the new demographic transition (Lesthaeghe, 1996) – took off in the 1960s, and it has continued until now. Without a more profound analysis of causes and consequences, we may assert that changes in partnership are strongly associated with fertility relations (see also below).
4.1 Development of marriages
Figure 13: Total female first marriage rate, 1960–2006
0.4 0.5 0.6 0.7 0.8 0.9 1.0 1.1
1960 1965 1970 1975 1980 1985 1990 1995 2000 2005
T
o
ta
l
fi
rs
t
m
ar
ri
ag
e
r
at
e
Source: Vital statistics data, Demographic Yearbooks HCSO.
The mean age at first marriage showed a high degree of stability before the change in the political system. Women married for the first time at the age of 21–22, while men married at age 24–25. This age started to increase at the beginning of regime change (1990) and has kept rising until today; it rose by five years among both women and men over 15 years (Figure 14). In the process of postponement, which is demonstrated by age-specific first marriage rates (Figure 15), the shift of the first marriage to a later age plays a significant role in fuelling both the decline in the commonly used period TFMR due to ‘tempo distortions’ and leading to an overall lower marriage intensity. It can be seen that first marriages were generally contracted around the age of 22 under socialism, and at the age of 27–28 in recent years. Our figure unambiguously demonstrates the drop in marriages.
Figure 14: Mean age at first marriage (MAFM), 1970–2006
20 21 22 23 24 25 26 27 28 29 30
1970 1975 1980 1985 1990 1995 2000 2005
Year of marriage
M
ea
n
a
g
e
(i
n
y
ea
rs
)
Male Female
Source: Vital statistics data, Demographic Yearbooks HCSO.
Figure 15 Age-specific first marriage rates for women, 1960–2006
0.00 0.02 0.04 0.06 0.08 0.10 0.12 0.14 0.16
14 16 18 20 22 24 26 28 30 32 34 36 38 40
F
ir
st
m
ar
ri
ag
e
ra
te
1960 1970 1980 1990 2000 2006
Source: Vital statistics data, Demographic Yearbooks HCSO.
4.2 The spread of cohabitation
The expansion of cohabitation played the crucial role in the pluralisation of partnership relations. Heuveline and Timberlake’s (2004) comparative study illustrated that cohabitation takes diverse forms. From these, we highlight “cohabitation as first partnership,” and cohabitation after the dissolution of marriage or divorce as being most prevalent. In Hungary, historically, the latter partnership form appeared first, and the new type of partnership that precedes or/and substitutes marriage became significant later.
4.2.1 The spread of cohabitation
Carlson and Klinger (1987) demonstrated that there are numerous Hungarian peculiarities concerning non-marital cohabitation. The authors examined the spread of cohabitation, and compared Hungarian and international data at three points in time (in 1970, 1980, and 1984). They concluded that widows and divorced women were twice as likely to live in cohabitation as unmarried women. In other words, this life style was usually associated with a later section of the life course in Hungary, in contrast with
Western Europe. The mean source of the spread of cohabitation in Hungary was new
partnerships after divorce: in 1970, about one-tenth of divorced (and widowed) women aged 15–49, and only one out of 50 unmarried women, lived in cohabitation (Csernák, 1992: 36). The ratio of divorced and widowed women who live in cohabitation has continuously increased until today (in 2005, 29.6% of divorced women and 19.3% of widows aged 15–49 lived in cohabitation). However, in the recent past, unmarried women—or, more precisely, single women in their first cohabitation—have started playing the most important role in the spread of cohabitation.
4.2.2 First partnership: marriage or cohabitation
The distribution of first partnerships between marriage and cohabitation clearly
demonstrates the dynamics of the spread of the “new type” of cohabitation (Figure 16). It is obvious that cohabitation as the first partnership had already shifted from marginal
to important before the change of political regime. At the beginning of the 1980s,
Figure 16: Type of first partnership by the year of partnership formation
0 10 20 30 40 50 60 70 80 90 100
1960–1964 1965–1969 1970–1974 1975–1979 1980–1984 1985–1989 1990–1994 1995–1999 2000–2004
D
is
tr
ib
u
ti
o
n
o
f
fi
rs
t
p
ar
tn
er
sh
ip
s
(i
n
p
er
ce
n
t)
Marriage Cohabitation
Source: Own calculations, “Turning points of the life-course” 1st and 2nd wave, Demographic Research Institute, 2001–2005.
Significant proportions of those who established their first partnership as cohabitation later transform the arrangement into marriage. The intensity of this process, however, declines slightly with time. While 54% of cohabitations as first partnership ended up in marriage within five years at the beginning of the 1980s, the comparative figure was 47% at the end of the 1990s. Although cohabitations that precede marriage continue to make up a significant proportion of unmarried relationships, a gradual shift towards cohabitations that are not transformed into marriage may be observed.
If we examine the development of first partnerships by cohorts of women, we can
also see that the ratio of those not partnered until a given age (e.g., age 25) increased among women born at the turn of the 1970s, and continued to rise among younger
cohorts (Spéder 2006). Based on these findings, we may conclude that postponement is
also characteristic for the timing of the first partnership.
4.2.3 Some characteristics of the spread of cohabitations
were established regarding the spread and structural embeddedness of cohabitations. One of them asserts that cohabitation, in a way that is similar to the diffusion pattern of fashion trends, expands downwards from the top of the social hierarchy to groups at the lower end of the social scale (‘graduates as trendsetters’). An alternative assumption, which is primarily based on the results of research carried out in the US (Bumpass–Lu 2000; Cherlin 1992), posits that cohabitation as first union is mostly preferred among blue-collar workers, rather than among groups with higher education (‘working class phenomenon’).
The results of testing the above-mentioned alternative assumption in Hungary
revealed that the second hypothesis is more characteristic of the Hungarian situation9. It
is sufficiently demonstrated if we examine the share of cohabitations as first partnership within different cohorts by education level (see Figure 17). Starting from the oldest cohort, the rate of starting the partnership life course with cohabitation is highest (exceeding 50%), and becomes dominant, among those with the lowest schooling. The only exception is the youngest cohort, born between 1972 and 1976, among whom there are hardly any differences regarding education level.
Figure 17: The ratio of woman choosing cohabitation as first union until age 25 in relation to those entering any kind of union by birth cohorts and level of education (%)
0 10 20 30 40 50 60 70
1952–1956 1957–1961 1962–1966 1967–1971 1972–1976 Birth cohorts
P
er
ce
n
t
ch
o
o
si
n
g
c
o
h
ib
a
ti
o
n
Lower Vocational school Secondary school Higher
Source: Own calculations, HGGS ‘Turning Points of the Life-Course’ 1st and 2nd wave, HCSO DRI, 2001–2005.
At the same time, the spread of cohabitation has recently been most dynamic among those with higher education. While the ratio of cohabitations to all first unions among highly educated women was only 8% among those born between 1957 and 1961, this figure was 25%, 41.1%, and 61.1% among the subsequent five-year cohorts, respectively. Thus, the diffusion of cohabitation as a life style and as a pattern started in the lower social group, and then accelerated on both poles of the social hierarchy. Those in the middle adjusted themselves to the trend with delay.
Bukodi’s detailed investigations of the choice between cohabitation and marriage as a first union identified two crucial factors (Bukodi, 2004: 157ff.). The socialization
hypothesis − i.e., people whose parents are divorced are more inclined to choose
cohabitation as a first union− confirm our findings. Her second conclusion, that
cohabitation is preferred by people with insecure labor market status (occasional jobs, fixed term contracts) or by those who study and work at the same time, does not fully support our findings.
4.3 Childbirth propensity in marriage and cohabitation
Currently we have no comprehensive understanding of the connection between new partnership practices and fertility; i.e., of whether the fertility of those living in lasting cohabitation, of those starting with cohabitation and then getting married, and of people who marry directly, differs or converges. We can, however, reflect upon one aspect of this issue: the degree to which childbearing among those choosing marriage or cohabitation as first union differs in the first five years, and whether or not this practice has changed. We analyse whether the first child was born during this period.
Nine out of 10 of those marrying directly give birth to their first child within five
years (Table 2). This ratio was stable for many years; however, it started to decrease in the 1990s: the corresponding figure is only 80% among partnerships that started as marriage at the beginning of the 1990s, and only 77.8% among partnerships that started as marriage at the end of 1990s. Apparently, the practice of childbearing has also been altered also in the traditional partnership form.
partnership, are less likely to have children within a fixed period of five years than in the previous decades.
It is obvious that the development of fertility is strongly related to the development of partnerships. We know that the establishment of partnerships and childbearing behaviour are mutually depend on each other, but some further distinctions could be made. It appears to be the case that particular partnership types carry different levels of fertility potential: people cohabiting as a first union are less likely to enter parenthood within a certain time period than those choosing marriage as a first union. Therefore, the fact that today more people start their partnerships with cohabitation has a large effect on fertility trends among the total population. However, declines in childbearing propensity within particular partnership types contribute independently to this development, as well.
Table 2: Share of births within five years from the establishment of the first partnership, by period and type of first union
Type of first union Period of first partnership
formation Marriage Cohabitation
1970–1974 89.5 (78.9)
1975–1979 91.5 (81.8)
1980–1984 90.1 60.5
1985–1989 89.5 68.8
1990–1994 83.9 64.5
1995–1999 77.3 47.5
Source: Own calculations, HGGS ‘Turning Points of the Life-Course’ 1st and 2nd wave, HCSO DRI, 2001–2005.
Note: ( ): Number of cases between 50 and 100.
4.4 Extramarital births
thereafter (Figure 18). The increase was accelerated after the change of political regime. In 2006, non-marital fertility constituted 37% of the PTFR.
There are, however, clear differences in the ratio of extramarital births by birth order: the ratio is, for example, highest among first and fourth and higher order births. Whereas before the political transformation the ratio of non-marital fourth and higher order births was at least two times higher than among any other birth order, in recent years, the difference between first and fourth and higher order births has diminished.
Figure 18: Proportion of extramarital births by birth order 1970–2006
0 5 10 15 20 25 30 35 40
1970 1975 1980 1985 1990 1995 2000 2005
P
e
rc
e
n
t
ex
tr
am
ar
it
a
l
b
ir
th
s
1. 2. 3. 4.+ Total
Source: Vital statistics data, Demographic Yearbooks HCSO.
The HGGS survey makes it possible to depict the partnership context at the birth
of the child and examine its temporal development10. Three partnership contexts can be
differentiated: marriage, cohabitation, and living alone without partnership. On the basis of this survey, we can conclude that the increase in extramarital births is basically due to the fast diffusion of childbirth in cohabitation. While, according to our data, 2%– 3% of first births took place in cohabitation at the turn of the 1970s and the 1980s, and the share single mothers was twice as high (see Figure 19); the corresponding ratio rose to 17.5% at the end of the 1990s, and reached 21.4% at the beginning of the new millennium. At the same time, the ratio of lone parents increased, as well, rising from around 2%–3% prior to the change of regime, to around 10% later. As mentioned previously, fewer higher order children are born in cohabitation: before the change of regime, 95% of second order children were born in marriage, and half of parents of the remaining 5% lived in cohabitation or alone. The situation changed at the millennium: the majority of the 15% extramarital second order children were born in cohabitation.
Figure 19: Distribution of first births by partnership status of the mother, 1965– 2004
0 10 20 30 40 50 60 70 80 90 100
1965–69 1970–74 1975–79 1980–84 1985–89 1990–94 1995–99 2000–04 Birth period of children
D
is
tr
ib
u
ti
o
n
o
f
fi
rs
t
b
ir
th
s
(i
n
p
er
ce
n
t)
Marriage Cohabitation Alone
Source: Own calculations, HGGS ‘Turning Points of the Life-Course’ 1st and 2nd wave, HCSO DRI, 2001–2005.
According to our analysis, non-marital childbearing is linked to specific social-demographic features and situations: we shall emphasise the very young and late ages at childbirth, and being at parity 0. Also, people with lower levels of education, those belonging to the Romany minority, and the non-religious tend to prefer extramarital births (Spéder, 2004). It should be noted that, while people with higher levels of education play a crucial role in the spread of cohabitation, the frequency of childbearing in cohabitation is significantly lower among them than for the total population. Thus, the spread of extramarital births does not follow the diffusion of a “fashion,” as it does not expand top-down; rather, it diffuses by “leaking up from below.”
4.5 Divorce, stability of partnerships
At the time of the universality of marriage, the analysis of partnership dissolution was limited to divorce. As cohabitation widely proliferates, separations among cohabiting partners also have to be examined. The aggregate consequence of partnership dissolution for fertility is not clear-cut. Divorce and separation obviously mean a break in the previous fertility career and may therefore be accompanied by lower completed fertility. However, many divorced and separated individuals seek to seal their new partnership with a common childbirth, and this may eventually contribute to rising completed fertility among women (see Billari, 2005).
4.5.1 Development of divorce
The total divorce rate provides a comprehensive view of the chances that marriages will remain stable and not break up too early (see Figure 20). The phenomenon of divorce
has been known in Hungarian society throughout the 20th century, but divorce was only
“peripheral” until the 1960s (Lıcsei, 1971; Csernák, 1996). According to Lıcsei, its
spread and expansion is related to forced industrialisation and the comprehensive political programme restructuring all dimensions of social life (Lıcsei, 1971). The
Figure 20: Total divorce rate, 1960–2006
0.00 0.05 0.10 0.15 0.20 0.25 0.30 0.35 0.40 0.45 0.50
1960 1965 1970 1975 1980 1985 1990 1995 2000 2005
T
o
ta
l
d
iv
o
rc
e
r
a
te
Source: Vital statistics data, Demographic Yearbooks HCSO.
4.5.2 Dynamics of the dissolution of first partnerships
Using survey data broken down by cohorts, we may examine the stability of first
partnerships, including the stability of first cohabitations. It also makes the analysis of tendencies and comparisons possible if we examine the first union within five years (60 months) after its onset, and determine whether or not it terminated during this period. This indicator could be calculated in each partnership cohort for partnerships starting both as marriages and as cohabitations (see Table 3). According to HGGS data, the likelihood of partnership dissolution unambiguously increased during the last two decades of the twentieth century. While less than one-tenth of first unions formed in the 1970s broke up within five years, the corresponding ratio exceeded 10% for unions formed in the 1980s, and it reached 21.5% for those started at the end of the 1990s.
Numerous analyses detect strong relationships between partnership status and childbirth propensity. Without analysing the relationship of causes and consequences, it may be assumed that the increasing instability of partnerships played a role in the decrease in fertility after the change of political regime.
Table 3: Partnership status 60 months after the establishment of first partnership
Date of establishment of first partnership
Partnership state 1965–1969 1970–1974 1975–1979 1980–1984 1985–1989 1990–1994 1995–1999
60 months after the first partnership
Continuous partnership 92.3 91.3 90.9 87.5 87.0 82.8 78.5
Dissolved partnership 7.7 8.7 9.1 12.5 13.0 17.2 21.5
60 months after marriage as first union
Lives in marriage 93.7 92.7 92.7 90.2 91.4 88.2 91.8
Divorced 6.3 7.3 7.3 9.8 8.6 11.8 8.2
60 months after cohabitation as first union Lives in the same
partnership – (75.0)* 78.9 77.0 78.3 75.9 69.7
Dissolved cohabitation – (25.0) 21.1 23.0 21.7 24.1 30.3
Source: Own calculations, HGGS ‘Turning Points of the Life-Course’ 1st and 2nd wave, HCSO DRI, 2001–2005.
Note: *N=96.
5. Social, structural and institutional environment for childbearing
It is not unusual to assign an outstanding role to socio-economic conditions in the
development of fertility. For example, Macura and his colleagues elaborated the “crisis
hypothesis” as an explanation for fertility decline (Macura et al., 2000), and they attributed central importance to lower economic performance, growing inequalities, the spread of unemployment, and the resulting general loss of security.
In order to understand fertility decision making within a structural context, we must examine systematically the factors that structure the entry into adulthood and family formation. Among these factors are the following: a) the system of education; b) the working of the labour market; c) access to housing, i.e., the housing market, state home construction, and financing; d) the development of income level and changes in income inequalities; and e) child-related welfare programs. As relatively little relevant research has been conducted on the relationships between the previously mentioned aspects and childbearing, we have to limit the discussion of the above factors to three areas. In the following, we will discuss the possible effects of the system of education and labour market. The relevant welfare programs will be described and evaluated at Section 7.
5.1 Education
It is well known that childbearing and being a full-time student involve practically irreconcilable role expectations (Blossfeld, Huinik, 1991); thus, childbearing decisions are usually made after studies have been completed. Otherwise, one practically has to reckon with the interruption of the student career11. The limited capacities of the educational system frequently affect the life course of young adults, as capacity limits may imply an interruption in their progression to acquiring education and entering the
labour market. Since higher education plays the key role in infertility postponement, we
summarise the main changes to this system here.
During the socialist era, before 1990, state-specified higher education capacities determined the percentage of secondary school graduates who went on to higher education, and the number of potential university or college students within one cohort. This rate was about 10% of all cohorts during socialism. At the beginning of the period under investigation, men preferred to study longer and at a higher level than women. But, with the spread of female employment, the education participation of both genders gradually became balanced, until finally female participation exceeded that of men in the 1980s. The drop in male participation was basically due to the deterioration of the relative income position of graduates in the 1980s (Andorka, 1997).
After the change of political regime, due to capacity extension and increased demand for higher education, participation in higher education rose to unprecedented levels within a short time period. According to HCSO data, close to one-half of 20-year-olds are full-time students (see Figure 21).
Figure 21: Ratio of full time students at age 20, 1991–2006
0 5 10 15 20 25 30 35 40 45 50
1991 1993 1995 1997 1999 2001 2003 2005
P
er
ce
n
t
fu
ll
-t
im
e
st
u
d
en
ts
Source: Educational statistics, HCSO.
It is also noteworthy that full-time education involves the 20–24-year-old
generation, who used to be the most active in childbearing during communism. Evening
5.2 Labour market12
Before analysing the possible effects of the labor market on fertility, we briefly outline an interpretation framework that, in our opinion, may help us to understand better the relationship between fertility and labour market and their changes in former communist countries.
5.2.1 Interpretation framework: the effects of political transition from the perspective of market dis-equilibrium theory
The labour market works as an allocation mechanism in both capitalism and state socialism; however, its state differs under these two systems, according to the market theory of disequilibrium (Kornai, 1972; 1980). Its functioning was qualitatively different in the redistributive socialist mixed economy, which is based on state property, and in the market economy, which is based on private property. The theory assumes that all types of markets lack equilibrium in demand and supply. According to the analyses of Kornai, the labour market of the market economy is characterised by “over-supply” and “under-demand” for labour, whereas the labour market of the socialist economy suffers from “over-demand” and “under-supply.” The power of employers is stronger in the private property-based labour market of “over-supply,” which allows them to choose among potential employees. By contrast, the employee is in a more advantageous position in the state property-based labour market of “over-demand” (“employers seek the favour of employees”). For this reason, employers dictate in the former case, setting the conditions of employment and choosing among potential employees according to their wishes and needs. In the latter case, it is easy for employees to obtain or squeeze out concessions (Kornai, 1980: Chapter 7).
The political regime change in the 1990s therefore led to a qualitative and a quantitative change in the labour market at the same time. It was already an almost impossible task for employees to defend and keep their positions under the circumstances of narrowing job supply (quantitative character). At the same time, the power relations that controlled working conditions were also reorganised, with the direct consequence that many employees became exposed at their workplaces (qualitative character). They were less able to partake in the determination of their working hours, the utilisation of their working time became much more intensive, and
12 The role of the labour market −both from a theoretical perspective and based on empirical evidence− was
their employers became less willing to take their individual (family) interests into consideration (see Zsille, 1993 [1980]: 225ff).
The transformation of the labour market that we have outlined above may also have far-reaching consequences on childbearing behaviour, especially on the reconciliation of work and family. With their formerly advantaged situation turned into defencelessness, the ability of employees to advocate for their interests beyond raising income, including balancing their family and parental roles with their responsibilities as
employees, was reduced. That is to say, it was presumably much more difficult to
reconcile family and work given the labour market conditions of the 1990s than in the state property-based redistributive shortage economy of the 1980s. More precisely: in reconciling the claims of family and work, the considerations of the former were much less likely to prevail. Therefore, employees who were able to enforce their individual interests within certain limits in shortage economy found themselves defenceless, and
their bargaining position much weaker, in a market economy13. One of the
manifestations of this change is that, while company crèches and kindergartens were built during the period of state-socialism in order to create advantageous working conditions for female employees, companies strove to dispose of these responsibilities and institutions after the change of political regime.
5.2.2 Development of female employment
Extensive industrialisation began with the establishment of the state socialist regime (at the end of the 1940s), resulting in huge labour force demand and rapidly increasing female participation in the labour market. In 1949, 34.6% of 15-54-year-old women were employed; 10 years later, in 1960, 49.9% of this group were full-time employees. In 1970, 63.7% of women aged 15-54 had gainful employment. By the 1980s, female employment became practically universal (about 80%), approaching the employment rate of men (Fóti, Lakatos 1998).
The transformation of the economic system following the change of political regime was conveyed to the people via the labour market. The tightening of the labour market started in 1992 and lasted until 1996-1997, with the number of employees decreasing by approximately one million during this period. Later, employment levels began to rise, and have changed only minimally since 2000. The unemployment rate among women fluctuated at around 10% between 1992 and 1996 (with the highest value of 12.1% in 1993), and then decreased. It was 6.4% in 2000 and 7.2% in 2005 (KSH, 2007c:23p.).
13 Their position is even weaker than that of their Western colleagues, since the trade union movement is