0 INTRODUCTION
Reading medical images is one of the key diagnostic methods of modern medicine. The information deduced from these images is essential for the detection and understanding of pathological conditions. Automatic extraction, analysis and understanding of the visual content consist of many image processing operations. The most used are image acquisition, segmentation, compression, registration and quantitative analyses [1]. Enduring research in medical image processing is important for the improvement of existing analyses of medical images, which leads to better medical care.
Imaging revolutionized medicine. The imaging revolution started with the invention of X-rays. Ultrasound diagnostics followed. Progress in computer technologies provided the means for the invention of computerised tomography (CT). Research in physics resulted in magnetic resonance imaging (MRI) [2]. Auto fluorescence bronchoscopy (AFB) completes the set of modern non-invasive technologies for medical imaging.
The information content of colour medical images is richer than the information content of black and white images. Efficient image analysis implies the use of colour images whenever applicable (e.g., X-ray imaging produces only different levels of grey).
The information of a colour image resides in a specific colour space (e.g., red-green-blue (RGB) or hue-saturation-value (HSV)). Colour features of the image are distinguished by their sensitivity to the scene illumination and spectral distribution of light wavelengths and by human perception [3].
Conversions between different colour spaces are either linear or nonlinear. Spaces obtained by
nonlinear conversion can cause problems in pattern definition since colours in some areas easily have luminance and/or colour saturation that is too low in order for an effective readout to be possible. As a result, colour intensity can be used in pattern recognition processing [3].
The most important step in the segmentation of colour images is the definition of criteria and methods. Segmentation of colour images can be based on the analysis of pixel space features, homogeneity of adjacent pixels and physical properties of surfaces making the image and on edge detection between areas of different colours [3].
0.1 Auto Fluorescence Bronchoscopy Imaging
Bronchoscopy is one of the oldest methods of investigation in respiratory medicine [4]. A medical expert uses the method to determine the extent of pathological tissue changes. When the area is properly visualized and the consequential biopsy is carried out skillfully, it is usually possible to accurately state the diagnosis of the disease.
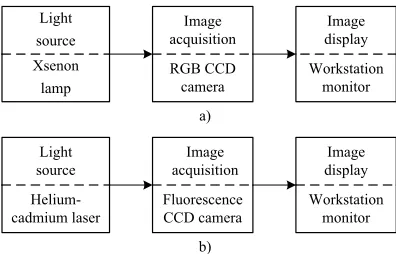
Using white light instead of blue makes detection of the earliest changes in bronchial mucosa more difficult, if not impossible (Fig. 1a). To improve the sensitivity of bronchoscopy performed with white-light illumination, the AFB [5] has been introduced. AFB relies on the fact that the deteriorated bronchial mucosa fluoresces less than the healthy mucosa when irradiated by the wavelength of about 440 nm. A helium-cadmium laser produces a blue light with the wavelength of 442 nm. Consequentially, it is used as a source of illumination in the AFB [6] (Fig. 1b).
Autofluorescence Bronchoscopy Image Processing
in the Selected Colour Spaces
Finkšt, T. – Tasič, J.F. – Terčelj-Zorman, M. – Zajc, M.
Tomaž Finkšt1,* – Jurij F. Tasič2 – Marjeta Terčelj-Zorman3 – Matej Zajc2
1 University of Ljubljana, Faculty of Mechanical Engineering, Slovenia
2 University of Ljubljana, Faculty of Electrical Engineering, Slovenia
3 University Medical Centre, Department of Pulmonary Diseases and Allergy, Slovenia
Reading diagnostic medical images usually requires the expertise of a specialist physician. To aid physicians we have developed an algorithm that deduces medical information by analysing colour nuances of an image obtained by bronchoscopy. The goal is to ensure a high probability of detecting bronchial cancer. Autofluorescent bronchoscopy images are analysed by the proposed algorithm. The machine-made diagnoses of early cancer stages are highly correlated with the diagnoses made by a medical expert. Reading the image using a specialized apparatus and producing a pre-diagnosis by image-recognition software and a special set of rules has the potential to produce automated second opinions for most cases of the disease.
There are several studies in the literature aiming at improving AFB sensitivity (sensitivity = number of true positives / (number of true positives + number of false negatives)) and specificity (specificity = number of true negatives / (number of true negatives + number of false positives)). To improve the diagnostics, the existing AFB techniques can be combined with other methods. Kusunoki et al. [6], Bard et al. [7], Zeng et al. [8] and Terčelj et al. [9] describe how the optical spectroscopy can add the information context to the AFB image-acquisition system. However, this approach involves the use of a spectrometer and prolongs the bronchoscopy procedure. Another approach used to improve the specificity of the AFB technique is presented by Goujon et al. [10] and Qu et al. [11] who employed off-line spectral image analysis and threshold algorithms to classify positive and false results, but with limited success.
0.2 Machine Supported AFB for a Teleconsultation
The diagnostic system that we use for image acquisition has been installed in a hospital specializing in the bronchoscopy examination. Our goal is to develop an image analysis system that can be used for tele-consultation by specialists [12].
In order to identify deteriorated, i.e., potentially cancerous areas of the bronchial mucosa, we use the image-processing method that finds edges of changed surfaces in the bronchoscopy image. Such surfaces can be quite small at the onset of the disease. The initial sensitivity set up for edge recognition is set by the operator. The algorithm then autonomously searches for the edges that define deteriorated surfaces, i.e., image segments. Poor initial setting can result in a significant error since the image segmentation algorithm involves iterative processing where inefficiencies are adding up.
In this paper we compare the impact of two colour spaces on the segmentation of the autofluorescence images. We evaluate the RGB and the HSV colour space [3]. We expect to get better results with the HSV space since it is closer to the human perception of colours than the RGB space that fits better to the properties of the imaging system hardware.
1 ACQUISITION OF THE AUTOFLUORESCENCE IMAGE
The set up for AFB [13] image acquisition is presented in Fig. 1. A combination of the selected light source, image acquisition apparatus and image display hardware characterize a particular AFB.
a) Xsenon
lamp Light source
RGB CCD camera
Image acquisition
Workstation monitor
Image display
b)
Helium-cadmium laser Light source
Fluorescence CCD camera
Image
acquisition displayImage Workstation
monitor
Fig. 1. Image-acquisition process in the bronchoscopy; a) white light, b) blue light and the autofluorescence mode
1.1 The LIFE System
The AFB images that we investigate were acquired by the light imaging fluorescence endoscope (LIFE), produced by Xillix Technology, Vancouver, with the resolution of 800×600 pixels for both white-light and autofluorescence mode.
The LIFE system consists of:
• Dual wavelength (red and green) camera with a
built-in amplifier.
• White-light colour RGB camera.
• Blue laser light source.
• White-light source.
• Switching mechanism to select a white or blue
light imaging mode.
• Imaging workstation, the suite of the AFB
imaging applications and a computer monitor. Both images (white-light and autofluorescence) are digitized simultaneously in real-time (i. e., at video rates of 30 frames/s) by the imaging board.
In the white-light imaging mode, an RGB camera is used to capture the reflected light. This image is digitized and displayed on the monitor. In both the fluorescence and white-light modes, the digital representation of the image is stored in the computer by taking a snapshot of the image.
appears green and the abnormal areas appear reddish-brown.
2 IMAGE PROCESSING FOR EDGE DETECTION
This section presents the algorithm, which defines the edges in the AFB image. To ensure the universality of the algorithm no assumption is made about the shapes of objects at the algorithm initialization, i.e., when setting up its’ segmentation stage.
The most common application in the field of digital image processing is the one which searches for specific shapes and patterns. The steps of this process are: image acquisition, removal of noise, image segmentation and image classification.
Different digital filters are used for noise removal. The result is an improved image histogram, which is needed for subsequent image processing.
The result of the image segmentation phase is image structuring, i.e., segmentation of the image into patterns, i.e., segments. Each segment is described by a set of features (centre of gravity, area, colour histogram and others).
The segmentation algorithm can be relatively complex since many threads can run simultaneously, each for its own region of the image. The patterns are correlated to the object of the model, which encapsulates the search rules and data on different search patterns. The result of the classification phase is confirmation or rejection of the search object presence.
2.1 Image Pre-Processing
The objective of the pre-processing phase is to properly prepare the image for further analysis. In the proposed approach, images are first adjusted by normalization of their colour histograms. Then, the image contrast is manipulated since the changes in the AFB images appear as nuances of brown-reddish colour.
The colour image is then transformed to a grey scale image for further processing [14]. Illumination of bronchia tissue with a blue light of 442 nm wavelength results in reflected light having wavelengths in red and green spectrum. It is the bio-chemical processes in the epitelium of the bronchia tissue that produce red and green reflection when illuminated with a blue light [6]. The level of grey in the grey image is defined as a quotient between intensities of red and green colours [5]. The gray image is analysed for groups of pixels with the same level of grey. The result of this phase is a histogram that presents sums of pixels for individual
levels of grey. We analyse the obtained histogram of grey level frequencies in each image.
Individual histograms are produced for each of the parameters that make the particular colour space (RGB and HSV). A colour filter is applied to produce an image with different intensities of the filtered parameter only. The resulting image is processed further by the same procedure as the grey scale image. The results of this phase are intensity histograms for each parameter of the selected colour space.
2.2 The Selected Colour Spaces
RGB and HSV colour spaces are used to study bronchoscopy and microscopy images [15]. Attributes of both colour spaces meet the requirements of the study. We processed the bronchoscopy images in both colour spaces.
2.2.1 Properties of the RGB Colour Space
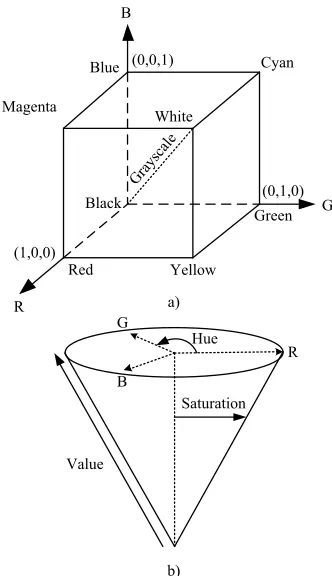
RGB colour space is a three dimensional space. Any point in this space is presented by the three linearly independent vectors that make the Cartesian coordinates, namely red (R), green (G) and blue (B). Fig. 2a presents the space and position of some colours in the space. Any colour is presented as a vector defined by a triple of the RGB intensities.
RGB intensities are calculated by the Eq. (1) to the Eq. (3) for each of the colours. Wavelengths are integrated from 300 to 830 nm [4]. S(λ) represents the illumination light. R(λ), G(λ) and B(λ) are RGB components of the light that reflects from the object. The three components of the reflected light are captured by sensors that are sensitive to each of the RGB colours only [2].
R=
∫
S( ) ( ) ,λ R λ λd 300830
(1)
G=
∫
S( ) ( ) ,λ G λ λd 300830
(2)
B=
∫
S( ) ( ) .λ B λ λd 300830
(3)
spectra. Such colours are perceived as a single colour since the human eye contains only three types of cone cells, i.e., colour receptors, which means that all colours are reduced to the three sensory quantities [3].
The RGB values depend on the spectrum of the light source and on the sensitivity of the capturing device. Differences in light sources and/or capturing devices can result in different triplets of values for the colour of the examined material. The RGB colour space is device dependent.
The use of the RGB space is convenient since images can be taken from capturing devices without transformation (RGB is the native space in the majority of the image oriented devices). Consequently, the RGB space is extensively used in current imaging systems; it is wide-spread in the image processing industry.
Hue
Value B G
R
Saturation
Magenta White
Cyan Blue
Black
Green
Yellow Red
a)
b) (1,0,0)
R
Grayscale (0,1,0) G (0,0,1)
B
Fig. 2. Colour spaces: a) an RGB colour space where vertices of the cube represent the primary colours, b) an HSV colour space in
the cylindrical coordinates
Reservations against the use of the RGB space are:
• Components of the space are highly correlated
when processing images with natural colours [3].
• The correlation between the perceived difference
of two colours and their distance in the Euclidian RGB space is low.
• In order to be identified, the objects have to
differ from the background to a higher extent than in some other colour spaces. Consequently, additional information is needed for effective processing.
• Changes of brightness and/or hue need a relatively
high amount of calculations.
• Image processing requires significant amounts
of computer memory since 256 levels of colour intensity result in 24 bits per pixel for the three colours of the space.
2.2.2 Properties of the HSV Colour Space
The most basic constraint in image processing is intuitive work with colours. For this purpose, properties of the colour space are to match human perception of colours to a high extent.
HSV, saturation-intensity (HSI) and hue-lightness-saturation (HLS) colour spaces were invented in order to achieve a high correlation between the attributes of the colour space and the human perception of colours. The common denominator of these spaces is the inclusion of the hue (H) and saturation (S) attributes [3].
The H attribute is about the perceived colour (e.g., blue, red); the S attribute distinguishes a vivid from a pale colour.
Value (V), intensity (I), and lightness (L) attributes are about brightness of the colour. A brighter colour has higher V, I, or L value.
The HSV colour space has a shape of a single cone; HLS and HSI are encapsulated into a shape of a double cone. The difference is due to the different definitions of brightness in the three colour spaces (Fig. 2b).
Human perception of hue is more subtle than perception of colour saturation and brightness [5]. Consequently, usually 6 bits are used for the H value; S and V values are defined with 5 bits each. Corresponding H, S, and V resolutions have 64, 32, and 32 steps. Only 16 bits (6+5+5) are needed for the pixel definition.
HSV, HLS and HIS are perceptually non uniform colour spaces. Consequently, these spaces or the RGB space are not used for the calculation of distances among different colours.
brightness are manipulated most easily since they are intrinsic parameters of the HSV space. Consequently, the HSV space is very useful in the image processing industry. Even though the HSV space was introduced after the invention of the RGB space it uses only 16 bits per pixel compared to 24 bits in the RGB space.
Computational effectiveness and small memory footprint make the HSV space the optimal choice when designing embedded systems for imaging applications. The use of embedded systems results in high processing speed, compared to running imaging programs on workstations, but limitations of the resources that build an embedded system [17] and [18] need to be dealt with.
Reservations against the use of the HSV space are:
• Conversions are needed since most image
oriented devices are designed for the RGB space.
• The HSV space is perceptionally non uniform.
• Sensitivity for non-saturated colours (close to
white and black) is perceptionally marginal.
• The hue parameter has singularity at H = 0 and
H= 255.
2.3 Segmentation
The images have been captured by the LIFE system in the RGB colour space. We mapped them to the HSV space. We designed the image segmentation process in line with the work of Cheng and Sun [19], who obtained the data for segmentation from study of the image histogram.
The steps of our segmentation process for images having colours in the RGB or HSV colour space are:
First, a Standard Deviation of colours in the vicinity of the individual Pixel (SDPij) is calculated by Eq. (4) [19].
SDP
d g
ij pq ij
q j d j d
p i d i d
= −
= − − + −
= − − + −
∑
∑
12
2
1 2 1 2
1 2 1 2
( µ ) , (4)
where d is distance of interest from the pixel (i,j),
gpq is the colour intensity attribute of a pixel Ppq at the location (p,q). μij is the mean of the grey levels within rectangular window around the pixel (i,j). μij is calculated by Eq. (5):
µij pq
q j d j d
p i d i d
d g
=
= − − + −
= − − + −
∑
∑
1
2
1 2 1 2
1 2 1 2
. (5)
Same as in Eg. (4), gpq represents the colour
intensity attribute of a pixel Ppq at the location (p,q). Based on the SDP the image is categorized into homogenous and non-homogeneous areas.
Secondly, colour histograms are calculated for each of the areas, defined in the first step. Based on the histogram data and on the pre-set threshold values, the areas are further divided into the sub areas.
Thirdly, a custom gauge on colour matching is used to merge the sub areas that meet the rule. The Euclidian distance between colours is a measure of the colour match.
Colour variability of the adjacent pixels is calculated with edge detecting operators. The Canny operator [14] is applied in the algorithm.
3 RESULTS
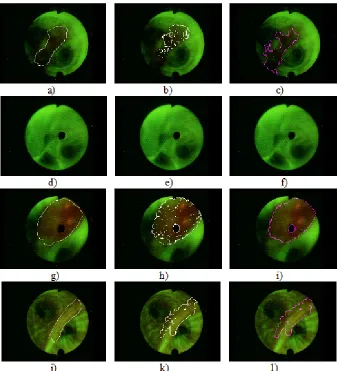
A medical doctor, a specialist in reading the bronchoscopy images, investigated 30 AFB images. He found no pathological changes in 5 images; in 25 images there were pathological changes to bronchial mucosa. The specialist marked the areas with changes.
Fig. 4 shows the manually segmented images: a), d), g), and j); images segmented in the RGB space: b), e), h), and k); and images segmented in the HSV space: c), f), i), and l).
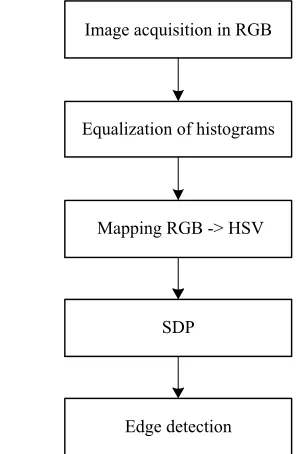
Image acquisition in RGB
Equalization of histograms
Mapping RGB -> HSV
SDP
Edge detection
Fig. 3. Segmentation algorithm in the RGB and HSV spaces
evaluation of the algorithm efficiency. Additional criteria need to be applied to underpin the evaluation of the algorithm [20]:
a) False positive (FP) is the percentage of pixels that are defined as pathological by the algorithm and not by the specialist.
b) False negative (FN) is the percentage of pixels that are defined as pathological by the specialist and not by the algorithm.
c) The relative-agreement index (Aagr) with a value
between 0 and 1, defined by Eq. (6):
A N
N N
agr
A A
A A
man alg
man alg
=
+
∩
2 . (6)
d) The relative-disagreement index (Adis) with a
value between 0 and 1, defined by Eg. (7):
A N N
N N
dis
A A A A
A A
man alg man alg
man alg
= −
+
∪ ∩
2 , (7)
where Aman is the area defined by the specialist, and Aalg is the area defined by the algorithm,
NAman∩Aalg is the number of pixels in the
cross-section of the two images and NAman∪Aalg is the
number of pixels in the union of the two images. Eq. (6) and (7) are in line with the work that is presented in [20].
Matching criteria (machine segmentation vs. specialists’ segmentation) for the 30 AFB images are presented in Table 1. Based on the numbers, the quality of the matching can be judged as suboptimal. For better evaluation of the matching between human and machine reading, the variation in human detection of pathological areas needs assessment.
Fig. 4. Segmented images; a), d), g), and j) manually segmented images, b), e), h), and k) segmented in the RGB space and images
Table 1. Numerical results for segmented images in Fig. 4 in the RGB and HSV spaces
Segmented
Images in Fig. 4 [%]FP [%]FN Aagr Adis Colour Space
b) 6.6 9.3 0.85 0.25 RGB
c) 6.9 11.8 0.82 0.25 HSV
e) 0 0 1.00 0 RGB
f) 0 0 1.00 0 HSV
h) 3.7 5.9 0.93 0.18 RGB
i) 3.2 5.1 0.95 0.15 HSV
k) 5.7 8.4 0.88 0.20 RGB
l) 5.9 7.3 0.89 0.22 HSV
The specialists’ segmentation is understood as the most correct. His work represents the norm for the evaluation of the segmentation algorithm. It takes years of specialization for a medical doctor to gain expert knowledge of a competent subject. Some variation in human detection of pathological areas can still exist since it is the fine grain of colour nuances that make the borderline difference between healthy and cancerous tissue.
The match between the experts’ segmentation and the segmentation obtained by the algorithm in the RGB colour space, is 84%. The corresponding match for the HSV colour space is 88%. The 4 percentage points higher level of matching in the HSV space is significant in medical diagnostics. Segmentation in the HSV space has an advantage over segmentation in the RGB space.
For autonomous use, the segmentation algorithm will need to pass meticulously selected verification requirements since there is no plan for the specialists’ segmentation being available in advance.
4 DISCUSSION
Studying the images in Fig. 4, one finds small areas that were not identified as morphological even though they significantly differ in colour from their surroundings. Since these areas are small enough they do not significantly influence the overall detection efficiency. These areas can be joined to the morphological or to background segments without harm. It is larger morphological segments that are significant for the assessment of matching to the experts’ definition.
The algorithmic segmentation is a hierarchical process that proceeds through sequential phases with well-defined interfaces among them, where decisions are made. The experts’ control in real time could add to the quality of assessment on pathological changes.
In the development phase, statistical data about the experts’ interaction with the system would give further insight into the diagnostic process. Such data would be most useful for the algorithm enhancements.
Reading, i.e., the analysis of a medical image is a complex process. It should not be overlooked that it takes years of training for a medical doctor to become an expert in imaging diagnostics. The implication is that relying only on context-independent segmentation methods cannot be the most comprehensive strategy for the development of a machine-based diagnostic system. Additional expert knowledge is needed in image pre-processing and in the segmentation phase.
5 CONCLUSIONS
The developed algorithm for the image segmentation was evaluated in the RGB and HSV colour spaces. The latter proved as a better option for the AFB image segmentation. Matching of context-independent segmentation to the experts’ work is remarkably high. The addition of built-in expert knowledge has the potential to bring the product to a level where it can be used autonomously for the image pre-assessment.
Alternatively, the product can be used as an interactive helper to the physician. In both cases, the doctors could spend less time reading the images and have more time for other work. Additional machine-based image evaluation adds to diagnose certainty.
As it could be expected, colour images are more suitable for segmentation than the grayscale images. Interestingly, working with the hue channel only can result in diagnostically useful image segmentation. Low intensity makes segmentation unstable, i.e., not working.
The development of a context-independent algorithm is the first stage in the development of a machine-based expert system. The conclusion of this phase is required before the development on more intelligent algorithms can begin.
A literature search shows that the authors of published segmentation algorithms only rarely compare the efficiency of newly developed algorithms to the existing ones. A thorough elaboration on the implementation complexity is more of an exception than a rule. Images are analysed in different colour spaces. None of the spaces has a far-reaching advantage for processing over the other colour spaces.
a reference segmented image needs to be defined from their work. Biopsy results need to be taken into account in reading the reference images.
At this point the working of the algorithm has proved to be effective enough so that additional efforts can bring the product to a level which is needed for daily use in a working environment. There, the product works in a specific context, additional expert knowledge can be added, real time input of the operator is possible at all times – efficiency outperforms the one of the context independent, i.e., generic image segmentation product.
6 REFERENCES
[1] Bračun, D., Perdan, B., Diaci, J. (2011). Surface Defect
Detection on Power Transmission Belts Using Laser Profilometry. Strojniski vestnik - Journal of Mechanical Engineering, vol. 57, no. 3, p. 257-266, DOI:10.5545/ sv-jme.2010.176.
[2] Suetens, P. (2009). Fundamentals of Medical Imaging. Cambridge University Press, New York, DOI:10.1017/
CBO9780511596803.
[3] Koschan, A., Abidi, M. (2008). Digital Color Image Processing. John Wiley & Sons, Hoboken, DOI:10.1002/9780470230367.
[4] Wang, K.P., Mehta, A.C., Turner, J.F. (2004). Flexible Bronchoscopy. Wiley-Blackwell, Massachusetts. [5] Chen, W., Gao, X., Tian, Q., Chen, L. (2011). A
comparison of autofluorescence bronchoscopy and white light bronchoscopy in detection of lung cancer and preneoplastic lesions: A meta-analysis. Lung Cancer, vol. 73, no. 2, p. 183-188, DOI:10.1016/j.
lungcan.2010.12.002.
[6] Kusunoki, Y., Imamura, F., Uda, H., Mano, M., Horai, T. (2000). Early detection of lung cancer with laser-induced fluorescence endoscopy and spectrofluorometry. Chest, vol. 118, no. 6, p. 1776-1782, DOI:10.1378/chest.118.6.1776.
[7] Bard, M.P.L., Amelink, A., Skurichina, M., Den
Bakker, M., Burgers, S.A., Van Meerbeeck, J.P., Duin, R.P.W., Aerts, J.G.J.V., Hoogsteden, H.C., Sterenborg, H.J.C.M. (2005). Improving the specificity
of fluorescence bronchoscopy for the analysis of neoplastic lesions of the bronchial tree by combination with optical spectroscopy: preliminary communication.
Lung Cancer, vol. 47, no. 1, p. 41-47, DOI:10.1016/j.
lungcan.2004.06.009.
[8] Zeng, H., Petek, M., Zorman, M.T., McWilliams,
A., Palcic, B., Lam, S. (2004). Integrated endoscopy system for simultaneous imaging and spectroscopy for early lung cancer detection. Optics Letters, vol. 29, no. 6, p. 587-589, DOI:10.1364/OL.29.000587.
[9] Tercelj, M., Zeng, H., Petek, M., Rott, T., Palcic, B.
(2005). Acquisition of fluorescence and reflectance spectra during routine bronchoscopy examinations
using the ClearVu Elite device: pilot study. Lung Cancer, vol. 50, no. 1, p. 35-42, DOI:10.1016/j.
lungcan.2005.05.028.
[10] Goujon, D., Zellweger, M., Radu, A., Grosjean,
P., Weber, B.C., Van Den Bergh, H., Monnier, P., Wagnières, G. (2003). In vivo autofluorescence imaging of early cancers in the human tracheobronchial tree with a spectrally optimized system. Journal of Biomedical Optics, vol. 8, no. 1, p. 17-25, DOI:10.1117/1.1528594.
[11] Qu, J.Y., Chang, H., Xiong, S. (2002). Fluorescence
spectral imaging for characterization of tissue based on multivariate statistical analysis. Journal of the Optical Society of America, vol. 19, no. 9, p. 1823-1831, DOI:10.1364/JOSAA.19.001823.
[12] Meža, M., Breskvar, M., Košir, A., Bricl, I., Tasič, J., Rozman, P. (2007). Telemedicine in the blood
transfusion laboratory: Remote interpretation of pre-transfusion tests. Journal of Telemedicine and Telecare, vol. 13, no. 7, p. 357-362,
DOI:10.1258/135763307782215370.
[13] Takehana, S., Kaneko, M., Mizuno, H. (1999).
Endoscopic diagnostic system using autofluorescence.
Diagnostic and Therapeutic Endoscopy, vol. 5, no. 2, p.
59-63, DOI:10.1155/DTE.5.59.
[14] Russ, J.C. (2011). The Image Processing Handbook. CRC Press, Boca Raton.
[15] Bountris, P., Apostolou, A., Haritou, M., Passalidou,
E., Koutsouris, D. (2009). Combined texture features
for improved classification of suspicious areas in autofluorescence bronchoscopy. Proceedings of the 9th
International Conference on Information Technology and Applications in Biomedicine, ITAB, Larnaca, p. 1-4.
[16] Poynton, C. (1995). A guided tour of color space. Physics Today, vol. 2, p. 1-14.
[17] Jenko, M. (2010). Ratiometric measurement for long
term precision, reasoning and case study. Information MIDEM, vol. 40, no. 2, p. 124-130.
[18] Jenko, M., Medjeral, N., Butala, P. (2001).
Component-based software as a framework for concurrent design of programs and platforms. Microprocessors and Microsystems, vol. 25, no. 6, p. 287-296, DOI:10.1016/ S0141-9331(01)00120-X.
[19] Cheng, H.D., Sun, Y. (2000). A hierarchical approach to color image segmentation using homogeneity. IEEE Transactions on Image Processing, vol. 9, no. 12, p. 2071-2082, DOI:10.1109/83.887975.
[20] Klemenčič, J. (2000). Segmentation and volumetry of hippocampus from magnetic resonance images using active curves. MSc. Thesis, University of Ljubljana, Ljubljana.