DEMOGRAPHIC RESEARCH
VOLUME 32, ARTICLE 20, PAGES 589
−
620
PUBLISHED 25 FEBRUARY 2015
http://www.demographic-research.org/Volumes/Vol32/20/ DOI: 10.4054/DemRes.2015.32.20
Research Article
The role of smoking on mortality compression:
An analysis of Finnish occupational social
classes, 1971−2010
Alyson A. van Raalte
Mikko Myrskylä
Pekka Martikainen
©2015 van Raalte, Myrskylä & Martikainen.
This open-access work is published under the terms of the Creative Commons Attribution NonCommercial License 2.0 Germany, which permits use, reproduction & distribution in any medium for non-commercial purposes, provided the original author(s) and source are given credit.
1.1 Introduction 590 1.2 Smoking, age-specific mortality change and lifespan variation 591
2 Data 593
3 Methods 594
3.1 Life tables, life expectancy, and lifespan variation 594
3.2 Measuring smoking-attributable mortality 595
3.3 Estimating the effects of smoking on life expectancy and lifespan variation
596
4 Results 597
5 Discussion 604
5.1 Summary of results 604
5.2 Interpretation 604
5.3 Comparison to other work 606
5.4 Methodological considerations 607
5.5 Conclusion 609
6 Acknowledgements 610
References 611
The role of smoking on mortality compression:
An analysis of Finnish occupational social classes, 1971–2010
Alyson A. van Raalte1 Mikko Myrskylä1,2,3 Pekka Martikainen3
Abstract
BACKGROUND
Adult lifespan variation has been stagnant since the 1960s in most developed countries, despite increases in longevity. However, national averages mask large socioeconomic differences. In Finland lifespan variation among the highest occupational class has continued to decline, while the lower classes have experienced stagnation.
OBJECTIVE
We aimed to investigate the role that smoking has played in the occupational social class divergence in lifespan variation since the 1970s.
METHODS
Finnish register data (1971–2010) by occupational social class, ages 50+, was used. Smoking-attributable mortality was estimated by the Preston, Glei, and Wilmoth (2010) method.
RESULTS
We expected smoking-attributable mortality to explain the divergence by occupational class because smoking is socially patterned and particularly important for middle- and young-old-age mortality, ages which contribute greatly to lifespan variation. Instead, we found that among men social class differences would have widened even further without smoking; for women lifespan variation was unaffected by smoking.
CONCLUSION
The maturation of the smoking epidemic will not decrease uncertainty in the timing of death or reduce inequalities in this dimension of mortality by occupational class in Finland.
1 Max Planck Institute for Demographic Research, Konrad-Zuse-Str. 1, 18057 Rostock, Germany. E-Mail: [email protected].
1. Background
1.1 Introduction
Uncertainty in the timing of death, or lifespan variation, is a fundamental dimension of inequality and has important implications for both individuals and society (Tuljapurkar 2010). A greater uncertainty of surviving to old age reduces the value of public and private investment in training and education. At the individual level, lifespan variation impedes the planning of life’s events. Economic models have shown that individuals would be willing to trade half a year in mean lifetime to reduce lifespan variation measured by standard deviation by one year (Edwards 2013). At the societal level, high lifespan variation may signal failing social policies (van Raalte et al. 2011), particularly if caused by high levels of premature mortality (Sen 1998).
Traditionally, within-population mortality trends have been monitored by the mean of the age-at-death distribution that is associated with the period life table: that is, the life expectancy. However, given recent uneven age patterns of mortality decline (Himes, Preston, and Condran 1994; Kannisto et al. 1994; Rau et al. 2013; Tuljapurkar, Li, and Boe 2000), the variation of this distribution, what we here refer to as lifespan variation, is becoming a more important dimension to examine. Differences in mortality distributions between high income countries increasingly come from the shapes rather than the locations of the age-at-death distributions. That is, differences in adult lifespan variation, defined as variation in ages-at-death conditional upon surviving childhood, contribute more to the differences between mortality distributions than differences in life expectancies (Edwards and Tuljapurkar 2005). Although a strong inverse relationship used to exist between these two domains, increases in life expectancy since the 1960s have not uniformly been met with compression in the adult lifespan distribution; if anything, stagnation in adult lifespan variation has become the norm in high income countries (Edwards 2011; Edwards and Tuljapurkar 2005; Smits and Monden 2009; Wilmoth and Horiuchi 1999).
1.2 Smoking, age-specific mortality change and lifespan variation
The uptake and cessation of smoking by different population groups can be compared to an epidemic. Typically a small frontier group of high status men first start smoking, before the habit is adopted by the rest of the male population, and finally spreads to females (Escobedo and Peddicord 1996; Ferrence 1989; Pampel 2005). Likewise the upper classes are usually the first cohorts to reduce their smoking consumption or to abstain from the habit altogether.
This means that at any given period, the age structure of smoking-attributable mortality will be heavily influenced by the cumulative experience of the cohorts passing through. At the population level, peak smoking-attributable mortality generally lags behind peak smoking consumption by about 30 years (Lopez, Collishaw, and Piha 1994). At the individual level, lifelong smokers die 10 years earlier than non-smokers on average, according to the long-running prospective British cohort study of medical doctors (Doll et al. 2004).
Indices of adult lifespan variation are most sensitive to changes in mortality from middle adult and old ages, but least sensitive to mortality change around the life expectancy (Figure 1). This is because for any age schedule of mortality there exists a threshold age below which an increase in mortality (for instance, from smoking) would increase lifespan variation, and above which it would decrease variation (Zhang and Vaupel 2009). For most measures of lifespan variation this age is generally found just below the life expectancy (van Raalte and Caswell 2013) and both life expectancy and the threshold age for mortality compression have increased in correspondence with one another (Gillespie, Trotter, and Tuljapurkar 2014; Vaupel, Zhang, and van Raalte 2011).
timing of smoking initiation and cessation, we can expect to observe differential timing of increase and decrease in lifespan variation.
Figure 1: The proportional increase in lifespan variation resulting from a 1% increase in mortality at each age
Note: The dashed vertical line at age 76.5 is the life expectancy at birth. Mortality increases at all ages decrease life expectancy, while only mortality increases at younger ages will increase variation in ages at death (here depicted by the life disparity index, e†). Where the curve crosses the x-axis at around age 75 is known as the threshold age. Data are period Finnish male 2009 life
table data, from the Human Mortality Database (2013).
extent to which these diverging trends in lifespan variation by SES can be explained by smoking. If non-manual workers took up smoking earlier than manual workers, we would expect smoking to explain both the mortality compression of non-manual workers and the stagnation of manual workers. To provide context for the diverging trends in lifespan variation and the role of smoking in explaining the divergence, we also document comparable results for life expectancy.
Figure 2: How smoking would be expected to impact ages at death and lifespan variation, according to the SES diffusion model
Note:In the first phase, smokers would be concentrated at younger ages and their earlier deaths would lead to mortality expansion or increases in lifespan variation. In the middle phase, smokers would be concentrated at ages before and after the threshold age and might simply shift the age-at-death distribution to younger ages without changing its shape. In the final phase, smokers would be concentrated at late ages and their earlier deaths would compress the age-at-death distribution or reduce lifespan variation.
2. Data
The data set is comprised of individual-level register data of all Finns linked by personal identification codes to the death registry, covering the period 1971–2010. The death and exposure counts were aggregated by Statistics Finland by single year of age (50–100+), sex, cause of death,4 and occupational-based social class before being
delivered to the researchers. In each year person days and deaths were allocated to one-year age intervals between exact birthdays. The death rates and mortality differences by occupational class have been published elsewhere (Martikainen, Valkonen, and Martelin 2001; Valkonen 1993; van Raalte, Martikainen, and Myrskylä 2014).
We used occupation-based social class as our SES indicator because, unlike education, the proportion of individuals in each class remained reasonably stable over time (van Raalte, Martikainen, and Myrskylä 2014). Occupation-based socioeconomic status was measured at the time of each census updated in every fifth year. Four groups were distinguished: 1) upper non-manual, 2) lower non-manual, 3) manual workers, and 4) others. We present results for the first three classes only, due to the heterogeneity and large compositional changes within the fourth group. The classification is retroactive: that is, for pensioners, unemployed persons, and those whose socioeconomic status was unknown information was retrieved from earlier censuses. Those whose main activity was household work were classified according to the occupation of the head of the household. Immigrants were dropped from the data set since we did not have any baseline information on occupational class, while emigrants were censored at emigration.
3. Methods
3.1 Life tables, life expectancy, and lifespan variation
We created life tables (ages 50+) for each sex, occupational class, and period by conventional methods (Wilmoth et al. 2007). This included smoothing mortality with a Kannisto model, from the first age when the death counts fell below 100 in any sex or occupational group for each period. By doing so, we were able to extend our life tables up to a 110+ age category. We aggregated data into five-year intervals (1971–1975, 1976–1980, 1981–1985, 1986–1990, 1991–1995, 1996–2000, 2001–2005, 2006–2010). This was done to produce smoother age at death distributions and gave us small
confidence intervals around our life expectancy estimates, even for the smallest occupational groups (van Raalte, Martikainen, and Myrskylä 2014).
Lifespan variation was measured using e-dagger (Vaupel and Canudas Romo 2003; Vaupel, Zhang, and van Raalte 2011) conditional upon survival to age 50 because of its ease of interpretation as the average number of life years lost due to death. Assuming a life table radix of 1, it is calculated as
𝑒50† = � 𝑑𝑥�12 (𝑒𝑥+ 𝑒𝑥+1)� , 110+
𝑥=50
(1)
where dx and ex are respectively the number of life table deaths and the remaining life
expectancy at age x for all causes, calculated from age 50 to age 110+. To understand how 𝑒50† functions as a lifespan variation measure, consider a situation in which deaths are spread out uniformly over a wide range of ages. Then the remaining life expectancy at death at early ages is high and remains considerable even over more common ages at death. As deaths become concentrated into a shorter age interval, the distance lowers between death at a certain age and the number of years that would have been gained by saving this death. Thus 𝑒50† can alternatively be interpreted as the average remaining life
expectancy at death (Vaupel and Canudas Romo 2003). The ease of interpretation of
𝑒50† has made it a popular alternative to other common indices of lifespan variation, such as the standard deviation or the interquartile range (Beltrán-Sánchez and Soneji 2011; Kibele 2012; Nusselder and Mackenbach 1996; Popham, Dibben, and Bambra 2013; Shkolnikov et al. 2011; van Raalte, Martikainen, and Myrskylä 2014; Vaupel, Zhang, and van Raalte 2011). In any case, indices of lifespan variation are strongly correlated with one another (van Raalte and Caswell 2013; Vaupel, Zhang, and van Raalte 2011; Wilmoth and Horiuchi 1999) and exhibit similar sensitivities to changes in age-specific mortality (van Raalte and Caswell 2013), thus it is unlikely that our results would be driven by the choice of the lifespan variation measure.
3.2 Measuring smoking-attributable mortality
Preston, Glei, and Wilmoth (PGW) method (Preston, Glei, and Wilmoth 2010, 2011). Although both methods use lung cancer deaths to estimate the population’s cumulative smoking exposure, they differ in techniques to assess the share of deaths caused by such exposure. The PL method borrows the excess relative risk of mortality for most other causes of death among smokers obtained from American survey data, and assumes that half of this excess mortality is directly attributable to smoking. The PGW method uses a negative binomial regression model to determine the association between lung cancer and other causes of death to predict the number of deaths attributable to smoking. While both methods tend to produce similar estimates of smoking-attributable mortality (Blue and Fenelon 2011; Fenelon and Preston 2012; Preston, Glei, and Wilmoth 2010; Rostron 2010), we prefer the PGW method because it eliminates the arbitrary step of determining the proportion of excess mortality risk found among smokers that is caused by smoking.
The PGW model was built using data from 20 high income countries, Finland included, covering the period 1950–2006 for ages 50 and above. The method allows estimating smoking-attributable mortality in five-year age groups up to the open-ended age interval 85+. We used the refined regression coefficients from Preston, Glei, and Wilmoth (2011), which are more reasonable for older-aged women than those given in Preston, Glei, and Wilmoth (2010).
3.3 Estimating the effects of smoking on life expectancy and lifespan variation
We estimated what 𝑒50 and 𝑒50†would have been like in the absence of smoking by
multiplying the death rate (𝑀𝑠𝑐𝑥𝑦) for sex 𝑠, occupational class 𝑐, age 𝑥, and year
interval 𝑦 by the factor (1 − 𝐴𝑠𝑐𝑥𝑦), where 𝐴𝑠𝑐𝑥𝑦 is the proportion of deaths attributable
to smoking in the age interval that includes x. This assumes that the same attributable fraction applies to all ages in each five-year age interval, as well as in the open age category (85+). With these new death rates we recalculated the life tables using the methods described above.
Finally, we decomposed the change over time (1971–1975 to 2006–2010) in 𝑒50
and 𝑒50† into contributions from smoking-attributable mortality and
non-smoking-attributable mortality. To do so we treated each of these contributions as competing causes of death (Preston, Glei, and Wilmoth 2011), allowing us to use standard cause-of-death decomposition techniques, which are easily extended to the decomposition of
4. Results
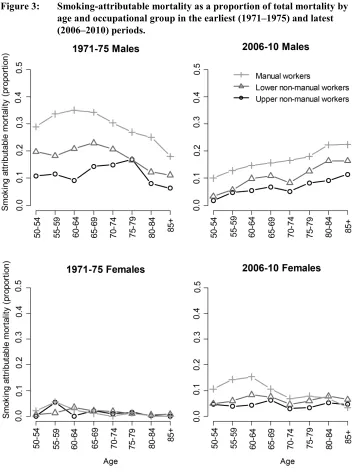
Between the earliest period (1971–1975) and the latest period (2006–2010) the overall proportion of deaths attributable to smoking declined for men of all occupational classes, while it rose for women. The breakdown for these periods by age and occupational class is given in Figure 3. In the earlier period a higher proportion of deaths among adults under age 75 were smoking-related than deaths over age 75. This reversed itself for men by 2006–2010, but not for women, reflecting the later initiation of smoking by women. Manual workers had the highest proportion of smoking-attributable mortality for most age and year combinations.
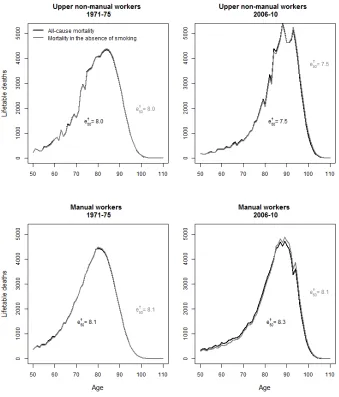
In Figure 4 we have plotted the male age-at-death distribution as calculated for both all-cause mortality and mortality not attributable to smoking for the earliest and latest periods among the manual and upper non-manual workers. In all cases, removing smoking-attributable mortality did not fundamentally change the shape of the distribution, but rather shifted the distribution to older ages. Thus smoking appeared to primarily influence the level rather than the age spread of mortality. The largest shift was seen among male manual workers in the earlier period. Producing the same figure for women resulted in few visible differences in the age-at-death distributions, apart from a small but noticeable increase in age-at-death variation among manual workers in the later period (Figure A-1).
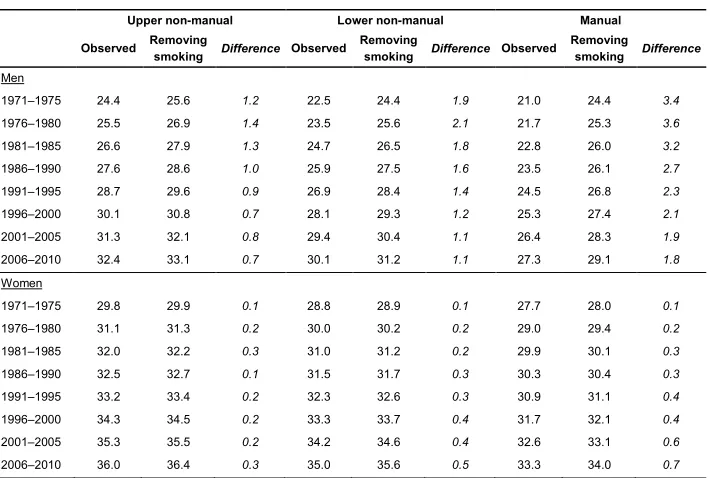
Table 1 presents the impact of smoking on life expectancy and confirms that smoking-attributable mortality had a greater impact on the 𝑒50of manual workers than
it did on that of non-manual classes over all time periods. Among men, manual workers reached a peak of 3.6 years of 𝑒50 lost due to smoking in 1976–1980. This contrasted to
a peak of 1.4 years among upper manual workers and 2.1 years among lower non-manual workers in the same period. Trends in the losses in 𝑒50attributable to smoking
Table 1: Remaining life expectancy at age 50 for the different occupational classes in Finland
Upper non-manual Lower non-manual Manual
Observed Removing smoking Difference Observed Removing smoking Difference Observed Removing smoking Difference
Men
1971–1975 24.4 25.6 1.2 22.5 24.4 1.9 21.0 24.4 3.4
1976–1980 25.5 26.9 1.4 23.5 25.6 2.1 21.7 25.3 3.6
1981–1985 26.6 27.9 1.3 24.7 26.5 1.8 22.8 26.0 3.2
1986–1990 27.6 28.6 1.0 25.9 27.5 1.6 23.5 26.1 2.7
1991–1995 28.7 29.6 0.9 26.9 28.4 1.4 24.5 26.8 2.3
1996–2000 30.1 30.8 0.7 28.1 29.3 1.2 25.3 27.4 2.1
2001–2005 31.3 32.1 0.8 29.4 30.4 1.1 26.4 28.3 1.9
2006–2010 32.4 33.1 0.7 30.1 31.2 1.1 27.3 29.1 1.8
Women
1971–1975 29.8 29.9 0.1 28.8 28.9 0.1 27.7 28.0 0.1
1976–1980 31.1 31.3 0.2 30.0 30.2 0.2 29.0 29.4 0.2
1981–1985 32.0 32.2 0.3 31.0 31.2 0.2 29.9 30.1 0.3
1986–1990 32.5 32.7 0.1 31.5 31.7 0.3 30.3 30.4 0.3
1991–1995 33.2 33.4 0.2 32.3 32.6 0.3 30.9 31.1 0.4
1996–2000 34.3 34.5 0.2 33.3 33.7 0.4 31.7 32.1 0.4
2001–2005 35.3 35.5 0.2 34.2 34.6 0.4 32.6 33.1 0.6
2006–2010 36.0 36.4 0.3 35.0 35.6 0.5 33.3 34.0 0.7
Note: The observed e50 includes mortality from all causes, while “removing smoking” is the estimated period e50 in the absence of
smoking. The “difference” category is the reduction in e50 attributable to smoking.
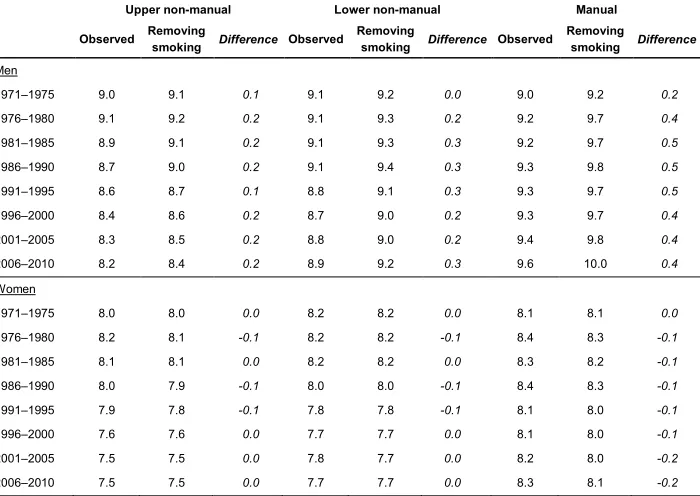
Table 2 presents the impact of smoking on lifespan variation. Over the observation window, 𝑒50† decreased for the non-manual workers but increased for manual workers
of both sexes. Removing smoking led to increased lifespan variation for men and slightly decreased lifespan variation for women, but overall the impact of smoking on
Table 2: Life disparity at age 50 (𝒆𝟓𝟎† ) for the different occupational classes in Finland
Upper non-manual Lower non-manual Manual
Observed Removing smoking Difference Observed Removing smoking Difference Observed Removing smoking Difference
Men
1971–1975 9.0 9.1 0.1 9.1 9.2 0.0 9.0 9.2 0.2
1976–1980 9.1 9.2 0.2 9.1 9.3 0.2 9.2 9.7 0.4
1981–1985 8.9 9.1 0.2 9.1 9.3 0.3 9.2 9.7 0.5
1986–1990 8.7 9.0 0.2 9.1 9.4 0.3 9.3 9.8 0.5
1991–1995 8.6 8.7 0.1 8.8 9.1 0.3 9.3 9.7 0.5
1996–2000 8.4 8.6 0.2 8.7 9.0 0.2 9.3 9.7 0.4
2001–2005 8.3 8.5 0.2 8.8 9.0 0.2 9.4 9.8 0.4
2006–2010 8.2 8.4 0.2 8.9 9.2 0.3 9.6 10.0 0.4
Women
1971–1975 8.0 8.0 0.0 8.2 8.2 0.0 8.1 8.1 0.0
1976–1980 8.2 8.1 -0.1 8.2 8.2 -0.1 8.4 8.3 -0.1
1981–1985 8.1 8.1 0.0 8.2 8.2 0.0 8.3 8.2 -0.1
1986–1990 8.0 7.9 -0.1 8.0 8.0 -0.1 8.4 8.3 -0.1
1991–1995 7.9 7.8 -0.1 7.8 7.8 -0.1 8.1 8.0 -0.1
1996–2000 7.6 7.6 0.0 7.7 7.7 0.0 8.1 8.0 -0.1
2001–2005 7.5 7.5 0.0 7.8 7.7 0.0 8.2 8.0 -0.2
2006–2010 7.5 7.5 0.0 7.7 7.7 0.0 8.3 8.1 -0.2
Note: The “difference” category is the increase in 𝒆𝟓𝟎† attributable to smoking.
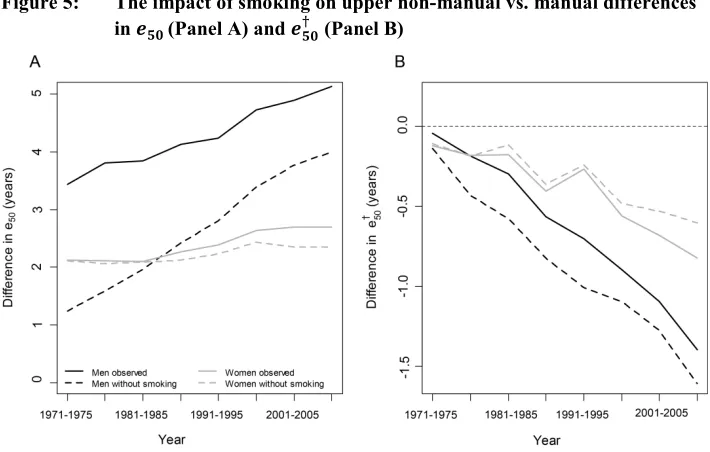
In Figure 5 we have plotted the class gap in 𝑒50and in 𝑒50† between the upper
non-manual and the non-manual classes, based both on observed data and with smoking-attributable mortality removed. The class gap in 𝑒50 (panel A) increased over time for
both sexes. Smoking was responsible for a decreasing share of this gap over time for men, while the opposite was true for women. In the absence of smoking, the class gap in 𝑒50would actually have been larger for women than for men during the 1970s and up
to the mid-1980s. The class gap in 𝑒50† (panel B) also grew over time, from near-negligible differences to differences of over one year among men and half a year among women. The larger class gap in 𝑒50† found among men was unrelated to their higher smoking levels. In fact, smoking-attributable mortality decreased the class gap in 𝑒50†
Figure 5: The impact of smoking on upper non-manual vs. manual differences in 𝒆𝟓𝟎 (Panel A) and 𝒆𝟓𝟎† (Panel B)
Note: The solid lines pertain to observed data, while the dashed lines are with smoking-attributable mortality removed.
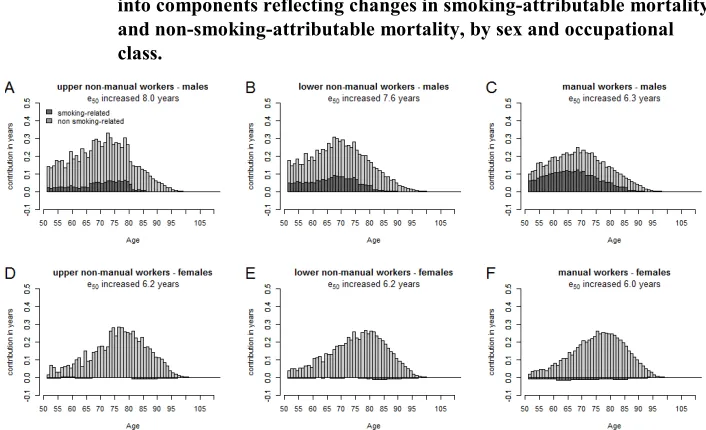
We next decomposed changes in 𝑒50 and 𝑒50† over time (1971–1975 to 2006–2010)
into components attributable and not attributable to smoking. Among men, changes in
𝑒50 were driven mainly by non-smoking-attributable causes for the non-manual
workers, who also experienced the largest gains in 𝑒50 over the 30-year time period
(Figure 6). Manual workers experienced larger gains in 𝑒50 from smoking-attributable
causes, but smaller gains from non-smoking-attributable causes. Gains in 𝑒50 among
Figure 6: Decomposition of 𝒆𝟓𝟎 increases between 1971–1975 and 2006–2010
into components reflecting changes in smoking-attributable mortality and non-smoking-attributable mortality, by sex and occupational class.
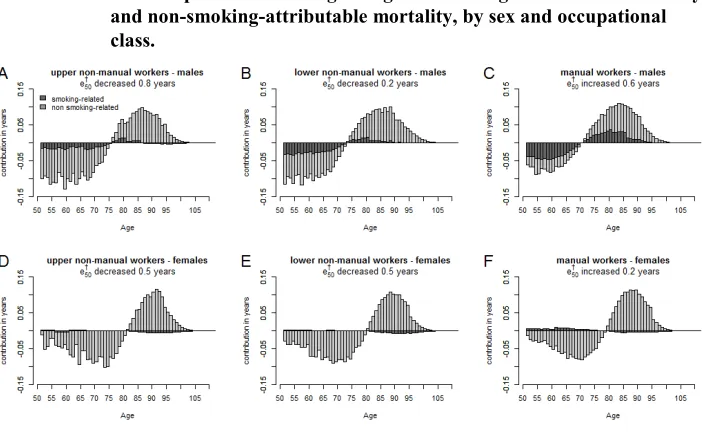
The decomposition pattern is more complicated for 𝑒50† . In order for lifespan
variation to decrease, reductions in mortality must be greater at early ages, which compress the age-at-death distribution, than they are at later ages, which expand the distribution. In Figure 7 we show that, among males, decreases in smoking-related mortality occurred at all ages, but were larger at ages below the threshold age, particularly for non-manual workers. Male manual workers especially showed strong reductions in smoking-related causes over this time frame. However, the compression of mortality caused by reductions in smoking-related mortality at ages below the threshold age was not enough to balance the expansion in the age-at-death distribution caused by reductions at older ages in both smoking-related and non-smoking-related mortality, which caused 𝑒50† to increase overall. In contrast, non-manual workers
experienced strong reductions in mortality from non-smoking-related causes over all ages. When combined with the reductions in smoking-related mortality at younger ages, this led to an overall compression of the age-at-death distribution: that is, a reduction in
Figure 7: Decomposition of 𝒆𝟓𝟎† changes between 1971–1975 and 2006–2010 into components reflecting changes in smoking-attributable mortality and non-smoking-attributable mortality, by sex and occupational class.
5. Discussion
5.1 Summary of results
Smoking only had a modest impact on the total levels, trends, and occupational class differentials in lifespan variation, despite having a large impact on life expectancy levels. Among men, diverging trends in lifespan variation by occupational class would have somewhat widened in the absence of smoking, while among women trends in lifespan variation were mostly unaffected by smoking. For both sexes the diverging trends in lifespan variation by occupational class were mostly explained by differences in early adult mortality by non-smoking-related causes.
5.2 Interpretation
mortality. As we have shown in Figure 3, removing smoking-attributable mortality did not fundamentally alter the shape of the age-at-death distribution but rather shifted it to older adult ages.
We reasoned that the different timing of smoking uptake and cessation by occupational class might be able to explain the diverging trends in mortality compression, based on the stylized schema of the diffusion of the smoking epidemic. It could be that Finland never experienced a strong reversal in the class gradient to smoking (Laaksonen et al. 1999; Helakorpi et al. 2008), but survey data is lacking on the earliest male cohorts’ smoking initiation. Thus, although it was not the case in Finland, it is conceivable that smoking might have played a more powerful role in driving SES trends in lifespan variation in other countries if they had experienced stronger SES reversals in smoking initiation. Unfortunately, few countries have good long-term data on smoking initiation by socioeconomic position to test this empirically.
The interaction of the age pattern of smoking-attributable mortality and the threshold age that separates ages in which increasing mortality from smoking would increase or decrease lifespan variation also helps to understand why, in the absence of smoking, male lifespan variation would be higher but female lifespan variation would be lower. For women the threshold age is markedly higher than for men: in Finland 4–5 years in the lower occupational classes and 6–7 years in the higher occupational classes. The older the threshold age, the greater the proportion of smoking-attributable mortality found below this age, which increases lifespan variation. Consequently, with increasing life expectancy, or in contemporary populations with very high life expectancy, the relative role of smoking on mortality compression may be larger than what is documented in this analysis.
To date, most of the research into socioeconomic inequalities in mortality has focused on men. This is in part because it is more difficult to determine the socioeconomic status of women, particularly among women who did not seek paid employment, but also because socioeconomic inequalities in mortality are larger among men (Mackenbach et al. 1999). It has long been assumed that this is because many determinants of premature mortality (which drives SES differences in life expectancy and lifespan variation) are more strongly socially patterned among men (Huisman, Kunst, and Mackenbach 2005; MacIntyre and Hunt 1997; Mackenbach et al. 1999). However, an important element uncovered in this research is that, in the absence of smoking, women had larger inequalities in life expectancy than men in the earlier periods, with the crossover happening in 1986–1990. In other words, when the strongly socially patterned mortality that is associated with smoking is accounted for, mortality for other causes shows smaller disparities for men than women. This may imply that the risk factors for these other causes were less socially patterned among men than women in this earlier period. As the impact of smoking on mortality continues to fade among men and strengthen among women, it will be important to model the role of smoking in driving socioeconomic inequalities in mortality.
5.3 Comparison to other work
To our knowledge, this is the first study to examine the impact of smoking on lifespan variation. However, the impact of smoking on life expectancy is well documented. In a comparison of 20 developed countries, Preston, Glei, and Wilmoth (2011) estimated that smoking was reducing life expectancy by two years among men and one year among women in 2003. The harm from smoking in Finland was lower than this 20-country average, causing reductions in 𝑒50 of 1.7 years (men) and 0.5 year (women). If
the Finnish occupational groups were compared to these countries, Finnish male manual workers experienced losses in life expectancy comparable to the entire US population and the upper non-manual workers to Sweden (based on our results from 2006–2010). For women the impact of smoking on 𝑒50 is comparable to Austria and Belgium
(manual workers) and France (non-manual workers).
although when further refined by age, the latter study found that this figure was as high as 44% among middle-aged men. This is near to Jha et al.’s (2006) estimate that smoking accounts for about half the excess mortality among low-educated men (ages 36–69) in urban Canada, USA, England and Wales, and Poland using the Peto-Lopez indirect estimation method. In Finland, Martikainen et al. (2013) found that the high to low educational gap in e50 would have been attenuated by 29% (men) and 11%
(women) in the absence of smoking in 2001–2005, using the PGW method.
Although Finland is a small and relatively homogeneous population, we would expect broadly similar results for the impact of smoking on lifespan variation in other populations with long cohort smoking histories. Finnish men adopted smoking early and consequently are estimated to have among the highest excess mortality attributable to smoking in Europe (Mackenbach et al. 2004), with levels comparable to the USA (Pampel 2011). Finnish women have smoked far less than British, American, or Danish women, but have smoking histories comparable to other Scandinavian countries (Mackenbach et al. 2004; Pampel 2011). It is more difficult to determine whether smoking would have a greater impact on lifespan variation in countries with a higher smoking prevalence because it would also depend on the underlying age patterns of non-smoking-attributable mortality.
The high quality of the data set drawn from the Finnish population register gives us confidence in the results from this analysis. This data set is large, is harmonized over several revisions of the ICD coding practices, and includes the institutionalized population. These are major advantages over using successive waves of population surveys, which unfortunately in many countries remain the only available source of socioeconomic data.
5.4 Methodological considerations
Smoking-attributable mortality estimates obtained using the PGW model have been close to those obtained using other indirect models, suggesting that the choice of model should not have a large influence on our results (Blue and Fenelon 2011; Fenelon and Preston 2012; Preston, Glei, and Wilmoth 2010; Rostron 2010). Additionally, the PGW approach was applied to more recent data from 50 American states to obtain new American-specific regression coefficients. Despite differences in time period and context, these regression coefficients were remarkably similar to those derived from 20 high income countries (and used here), giving further validation to the model approach (Fenelon and Preston 2012).
Wilmoth 2011), especially for women (Rostron 2010). We used the coefficients in the later PGW publication, which excluded ages 85+ from the model fit and proposed using the average of age coefficients 70–74, 75–79, and 80–84 as the regression coefficient for ages 85+ (Preston, Glei, and Wilmoth 2011). We also tested the impact of increasing or decreasing the age 85+ coefficient by 50%. This increased or decreased the lifespan variation level in the absence of smoking by no more than 2.5%, with the level change being smaller among women.5
Estimates of smoking-attributable mortality determined directly from self-reported smoking behavior can differ from indirect estimates. Direct methods suffer from well-documented disadvantages, including capturing life course changes in smoking behavior, differentiating between different smoking intensities, types of cigarettes and inhalation practices, the use of small sample sizes that are not representative of the population, incorporating the lag between smoking harm and mortality, and incorporating temporal changes in relative risks from smoking. As a result of these disadvantages, we share the view that indirect methods of measuring smoking-attributable mortality are more reliable (Fenelon and Preston 2012; Preston, Glei, and Wilmoth 2010). This might especially be true when documenting trends in lifespan variation, where such problems may have different impacts on the estimation of smoking-attributable mortality at younger and older ages.
The PGW method makes the assumption that death rates attributable to smoking among never-smokers would be the same for each occupational group. However, it is possible that manual workers would have had greater exposure to ambient air pollution and passive smoking that might have put them at a greater risk of contracting lung cancer. Others who have tested this assumption for different population subgroups by increasing or decreasing these smoking-attributable death rates by half for different subgroups have found the results from the PGW method to be robust (Blue and Fenelon 2011; Martikainen et al. 2013; Myrskylä and Scholz 2013). It is also possible that lung cancer rates among non-smokers might have changed over time, but no major changes were observed over a 20-year period in the USA, despite large differences in the smoking composition of the population (Thun et al. 2006, 2008). We nevertheless tested two different scenarios: the first assumed 50% higher lung cancer rates among never-smokers for manual workers, and the second introduced a time-varying element whereby we doubled lung cancer mortality among non-smokers for all subgroups over the time frame examined. In both cases the changes to our results were minor and our conclusions remained robust.
Additionally, the PGW method assumes that causes of death that correlate with lung cancer are directly attributable to smoking. Some causes may be higher among smokers for reasons other than smoking (Rogers et al. 2005), which would lead to an
overestimation of smoking-attributable mortality. If these causes were concentrated in younger ages, the PGW method would overcompress the age distribution of mortality in the absence of smoking, leading to an overestimation of the role of smoking in mortality compression.
We calculated lifespan variation for ages starting at 50 because the smoking-attributable mortality at ages below 50 is comparatively small and the PGW regression model does not allow estimating smoking-attributable mortality for younger ages. With our data set it was possible to calculate lifespan variation starting from age 31; this revealed larger differences between occupational groups in all-cause lifespan variation than when starting at age 50 (van Raalte, Martikainen, and Myrskylä 2014). This is because mortality inequalities are larger among the age range 31–49 than among ages 50+, and because indices of lifespan variation are especially sensitive to early adult mortality (van Raalte and Caswell 2013). In general, estimates of smoking-attributable mortality in the 35–49 age range made from the Peto-Lopez model tend to be low (Preston, Glei, and Wilmoth 2011). Thus we would not expect smoking to have a large impact on lifespan variation were we to extend our age range backward.
There might also be some concern about using 𝑒50† as our index of lifespan
variation, given that compared to other indices it is more sensitive to older adult mortality (van Raalte and Caswell 2013), ages with less smoking-attributable mortality. To test this we measured lifespan variation by the standard deviation in age at death conditional upon survival to age 50 (𝑆50), the full results of which are available in the
Appendix. None of the patterns or conclusions changed.
At older ages the interaction of multiple underlying conditions can complicate the identification of the proximate cause of mortality (Manton 1986; Minaker and Rowe 1985). Lung cancer, however, tends to be more accurately identified than other causes of death (Kircher, Nelson, and Burdo 1985; Modelmog, Rahlenbeck, and Trichopoulos 1992; Percy and Muir 1989). Thus we take the view that the uncertainty in our estimates resulting from misreporting of lung cancer should be minimal. Furthermore, the quality of Finnish cause-of-death data used here is of internationally exceptional quality (Mathers et al. 2005).
5.5 Conclusion
from non-smoking-attributable causes among manual workers. The maturation of the smoking epidemic alone is not expected to bring about strong reductions in the uncertainty in the timing of death or to reduce socioeconomic differentials in this dimension of mortality.
6. Acknowledgments
This work was completed as part of the project on Mortality Divergence and Causes of Death (MODICOD) by the AXA Foundation and the project on Disparities in Mortality Trends to Future Health Challenges (DIMOCHA) by the Agence nationale de la recherche (ANR) and the Deutsche Forschungsgemeinschaft (DFG). Mikko Myrskylä was supported by the European Research Council grant 2013-StG-336475. We also acknowledge support from the Max Planck Society and the Academy of Finland. We are grateful to Riina Peltonen for help with setting up the data and to Statistics Finland for making the data available to us. The study was approved by the ethics committee of the data provider. We thank our reviewers at Demographic Research for helpful comments and suggestions.
Corrections:
References
Andreev, E.M., Shkolnikov, V.M., and Begun, A.Z. (2002). Algorithm for decomposition of differences between aggregate demographic measures and its application to life expectancies, healthy life expectancies, parity-progression ratios and total fertility rates. Demographic Research 7(14): 499–522. doi:10.40 54/DemRes.2002.7.14.
Beltrán-Sánchez, H. and Soneji, S. (2011). A unifying framework for assessing changes in life expectancy associated with changes in mortality: The case of violent deaths. Theoretical Population Biology 80(1): 38–48. doi:10.1016/j.tpb.2011.05. 002.
Blue, L. and Fenelon, A. (2011). Explaining low mortality among US immigrants relative to native-born Americans: the role of smoking. International Journal of
Epidemiology 40(3): 786–793. doi:10.1093/ije/dyr011.
Centers for Disease Control and Prevention (CDC) (2005). Annual smoking-attributable mortality, years of potential life lost, and productivity losses--United States, 1997–2001. Morbidity and Mortality Weekly Report 54(25): 625–628. Denney, J.T., Rogers, R.G., Hummer, R.A., and Pampel, F.C. (2010). Education
inequality in mortality: The age and gender specific mediating effects of cigarette smoking. Social Science Research 39(4): 662–673. doi:10.1016/j.ssrese arch.2010.02.007.
Doll, R., Peto, R., Boreham, J., and Sutherland, I. (2004). Mortality in relation to smoking: 50 years’ observations on male British doctors. BMJ 328(2455): 1519.
doi:10.1136/bmj.38142.554479.AE.
Edwards, R.D. (2011). Changes in World Inequality in Length of Life: 1970–2000.
Population and Development Review 37(3): 499–528.
doi:10.1111/j.1728-4457.2011.00432.x.
Edwards, R.D. (2013). The cost of uncertain life span. Journal of Population
Economics 26(4): 1485–1522. doi:10.1007/s00148-012-0405-0.
Edwards, R.D. and Tuljapurkar, S. (2005). Inequality in life spans and a new perspective on mortality convergence across industrialized countries. Population
and Development Review 31(4): 645–674. doi:10.1111/j.1728-4457.2005
Escobedo, L.G. and Peddicord, J.P. (1996). Smoking prevalence in US birth cohorts: the influence of gender and education. American Journal of Public Health 86(2): 231–236. doi:10.2105/AJPH.86.2.231.
Fenelon, A. and Preston, S.H. (2012). Estimating smoking-attributable mortality in the United States. Demography 49(3): 797–818. doi:10.1007/s13524-012-0108-x. Ferrence, R.G. (1989). Deadly fashion: The rise and fall of cigarette smoking in North
America. New York: Garland.
Gillespie, D.O.S., Trotter, M.V., and Tuljapurkar S. (2014). Divergence in age patterns of mortality change drives international divergence in lifespan inequality.
Demography 51(3): 1003–1017. doi:10.1007/s13524-014-0287-8.
Helakorpi, S., Martelin, T., Torppa, J., Vartiainen, E., Uutela, A., and Patja, K. (2008). Impact of the 1976 Tobacco Control Act in Finland on the proportion of ever daily smokers by socioeconomic status. Preventive medicine 46(4): 340–345.
doi:10.1016/j.ypmed.2007.11.001.
Herttua, K., Mäkelä, P., and Martikainen P. (2007). Differential trends in alcohol-related mortality: a register-based follow-up study in Finland in 1987–2003.
Alcohol and alcoholism 42(5): 456–464. doi:10.1093/alcalc/agl099.
Himes, C.L., Preston, S.H., and Condran, G.A. (1994). A relational model of mortality at older ages in low mortality countries. Population Studies 48(2): 269–291.
doi:10.1080/0032472031000147796
Ho, J.Y. and Preston, S.H. (2010). US Mortality in an International Context: Age Variations. Population and Development Review 36(4): 749–773. doi:10.1111/j. 1728-4457.2010.00356.x.
Huisman, M., Kunst, A.E., and Mackenbach, J.P. (2005). Educational inequalities in smoking among men and women aged 16 years and older in 11 European countries. Tobacco Control 14(2): 106–113. doi:10.1136/tc.2004.008573. Jha, P., Peto, R., Zatonski, W., Boreham, J., Jarvis, M.J., and Lopez, A.D. (2006).
Social inequalities in male mortality, and in male mortality from smoking: indirect estimation from national death rates in England and Wales, Poland, and North America. The Lancet 368(9533): 367–370. doi:10.1016/S0140-6736(06)6 8975-7.
Kannisto, V., Lauritsen, J., Thatcher, A.R., and Vaupel, J.W. (1994). Reductions in Mortality at Advanced Ages: Several Decades of Evidence from 27 Countries.
Kibele, E.U.B. (2012). Regional Mortality Differences in Germany. Dordrecht: Springer. doi:10.1007/978-94-007-4432-5.
Kircher, T., Nelson, J., and Burdo, H. (1985). The Autopsy as a Measure of Accuracy of the Death Certificate. New England Journal of Medicine 313(20): 1263–1269.
doi:10.1056/NEJM198511143132005.
Laaksonen, M., Uutela, A., Vartiainen, E., Jousilahti, P., Helakorpi, S., and Puska, P. (1999). Development of smoking by birth cohort in the adult population in eastern Finland 1972–97. Tobacco Control 8(2): 161–168. doi:10.1136/tc.8.2. 161.
Lopez, A.D., Collishaw, N.E., and Piha, T. (1994). A descriptive model of the cigarette epidemic in developed countries. Tobacco Control 3(3): 242. doi:10.1136/tc.3.3. 242.
MacIntyre, S. and Hunt, K. (1997). Socio-economic Position, Gender and Health.
Journal of Health Psychology 2(3): 315–334. doi:10.1177/13591053970020
0304.
Mackenbach, J.P., Huisman, M., Andersen, O., Bopp, M., Borgan, J.-K., Borrell, C., Costa, G., Deboosere, P., Donkin, A., Gadeyne, S., Minder, C., Regidor, E., Spadea, T., Valkonen, T., and Kunst, A.E. (2004). Inequalities in lung cancer mortality by the educational level in 10 European populations. European
Journal of Cancer 40(1): 126–135. doi:10.1016/j.ejca.2003.10.018.
Mackenbach, J.P., Kunst, A.E., Groenhof, F., Borgan, J.K., Costa, G., Faggiano, F., Jozan, P., Leinsalu, M., Martikainen, P., Rychtarikova, J., and Valkonen, T. (1999). Socioeconomic inequalities in mortality among women and among men: an international study. Am J Public Health 89(12): 1800–1806. doi:10.2105/AJP H.89.12.1800.
Manton, K.G. (1986). Cause Specific Mortality Patterns Among the Oldest Old: Multiple Cause of Death Trends 1968 to 1980. Journal of Gerontology 41(2): 282–289. doi:10.1093/geronj/41.2.282.
Marmot, M. (2006). Smoking and inequalities. The Lancet 368(9533): 341–342.
doi:10.1016/S0140-6736(06)68976-9.
Martikainen, P., Ho, J., Preston, S., and Elo, I. (2013). The changing contribution of smoking to educational differences in mortality: estimates for finnish men and women from 1971 to 2005. Journal of Epidemiology and Community Health
Martikainen, P., Valkonen, T., and Martelin, T. (2001). Change in male and female life expectancy by social class: decomposition by age and cause of death in Finland 1971–95. Journal of Epidemiology and Community Health 55(7): 494–499.
doi:10.1136/jech.55.7.494.
Mathers, C.D., Ma Fat, D., Inoue, M., Rao, C., and Lopez, A.D. (2005). Counting the dead and what they died from: an assessment of the global status of cause of death data. Bulletin of the World Health Organization 83(3): 171–177c.
Minaker, K.L. and Rowe, J. (1985). Health and Disease among the Oldest Old: A Clinical Perspective. The Milbank Memorial Fund Quarterly. Health and Society
63(2): 321–349. doi:10.2307/3349883.
Modelmog, D., Rahlenbeck, S., and Trichopoulos, D. (1992). Accuracy of death certificates: a population-based, complete-coverage, one-year autopsy study in East Germany. Cancer Causes and Control 3(6): 541–546. doi:10.1007/BF0005 2751.
Myrskylä, M. and Scholz, R. (2013). Reversing East-West mortality difference among German women, and the role of smoking. International Journal of Epidemiology
42(2): 549–558. doi:10.1093/ije/dyt008.
Nusselder, W.J. and Mackenbach, J.P. (1996). Rectangularization of the survival curve in The Netherlands, 1950–1992. Gerontologist 36(6): 773–782. doi:10.1093/ger ont/36.6.773.
Pampel, F.C. (2005). Diffusion, cohort change, and social patterns of smoking. Social
Science Research 34(1): 117–139. doi:10.1016/j.ssresearch.2003.12.003.
Pampel, F.C. (2011). Divergent patterns of smoking across high-income nations. In: Crimmins, E.M., Preston, S.H., and Cohen, B. (eds.). International Differences
in Mortality at Older Ages: Dimensions and Sources. Washington, DC: The
National Academies Press: 132–163.
Percy, C. and Muir, C. (1989). The international comparability of cancer mortality data. Results of an international death certificate study. American Journal of
Epidemiology 129(5): 934–946.
Peto, R., Boreham, J., Lopez, A.D., Thun, M., and Heath, C. (1992). Mortality from tobacco in developed countries: indirect estimation from national vital statistics.
Popham, F., Dibben, C., and Bambra, C. (2013). Are health inequalities really not the smallest in the Nordic welfare states? A comparison of mortality inequality in 37 countries. Journal of Epidemiology and Community Health 67(5): 412–418.
doi:10.1136/jech-2012-201525.
Preston, S.H., Glei, D.A., and Wilmoth, J.R. (2010). A new method for estimating smoking-attributable mortality in high-income countries. International Journal
of Epidemiology 39(2): 430–438. doi:10.1093/ije/dyp360.
Preston, S.H., Glei, D.A., and Wilmoth, J.R. (2011). Contribution of smoking to international differences in life expectancy. In: Crimmins, E.M., Preston, S.H., and Cohen, B. (eds.). International Differences in Mortality at Older Ages:
Dimensions and Sources. Washington, DC: The National Academies Press: 105–
131.
Rau, R., Bohk, C., Muszynska, M., and Vaupel, J.W. (2013). Rates of mortality
improvement on the Lexis surface. Visualizing Age-, Period- and Cohort-Effects.
Paper presented at the Annual Population Association of America meeting, New Orleans, LA, April 11–13 2013. doi:10.1111/j.1728-4457.2005.00065.x.
Rogers, R.G., Hummer, R.A., Krueger, P.M., and Pampel, F.C. (2005). Mortality Attributable to Cigarette Smoking in the United States. Population and
Development Review 31(2): 259–292. doi:10.4054/DemRes.2010.23.14.
Rostron, B. (2010). A modified new method for estimating smoking-attributable mortality in high-income countries. Demographic Research 23(14): 399–420.
doi:10.1111/1468-0297.00270.
Sen, A. (1998). Mortality as an Indicator of Economic Success and Failure. The
Economic Journal 108(446): 1–25.
Shkolnikov, V.M. and Andreev, E.M. (2010). Age-decomposition of a difference between two populations for any life-table quantity in Excel. Rostock: Max Planck Institute for Demographic Research (MPIDR technical report; TR-2010-002).
Shkolnikov, V.M., Andreev, E.M., Zhang, Z., Oeppen, J., and Vaupel, J.W. (2011). Losses of expected lifetime in the United States and other developed countries: methods and empirical analyses. Demography 48(1): 211–239. doi:10.1007/s135 24-011-0015-6.
Smits, J. and Monden, C. (2009). Length of life inequality around the globe. Social
Tarkiainen, L., Martikainen, P., Laaksonen, M., and Valkonen, T. (2012). Trends in life expectancy by income from 1988 to 2007: decomposition by age and cause of death. Journal of Epidemiology and Community Health 66(7): 573–578.
doi:10.1136/jech.2010.123182.
Thun, M.J., Hannan, L.M., Adams-Campbell, L.L., Boffetta, P., Buring, J.E., Feskanich, D., Flanders, W.D., Jee, S.H., Katanoda, K., Kolonel, L.N., Lee, I.M., Marugame, T., Palmer, J.R., Riboli, E., Sobue, T., Avila-Tang, E., Wilkens, L.R., and Samet, J.M. (2008). Lung Cancer Occurrence in Never-Smokers: An Analysis of 13 Cohorts and 22 Cancer Registry Studies. PLoS Med
5(9): e185. doi:10.1371/journal.pmed.0050185.
Thun, M.J., Henley, S.J., Burns, D., Jemal, A., Shanks, T.G., and Calle, E.E. (2006). Lung Cancer Death Rates in Lifelong Nonsmokers. Journal of the National
Cancer Institute 98(10): 691–699. doi:10.1093/jnci/djj187.
Tuljapurkar, S. (2010). The final inequality: variance in age at death. In: Shoven, J.B. (ed.). Demography and the Economy. Chicago: University of Chicago Press: 209–226.
Tuljapurkar, S., Li, N., and Boe, C. (2000). A universal pattern of mortality decline in the G7 countries. Nature 405(6788): 789–792. doi:10.1038/35015561.
Valkonen, T. (1993). Problems in the measurement and international comparison of socio-economic differences in mortality. Social Science & Medicine 36(4): 409– 418. doi:10.1016/0277-9536(93)90403-Q.
van Raalte, A.A. and Caswell, H. (2013). Perturbation analysis of indices of lifespan variability. Demography 50(5): 1615–1640. doi:10.1007/s13524-013-0223-3. van Raalte, A.A., Kunst, A.E., Deboosere, P., Leinsalu, M., Lundberg, O., Martikainen,
P., Strand, B.H., Artnik, B., Wojtyniak, B., and Mackenbach, J.P. (2011). More variation in lifespan in lower educated groups: evidence from 10 European countries. International Journal of Epidemiology 40(6): 1703–1714.
doi:10.1093/ije/dyr146.
van Raalte, A.A., Martikainen, P., and Myrskylä, M. (2014). Lifespan variation by occupational class: compression or stagnation over time? Demography 51(1): 73–95. doi:10.1007/s13524-013-0253-x.
Vaupel, J.W. and Canudas Romo, V. (2003). Decomposing Change in Life Expectancy: A Bouquet of Formulas in Honor of Nathan Keyfitz’s 90th Birthday.
Vaupel, J.W., Zhang, Z., and van Raalte, A.A. (2011). Life expectancy and disparity: an international comparison of life table data. BMJ Open 1(1): 1–6. doi:10.1136/bm jopen-2011-000128.
Wilmoth, J.R., Andreev, K., Jdanov, D., and Glei, D. (2007). Methods protocol for the Human Mortality Database, version 5. Berkeley, CA, and Rostock: University of California at Berkeley and Max Planck Institute for Demographic Research (Technical report).
Wilmoth, J.R. and Horiuchi, S. (1999). Rectangularization Revisited: Variability of Age at Death within Human Populations. Demography 36(4): 475–495. doi:10.2307/ 2648085.
Zhang, Z. and Vaupel, J.W. (2009). The age separating early deaths from late deaths.
Appendix
Table A-1: Standard deviation at age 50 (𝑺𝟓𝟎) for the different occupational
classes in Finland. The “difference” category is the increase in 𝑺𝟓𝟎
attributable to smoking.
Upper non-manual Lower non-manual Manual
Observed Removing smoking Difference Observed Removing smoking Difference Observed Removing smoking Difference
Men
1971–1975 10.3 10.6 0.2 10.4 10.6 0.3 10.2 10.7 0.5
1976–1980 10.5 10.8 0.3 10.4 10.8 0.4 10.4 11.1 0.7
1981–1985 10.5 10.7 0.3 10.4 10.9 0.4 10.5 11.2 0.7
1986–1990 10.5 10.6 0.3 10.5 10.9 0.4 10.6 11.3 0.7
1991–1995 10.4 10.5 0.2 10.3 10.7 0.4 10.7 11.3 0.6
1996–2000 10.3 10.4 0.2 10.4 10.7 0.3 10.9 11.4 0.5
2001–2005 10.2 10.5 0.2 10.7 11.0 0.3 11.1 11.6 0.5
2006–2010 10.2 10.4 0.2 10.8 11.2 0.3 11.4 11.9 0.5
Women
1971–1975 9.7 9.6 0.0 9.8 9.8 0.0 9.7 9.7 -0.1
1976–1980 9.9 9.8 -0.1 9.9 9.9 -0.1 10.0 9.9 -0.1
1981–1985 9.9 9.9 0.0 9.9 9.9 -0.1 9.9 9.8 -0.1
1986–1990 9.9 9.8 0.0 9.8 9.7 0.0 10.1 10.0 -0.1
1991–1995 9.8 9.7 0.0 9.7 9.6 -0.1 10.0 9.9 -0.1
1996–2000 9.6 9.6 0.0 9.7 9.7 0.0 10.1 10.1 -0.1
2001–2005 9.6 9.6 0.0 9.9 9.8 0.0 10.4 10.2 -0.2