DEMOGRAPHIC RESEARCH
VOLUME 32, ARTICLE 22, PAGES 657
−
690
PUBLISHED 4 MARCH 2015
http://www.demographic-research.org/Volumes/Vol32/22/ DOI: 10.4054/DemRes.2015.32.22
Research Article
The timing of family commitments in the early
work career: Work-family trajectories of young
adults in Flanders
Suzana Koelet
Helga de Valk
Ignace Glorieux
Ilse Laurijssen
Didier Willaert
©2015 Koelet,de Valk, Glorieux, Laurijssen &Willaer . This open-access work is published under the terms of the Creative Commons Attribution NonCommercial License 2.0 Germany, which permits use, reproduction & distribution in any medium for non-commercial purposes, provided the original author(s) and source are given credit.
1 Introduction 658
2 The complex interplay between education, family, and work 659
3 Data and methods 662
4 A typology of life paths among young adults 664
5 Explaining different life paths: Variables 673
5.1 Education 674
5.2 Practical constraints 675
5.3 Methods 676
6 Explaining different life paths: Results 677
6.1 Pooled analyses for men and women (4 clusters) 677
6.2 Separate analyses for women (6 clusters) 680
7 Conclusions 681
The timing of family commitments in the early work career:
Work-family trajectories of young adults in Flanders
Suzana Koelet1,2
Helga de Valk3,4
Ignace Glorieux2
Ilse Laurijssen2
Didier Willaert3
Abstract
OBJECTIVE
This article examines the diverse ways in which young adults develop both their professional career and family life in the years immediately after they complete their education. Building a career and starting a family often occur simultaneously in this stage of life. By studying the simultaneous developments in these life domains, we can gain a better understanding of this complex interplay.
METHODS
The data consist of a sample of 1,657 young adults born in 1976 who were interviewed as part of the SONAR survey of Flanders at ages 23, 26, and 29 about their education, their entry into and early years on the labour market, and their family life. Sequence analysis is used to study the timing of union formation and having children among these young adults, as well as how these events are related to their work career. Multinomial regression analysis is applied to help us gain a better understanding of the extent to which these life course patterns are determined by education and economic status at the start of the career.
RESULTS
The results reveal a set of work-family trajectories which vary in terms of the extent of labour market participation and the type and timing of family formation. Various aspects of the trajectory are found to be determined by different dimensions of an
1 Interface Demography, Department of Sociology, Vrije Universiteit Brussel, Belgium.
E-Mail: [email protected].
2 Research group TOR, Department of Sociology, Vrije Universiteit Brussel, Belgium. 3
individual’s educational career (duration, level, field of study). Education is more relevant for women than for men, as a man’s trajectory is more likely than a woman’s to be determined by the first job.
CONCLUSIONS
By using a simultaneous approach which takes into account both family and work, this life course analysis confirms that men have a head start on the labour market, and examines the factors which influence the distinct trajectories of young women and men.
1. Introduction
In this article we study the timing of family commitments in the early work careers of young adults using sequence analyses. Gaining insight into the ways in which family formation and career building coincide and interact with each other in this life stage can help us better understand the choices and (future) positions of women and men in the labour market. The difficulties associated with combining work and family in this particular period of life may lead young men and women to make decisions which can have far-reaching consequences (Moen and Sweet 2004), both in terms of their work career (e.g., deciding to take a career break or to work part time) and their family life (e.g., delaying parenthood). Studying trajectories allows us to link different transitions between work and family life, while taking the duration of each state into account (Stone, Netuveli, and Blane 2007).
In addition to identifyingthe main work-family trajectories among young women and men, we also aim to explain the differences and similarities between these trajectories. According to the literature, the heterogeneity in life courses is attributable to socio-structural and cultural factors, or to subjective factors and preferences (Aassve, Billari, and Piccarreta 2007; McRae 2003). Education seems to play a crucial role, as a wide range of studies have shown that an individual’s educational level can affect (the timing of) his or her family formation decisions and labour outcomes (Anderson, Binder, and Krause 2002, 2003; Budig and Hodges 2010; Dex et al. 1998; Gustafsson 2003; Liefbroer and Corijn 1999; Rindfuss, Morgan, and Offutt 1996). The amount of time young people spend in education or a field of education has been studied to a lesser extent, but the existing work has indicated that this factor is also non-negligible (Blossfeld and Huinink 1991; Hank 2002; Hoem 1986; Kalmijn 1996; Kreyenfeld 2000; Lappegård 2002; Lappegård and Rønsen 2005; Van Bavel 2010).
account, and also include information on the life stage of each individual’s partner in explaining his or her work-life trajectory. These factors are treated as practical constraints that mould the path of each young adult. Second, although the literature has mainly captured the consequences of family formation for women, we include both men and women in our study. We analyse how the typical life course and the factors leading to various work-life trajectories differ by gender.
We focus on Flanders, using unique panel data which follow young adults through their family formation and career building years. These unique data can be seen as a case study, and as a starting point for further analyses in other societal contexts.
2. The complex interplay between education, family, and work
Only a few decades ago, family and work constituted two parallel worlds in most north-western European countries. Women were mostly oriented towards family life. Once married, they were expected to stop participating in the labour force and to become full-time mothers and housekeepers. Meanwhile, men were oriented towards the work sphere, and were expected to provide financially for their family. Both the average age at marriage and the average age at the birth of the first child were low, as women married and had children soon after completing their education (Esping-Andersen 2009).
The rapid expansion of education and the availability of modern birth control changed these traditional gender roles. As a result of the expansion of education, the opportunity costs for mothers to stay at home and take care of the children rose (Becker 1985). But while women increasingly entered the labour force, men did not enter the private sphere of household work and childcare in equal numbers (for Flanders, see, e.g., Koelet 2005). Esping-Andersen (2009) refers to this as the incomplete revolution; i.e., a sub-optimal development that inevitably led to disequilibria in family life.
Today, young men and women are juggling their responsibilities in an effort to find a workable equilibrium between their multiple roles. Work and other pressures tend to pile up in this early life stage (Glorieux et al. 2010; Laurijssen and Glorieux 2010; Moen and Sweet 2004). As a consequence, many couples, especially those with children, are increasingly adopting what might be described as a neo-traditional arrangement, in which the career of the male partner takes priority over that of the female partner (Koelet 2005).
2011). For women, by contrast, a marriage penalty has been identified with respect to both earnings and promotions (Cobb-Clark and Dunlop 1999). Although recent studies have shown that positive selection explains a large part of the male marriage premium (Petersen, Penner, and Hogsnes 2011), the female marriage penalty is found to reflect the increased specialisation of women in home production and childcare after marriage (Ginther and Sundström 2010).
Similarly, women, unlike men, experience systematic career disadvantages when they enter parenthood. This is often referred to as the child penalty, motherhood
penalty, or family gap. Mothers earn less on the labour market than women without
children, even after controlling for factors such as human capital, labour experience, and part-time work (Waldfogel 1997; Taniguchi 1999; Budig and England 2001; Anderson, Binder, and Krause 2002; Fernández-Kranz, Lacuesta, and Rodriguez-Planas 2010). Mothers have less supervisory authority (Rosenfeld, Van Buren, and Kallberg 1998) and their odds of promotion are reduced (Cobb-Clark and Dunlop 1999). Many women decide to work part time or stay home full time after the birth of a child (e.g., Kan 2007; Klerman and Leibowitz 1999; Laurijssen 2012).
While it is clear that family commitments can significantly influence the careers of men and women in various ways, it is equally apparent that work can influence family life. For example, having high earnings and strong socio-economic prospects increases the likelihood that a young man will marry (Oppenheimer 2003), and the stability of his work career may determine at least in part the timing of his marriage (Oppenheimer 1988). Meanwhile, being unemployed may be expected to delay the point at which a young man starts a family, particularly in Belgium (Liefbroer and Corijn 1999). For a woman, the expected cost of having children on her labour market career may be expected to influence both the number of children she has and the timing of their births, according to Becker’s fertility model (1985). Research by Liefbroer (2005) has found effects on the timing of entry into parenthood for both men and women. His results suggest that it is important to consider the characteristics of the partner as well, as having a steady partner, and the partner’s characteristics in terms of labour market position and life course stage, are conditioning factors.
events. For our study, we focus on the ways in which education can influence an individual’s work-life balance over his or her life course.
Educational level determines the speed and immediacy which with an individual enters the labour market and finds employment. This holds for many contexts, and is especially the case in Belgium (Kogan and Schubert 2003: 3). Recent graduates with high levels of educational attainment tend to enter occupations with significantly higher earnings and status than average (Kogan and Schubert 2003). This in turn influences both the occurrence and the timing of marriage and parenthood, as discussed above. The potential impact of having children on earnings and promotion opportunities is greater for highly educated women than for women with less education (Anderson, Binder, and Krause 2002, 2003). Thus, compared to less educated women, highly educated women may be expected to postpone childbearing for longer periods to minimise the impact on their work career (Taniguchi 1999; Drolet 2002; Gustafsson 2003; Miller 2011). At the same time, highly educated women in well-paid jobs may have more flexibility than less educated women to combine work and family, as they are more likely to have the resources to outsource care (Budig and Hodges 2010). Education is therefore often considered the main factor in whether a woman continues to work after having children (Dex et al. 1998; Budig and Hodges 2010).
The fact that women increasingly have high levels of education also implies that, on average, women spend more years in education than in the past. Despite this trend, combining motherhood and participation in education is still not broadly accepted. Blossfeld and Huinink (1991) have argued that it is these transition norms in combination with the increased period spent in education which result in a delay in motherhood. A number of studies have shown that after graduating, highly educated women have their first child more quickly than less educated women because they feel their reproductive period has been greatly curtailed by the years they spent in education (Blossfeld 1995; Gustafsson, Kenjoh, and Wetzels 2002; Gustafsson 2005; Hank 2002; Kravdal 1994; Lappegård and Rønsen 2005; Liefbroer and Corijn 1999; Skirbekk, Kohler, and Prskawetz 2004).
of study may reflect not only distinct preferences and priorities, but also differences in opportunity costs (Lappegård and Rønsen 2005). Each discipline leads to specific occupations or employment sectors with working conditions which are more or less compatible with childbearing and childrearing. The economic opportunity costs associated with a career break may thus vary from sector to sector, and women in different sectors may need varying amounts of time after completing school to get a good foothold in the labour market (Lappegård and Rønsen 2005).
3. Data and methods
Our data consist of a sample of 1,657 women and men from the Flemish longitudinal SONAR study. These young adults were born in 1976, and were interviewed at ages 23, 26, and 29 about their educational path, as well as about their entry into the labour market and their early years of work. In each interview, information on their current situation was gathered and supplemented by retrospective data on their past labour market experiences and family career. Using this approach, we were able to trace each life course transition in terms of education, work, and family to the exact month between the ages of 12 and 29. We limited our analysis to the respondents’ experiences between ages 14 and 29 (=181 time registrations), and excluded 59 respondents with incomplete information.
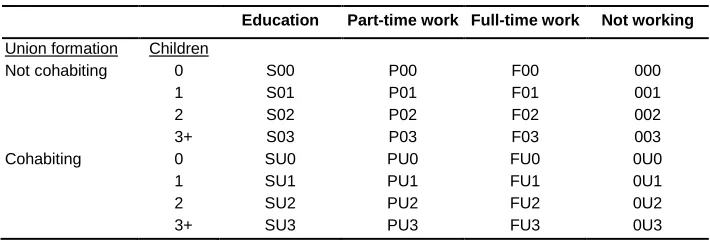
In order to create individual work-family trajectories for all of the respondents in the sample, we combined three sequences referring to transitions related to (1) work, (2) union formation, and (3) fertility (cf. Aassve, Billari, and Piccarreta 2007). Our data allow for a relatively5 detailed classification of each respondent’s working career. We distinguish between periods of initial or higher education (S), periods of part-time work (<100%) (P), periods of full-time work (F), and periods of not working (not in initial or higher education, nor in paid work) (0). As our focus is primarily on work and family, a respondent who left education at a certain point, but returned to education later while not in a paid job, is labelled as not working. Respondents on a full-time career break or on parental leave are also labelled as not working. In our analysis, union formation refers to the exact moment when a couple starts living together, with two possible states: ―U‖ refers to living together with a partner, while ―zero‖ indicates that this young adult is not (yet) cohabiting. In order to measure the presence of children, we distinguish between the number of children (zero, one, two, and three or more). Combining all statuses results in 32 possible situations (Table 1). Juxtaposing these statuses for 181 time registrations (months) gives us the individual sequences
5
describing the work-family trajectories of these Flemish young adults between the ages of 14 and 29.
Table 1: Possible life course states
Education Part-time work Full-time work Not working
Union formation Children
Not cohabiting 0 S00 P00 F00 000
1 S01 P01 F01 001
2 S02 P02 F02 002
3+ S03 P03 F03 003
Cohabiting 0 SU0 PU0 FU0 0U0
1 SU1 PU1 FU1 0U1
2 SU2 PU2 FU2 0U2
3+ SU3 PU3 FU3 0U3
Source: SONAR c76(23-26-29)
A general overview of the trajectories for all of the respondents in the sample can be found in Figure 1. The graph shows the proportion of young adults in the various states. The different colours refer to the labour market position (columns in Table 1; blue = education, grey = part-time work, red = full-time work, green = not working). The intensity of the colours indicates how far they have progressed in terms of family formation (rows in Table 1; light colours = no family formation, dark colours = advanced family formation with partner and children). We have omitted the first three years (age 14 to age 16) of observation in the graph since these years were almost uniformly spent in education, not cohabiting, and without children. Figure 1 corresponds to the so-called ―normative‖ or standard life pattern (Hogan 1978). Generally, young adults start a full-time job almost immediately after graduation, then marry or cohabit, and then have children.
Starting from the individual sequences we constructed a typology of work-family trajectories by applying optimal matching (OM) (Abbott and Forest 1986; Abbott and Hrycak 1990; Abbott and Tsay 2000; Abbott 1984; Lesnard 2006; and more specifically for the analysis of work-family trajectories Aassve, Billari, and Piccarreta 2007). This method determines the distance between each pair of sequences for the subjects in the sample which expresses how difficult it is for one sequence to be transformed into another6. The result is a distance matrix which is used for the cluster
6 Transformation costs for substitutions were calculated based on the frequency at which transitions from one
analysis of the most similar work-family trajectories. This cluster analysis gave a nine-cluster solution7. As some of these clusters differed only in terms of the amount of time spent in education, we merged several clusters to create six clusters.
Figure 1: Work-family trajectories of young adults in Flanders, by age (17−29 years)
Source: SONAR c76(23-26-29)
Below we give a detailed description of the six clusters. The description is guided by cluster-specific graphs similar to those in Figure 1. Two graphs, one for men and one for women, are shown for each cluster.
4. A typology of life paths among young adults
The first four clusters of the found typology (i.e., the first eight graphs) (see Figures 2 to 5) are characterised by a long period of education followed by a long period of mainly full-time labour market participation, which is only very occasionally
7 Cluster analyses using the Ward criterion were used. A solution with nine clusters explains about 32% of the
interrupted by brief periods of unemployment or part-time work. More than 80% of the Flemish young adults experienced this type of work trajectory (Table 2). But the respondents’ experiences in relation to family formation differed.
The young adults in the first two clusters (Figures 2 and 3) had almost no or very few family responsibilities during their early work career (cf. the light colouring in Figures 2 and 3). We have labelled them the unconstrained workers and the initially
unconstrained workers. They represent almost half of the 29-year-olds (48%), but are
primarily men. More than six out of 10 men, but only three out of 10 women, experienced an (initially) unconstrained work trajectory before age 29. The main difference between the unconstrained workers and the initially unconstrained workers
is in the timing of family formation. About one in four (28%) of the 29-year-olds had started working full time after graduation and were still single (i.e., unconstrained workers) (Figure 2). A total of 37% of year-old men, compared with 18% of 29-year-old women, had the opportunity to build a career in their early years on the labour market without having (direct) family responsibilities. Initially unconstrained workers, on the other hand, were also able to acquire some labour market experience without having family responsibilities, but eventually settled down with a partner (Figure 3). However, this latter group of young adults had not progressed to parenthood by the age of 29. This path was also followed by more men than women (26% versus 14%).
Family formation manifests itself much earlier in the work trajectories of the young adults in the next two clusters (hence the more intense colouring in Figures 4 and 5). We have labelled them the partner-constrained workers and the family-constrained
workers. The family formation of partner-constrained workers is limited to union
Figure 2: Work family trajectories of unconstrained workers (Cluster 1, ages 17-29, Flanders)
2A. Women
2B. Men
Figure 3: Work family trajectories of initially unconstrained workers (Cluster 2, ages 17-29, Flanders)
3A. Women
3B. Men
Figure 4: Work family trajectories of partner- constrained workers (Cluster 3, ages 17-29, Flanders)
4A. Women
4B. Men
Figure 5: Work family trajectories of family-constrained workers (Cluster 4, ages 17-29, Flanders)
5A. Women
5B. Men
Figure 6: Work family trajectories of initially unconstrained part-time workers (Cluster 5, ages 17-29, Flanders)
6A. Women
6B. Men
Figure 7: Work family trajectories of the family-constrained with mixed work-family strategies (Cluster 6, ages 17-29, Flanders)
7A. Women
7B. Men
The final two clusters stand out in terms of labour market participation. Full-time work played a less important role in these trajectories (cf. less red in Figures 6 and 7). Besides being the most female-dominated of the clusters in the analysis (25% of women and 9% of men followed these paths), they are also the most heterogeneous. A characterisation of the clusters according to their ―medoid sequence‖ is therefore appropriate (see Table 2). The medoid sequence is the individual sequence least distant from all of the other sequences in the cluster. The respondents in the first of these two clusters generally had difficulties finding a first job, and had longer intervals of part-time work (Figure 6). This part-part-time work does not appear to have been related to childcare. Only a small share of the 29-year-olds in this group had children, and they had become parents only very recently. Family formation was mainly limited to union formation. Most of the respondents were in part-time work before they started a family. This cluster is labelled as initially unconstrained part-time workers.
The deviation from the full-time work pattern seems to be more clearly linked with family formation in the last cluster (Figure 7). This group stands out for their early family formation with children, which resulted in this group having a higher number of children than the cluster of family-constrained workers. The strategies for handling this combination of work and family are diverse (see the large variance in Table 2), and include longer periods of not working or working part time, at least for women. Among the latter cluster we find mothers with fragmented labour market participation, stay-at-home mothers, women who started working part time after having children, as well as many single mothers. The name of the cluster is derived from this diversity:
family-constrained with mixed work-family strategies. While 11% ofall 29-year-old women
Table 2: Short description of the six work-family trajectories (N=1598)
Cluster Short description + medoid Variance* % T % ♂ % ♀
UW Unconstrained worker
Full-time worker, no family formation Medoid: (S00,115)-(F00,66)
51 28% 37% 18%
IUW Initially unconstrained worker
Full-time worker, initial labour market experience without family formation, eventually union formation, hardly any children (yet)
Medoid: (S00,114)-(000,2)-(F00,32)-(FU0,33)
61 20% 26% 14%
PW Partner-constrained worker
Full-time worker, early union formation without children
Medoid: (S00,100)-(F00,18)-(FU0,63)
44 14% 13% 14%
FW Family-constrained worker
Full-time worker, early family formation with children
Medoid: (S00,107)-(000,2)-(F00,11)-(FU0,37)-(FU1,24)
82 22% 16% 28%
IUPW Initially unconstrained part-time worker
Longer periods of part-time work, initially without family formation Medoid: (S00,86)-(000,30)-(F00,9)-(P00,36)-(PU0,20)
93 11% 7% 14%
FM Family-constrained with mixed work-family strategies
Mixed work and family strategies, early family formation with children Medoid: (S00,65)-(000,6)-(0U0,6)-(0U1,43)-(0U2,32)-(PU2,29)
114 6% 2% 11%
Source: SONAR c76(23-26-29)
* Minimal distance = 0; Maximal distance = 362; Mean distance = 173
5. Explaining different life paths: Variables
specific path. Furthermore, we want to know whether these influences varied between men and women. We start with a description of the variables in our analysis.
5.1 Education
The first three variables in our analysis are related to education. In the SONAR study, respondents were asked about their current studies and their educational paths since the last interview. From this information, three educational variables were distilled, referring to the three dimensions discussed earlier: educational level, time in education, and field of study. Basic descriptive statistics for these variables can be found in Table 3, together with the reference category for each of the variables.
Educational level refers to the highest diploma obtained as of age 29. Since the research population of the SONAR study is relatively young (cohort 1976), the level of education in the group is relatively high (see Table 3). Moreover, highly educated young adults are overrepresented in the SONAR study. The percentage of 30- to 34-year-olds with a higher education in the Flemish population in 2005 was 40%, whereas 54% of the 29-year-olds in the SONAR study had a tertiary degree. Educational level is reduced to four categories for analyses: no diploma or primary education, secondary education, non-university tertiary education, and university-level higher education.
The number of years enrolled in education is measured starting from the first month in secondary school (around the age of 12) until the first month the student left education for (1) at least a year, or (2) left education for one month and started working or looking for a job immediately thereafter. Since the number of years in education and the educational level are closely related (eta=0.769; p=0.000), we include the residual effect of duration of education in our analyses. To do this, we deduct the number of years in education as estimated by educational level from the actual number of years spent in education. The resulting variable refers to the extra number of years spent in education for obtaining a specific educational level. There are a number of possible reasons for this ―delay‖ (e.g., repeating a year, longer or shorter courses in higher education, or students accumulating various same-level diplomas). The obtained variable allows us to study the effect of time spent in education over and beyond the effect of educational level.
category, and those related to law and legal services were assigned to private and public administration (cf. the field of social sciences, business, and law in the CEDEFOP adaptation of Andersson and Olsson 1999). As these categories refer to the last year before leaving education, this information could be included for all young adults, irrespective of whether a diploma was obtained. If none of the five areas of study could be assigned, the variable was defined and included in the analyses as missing (N=80).
5.2 Practical constraints
Two indicators are used for measuring the difficulties respondents faced in finding a first job, and the prestige of this first job. The duration until the first (stable) job is measured by the number of months between leaving education and finding a job with a permanent contract, or which lasted for at least six months. Because we want to measure job uncertainty at the start of the career, we only consider the first year after education (6% of all respondents had not found a stable job within this time frame). To measure the prestige of the first job, the occupations were coded according to the Occupational Classification 1992 of Statistics Netherlands (SBC 92). These codes were then converted to the occupational prestige scale developed by Sixma and Ultee (1983), which reaches a minimum of 13 and a maximum of 87 within our sample.
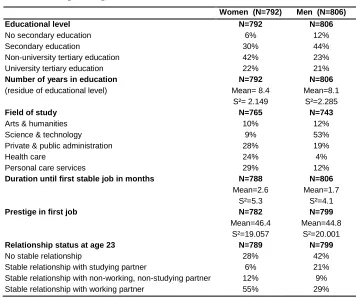
Table 3: Descriptive statistics of the independent variables in the multinomial logistic regressions
Women (N=792) Men (N=806)
Educational level N=792 N=806
No secondary education Secondary education
Non-university tertiary education University tertiary education
6% 30% 42% 22% 12% 44% 23% 21%
Number of years in education
(residue of educational level)
N=792 Mean= 8.4 S²= 2.149 N=806 Mean=8.1 S²=2.285
Field of study N=765 N=743
Arts & humanities Science & technology Private & public administration Health care
Personal care services
10% 9% 28% 24% 29% 12% 53% 19% 4% 12%
Duration until first stable job in months N=788
Mean=2.6 S²=5.3
N=806
Mean=1.7 S²=4.1
Prestige in first job N=782
Mean=46.4 S²=19.057
N=799
Mean=44.8 S²=20.001
Relationship status at age 23 N=789 N=799
No stable relationship
Stable relationship with studying partner
Stable relationship with non-working, non-studying partner Stable relationship with working partner
28% 6% 12% 55% 42% 21% 9% 29%
Source: SONAR c76(23-26-29)
5.3 Methods
interaction term with gender into the pooled analyses. As the sample sizes do not allow us to separately analyse the initially unconstrained part-time workers (IUPW) and those with mixed work-family strategies (FM), these pooled first models (Table 4) are restricted to four clusters (UW, IUW, PW, and FW). We will then estimate models for women separately with all six clusters (Table 5), which should allow us to gain a better understanding of the factors leading to the non-full-time trajectories.
6. Explaining different life paths: Results
6.1 Pooled analyses for men and women (4 clusters)
In the discussion of the pooled analyses (Table 4), we start by comparing the partner-constrained workers with the family-partner-constrained workers. Both clusters were characterised by early family formation, but the timing of parenthood differed. Contrasting the two pathways tells us about the factors which affect the postponement of parenthood early in the career (Model 1a). Here we did not immediately observe significant differences between men and women. Overall, young adults with a tertiary degree seem to have had higher odds of delaying parenthood than young adults with a secondary school diploma or less. This indicates that the highly educated were following a maximisation strategy, while the less educated proceeded much more quickly to parenthood after moving in with a partner. The same pattern of early parenthood was observed more regularly among young adults in female-dominated areas of study such as health care or personal care, which confirms the results of Van Bavel (2010).
The odds of belonging to the group of unconstrained workers, rather than to the group of family-constrained workers, tell us more about how the two extremes of no family commitment versus full family commitment in the early career were related. Extra time spent in education raised the odds of having had an unconstrained rather than a family-constrained trajectory (or the other way around; see above). This trajectory was also more common (than the family-constrained trajectory) among young men who pursued studies in the arts and humanities.
Table 4: Pooled multinomial logistic regression model (4 clusters)
1a: Education (Nagelkerke=0.194; N=1255)
1b: Education & practical constraints (Nagelkerke=0.484; N=1231) UW/FW Exp(B) IUW/FW Exp(B) PW/FW Exp(B) UW/FW Exp(B) IUW/FW Exp(B) PW/FW Exp(B)
Sex (Ref: Women) 2.155 1.400 2.169 2.403 1.952 .448
Educational level (Ref: University) No secondary Secondary Non-university tertiary 0.286 0.497 0.540 0.089 0.395 0.282 0.419 0.344 0.971 1.034 0.683 1.011 .222 .667 .439 .382 .283 .974
Years in education (residue) 1.417 1.273 0.929 1.362 1.262 .935
Field of study (Ref: Personal care) Arts & humanities
Science & technology Public & Private administration Health care 1.073 1.428 1.228 1.042 2.320 2.164 1.751 0.699 2.553 3.143 3.219 1.477 1.165 2.623 1.502 1.539 2.811 2.980 2.109 .758 2.781 3.615 3.771 1.424 Educational level*Sex No secondary*Sex Secondary*Sex Non-univ. tertiary*Sex 1.159 1.626 2.138 8.916 2.724 5.500 .626 1.774 2.709 .589 2.089 1.649 7.952 3.062 5.209 2.097 4.960 3.960
Years in education*Sex .825 .916 1.001 .783 .853 .913
Field of study*Sex
Arts & humanities*Sex Science & technology*Sex Pub. & Priv. administration*Sex Health care*Sex 5.165 .822 1.446 1.536 1.211 .451 2.872 .881 1.001 .372 .283 .568 2.509 .358 .714 .996 .612 .259 2.694 .653 .690 .220 .264 .408
Duration until first stable job (months) 1.076 1.021 1.006
Prestige in first job (0-100) 1.002 1.008 .998
Relationship status at 23 (Ref: Stable relationship with working partner) No stable relationship
Stable with studying partner
Stable with non-working/ studying partner
26.162 1.235 4.175 5.126 .405 4.391 1.370 .680 1.125
Duration until first stable job*Sex .920 .854 .944
Prestige in first job*Sex .994 .991 1.026
Relationship status at 23*Sex No stable relationship*Sex Stable with studying partner*Sex
Stable with non-working, non-studying partner*Sex
6.325 .816 2.238 4.907 1.430 1.063 2.773 1.521 1.086
Source: SONAR c76(23-26-29)
It is clear that all three dimensions of education—educational level, number of years in education and field of study—were relevant to the type of work-family trajectory young adults followed in their early careers. Moreover, it appears that each of these dimensions influenced other aspects of this trajectory. In a next step, we introduced practical constraints into the analysis in order to find out how these factors affected each respondent’s work-life trajectory and its relationship to education (Table 4 – Model 1b). Among women, their employment opportunities at the start of their career did not seem to influence their work-family trajectory. By contrast, men who found their first job quickly seem to have prioritised building a career over starting a family, at least at first (IUW vs. FW). Among men, the higher the prestige of their first job, the higher the probability that the transition to parenthood was delayed (PW vs. FW); although this interaction effect with sex did not scrape past the significance level (p=0.066). The effect of relationship status at age 23 was important for both sexes. It is evident that not having a stable partner at the age of 23 diminished the odds of residential union formation early in the work career (even more so for men than for women, probably due to age differences in the couple). But it is especially interesting to note that the life stage of the partner was also a decisive factor. Having a stable relationship with a partner who was still in education diminished the odds of early union formation. If the partner had already completed his or her education, it did not seem to matter whether he or she had a paid job.
6.2 Separate analyses for women (6 clusters)
The separate analyses for women allowed us to include the initially unconstrained part-time workers and the family-constrained with mixed work-family strategies (Table 5). These two clusters were relevant for women only, as they included only a small number of men. To ensure that we had a sufficient number of cases in all of the categories for this more limited group, we had to slightly redefine two independent variables. First, for the variable of field of study we combined the male-dominated areas of science and technology and public and private administration into a single category, and the female-dominated areas of personal care and health care into another category. Second, for the variable of relationship status we combined those respondents without a partner at age 23 with those whose partner was studying. Since the findings for the first four clusters were similar to those we described above (see Table 4), we focus here on the unconstrained part-time workers and the family-constrained with mixed work-family strategies.
One difficulty that arises when comparing the initially unconstrained part-time workers with the family-constrained workers is that they differed in terms of both their work and their family trajectory. The relative odds of belonging to the first cluster are higher for less educated women. Compared to highly educated women, women with a secondary education or less were three to five times more likely to have been initially unconstrained part-time workers rather than family-constrained workers. The trajectory showed no specific links with the area of study or the number of years in education.
The constrained workers with mixed work-family strategies and the family-constrained workers were the two groups who had children early in their career path, but who used different strategies for combining children and work. When we compared these groups, it became clear that the educational level played a large role. This finding confirms the importance of education in ensuring women’s job continuity after motherhood. Women with a secondary education were 19 times more likely than women with a university degree to have applied mixed work-family strategies rather than to have continued working (mainly) full time if they had children relatively soon after leaving education. Among women with less than a secondary education diploma, the odds of having used these strategies were 73 times higher. The length of time spent in education was shown to have mattered as well. The longer a young woman spent in education, the more likely she was to have continued working (mainly) full time if she had entered parenthood soon after completing her education.
Table 5: Multinomial logistic regression model for women (6 clusters)
2a: Education (N=765; Nagelkerke=0.361)
2b: Education & practical constraints (N=748; Nagelkerke=0.518) UW/FW Exp(B) IUW/FW Exp(B) PW/FW Exp(B) IUPW/FW Exp(B) FM/FW Exp(B) UW/FW Exp(B) IUW/FW Exp(B) PW/FW Exp(B) IUPW/FW Exp(B) FM/FW Exp(B) Educational level (Ref: University)
No diploma secondary 0.274 0.088 0.365 4.862 73.342 0.689 0.185 0.305 4.252 22.002
Secondary 0.493 0.380 0.331 2.956 19.201 0.838 0.707 0.268 2.108 7.314 Non-university tertiary 0.551 0.292 0.945 1.110 0.437 1.034 0.471 0.952 1.307 0.365
Number of years in
education (residue) 1.384 1.221 0.923 0.959 0.578 1.283 1.182 0.927 0.995 0.658
Field of study (Ref: Health & personal care)
Arts & Humanities 1.007 2.727 2.149 2.020 0.430 0.709 2.765 2.345 1.534 0.379 Science & Technology & Public
and Private administration 1.219 2.219 2.699 0.807 0.656 1.171 2.433 3.131 0.726 0.616
Relationship status at 23 (Ref: Stable relationship with working partner) No stable relationship or with
studying partner 19.002 4.491 1.191 3.862 0.712 Stable relationship with
non-working, non-studying partner 1.316 0.438 0.692 1.539 1.346
Duration until first stable job
(months) 1.137 1.056 1.020 1.183 1.178 Prestige in first job (0-100) 1.002 1.011 0.998 0.993 0.980
Source: SONAR c76(23-26-29)
Note: Significance levels: underlined: p<0.05; bold: p<0.01/ Clusters: UW=unconstrained worker, IUW=initially unconstrained worker, PW=partner-constrained worker, FW=family-constrained worker.
7. Conclusions
When we compared the trajectories of men and women, the gendered nature of the life paths was immediately apparent. The timing of family commitments in the working career was very different for men than for women. Educational homogamy and age differences in couples offered men a head start professionally, as they were more likely than women to have had the opportunity to develop their career without having family responsibilities. Among the 29-year-olds studied, 63% of the men but only 32% of the women fell into the category of unconstrained or at least initially unconstrained full-time workers. About one out of four (28%) women but only 16% of men combined having a full-time job with having a partner and children very soon after entering the labour market. Meanwhile, 11% of women but only 2% of men combined having periods of part-time work and/or not working with having large and early family commitments.
young adults emerge from interactions of the individual, the couple, and the policy context, additional couple data (to disentangle the effect of, for example, educational homogamy and age difference) are badly needed, and should thus be included in new data collection efforts.
Second, our results do not confirm the findings of the literature, which suggest that highly educated women proceed to motherhood much faster than less educated women after they finish their education (i.e., norm transgression hypothesis). On the contrary, a positive relationship was found between the amount of time spent in education and the later timing of cohabitation (for both men and women), which again points towards maximisation strategies. The more years young adults spent in education, the longer they waited before they moved in with a partner.
Third, family-constrained trajectories were found to be much more common among women who were in female-dominated areas of study, like health care or personal care, especially compared to the partner-constrained or initially unconstrained trajectories. While we were unable to assess whether this effect reflects differences in preferences or differences in opportunities, our findings indicated that it was much less prevalent among men. Moreover, both men and women who pursued studies in the arts and humanities had patterns of work-family trajectories which differed from those of men and women in other study fields, as they were less likely to start a family, or did so later. A dynamic selection process seems to have been going on among the respondents in this study area, which might have been the outcome of their chosen lifestyle (cf. Hoem, Neyer, and Andersson 2006 for women studying in the arts and humanities).
Overall, education seems to have been more relevant for women’s trajectories, while labour market conditions seem to have been more relevant for men’s trajectories (see also Liefbroer and Corijn 1999). Having found a job rapidly and having held a high-prestige first job reduced the odds of experiencing a family-constrained trajectory among men (which indicates that they prioritised their work career), but not among women. Unfavourable labour market conditions at the start of their career were associated with trajectories characterised by part-time work and unemployment among women. These trajectories were much less common among men.
our findings clearly show that work-life trajectories are already gendered in early adulthood, we can expect these trajectories to diverge even more as these respondents progress in their careers.
References
Aassve, A., Billari, F.C., and Piccarreta, R. (2007). Strings of adulthood: A sequence analysis of young British women’s work-family trajectories. European Journal
of Population 23: 369−388. doi:10.1007/s10680-007-9134-6.
Abbott, A. (1984). Event sequencing and event duration. Historical Methods 17: 192−204. doi:10.1080/01615440.1984.10594134.
Abbott, A. and Forest, J. (1986). Optimal matching methods for historical sequences.
Journal of Interdisciplinary History 16(3): 471−494. doi:10.2307/204500.
Abbott, A. and Hrycak, A. (1990). Measuring resemblance in sequence data: an optimal matching analysis of musicians’ careers. American Journal of Sociology 96(1): 144−185. doi:10.1086/229495.
Abbott, A. and Tsay, A. (2000). Sequence analysis and optimal matching methods in sociology. Sociological Methods and Research 29(1): 3−33.
doi:10.1177/0049124100029001001.
Anderson, D.J., Binder, M., and Krause, K. (2002). The motherhood wage penalty: Which mothers pay it and why? The American Economic Review 92(2): 354−358. doi:10.1257/000282802320191606.
Anderson, D.J., Binder, M., and Krause, K. (2003). The motherhood wage penalty revisited: Experience, heterogeneity, work effort, and work-schedule flexibility.
Industrial and Labor Relations Review 56(2): 273−294. doi:10.2307/3590938.
Andersson, R. and Olsson, A.-K. (1999). Fields of training: Manual. Thessaloniki: European Centre for the Development of Vocational Training.
Baerts, A., Deschacht, N., and Guerry, M.-A. (2008). Carrières van mannen en
vrouwen: Een literatuurstudie. Brussels: Vrije Universiteit Brussel.
Becker, G.S. (1985). Human capital, effort, and the sexual division of labor. Journal of
Labor 3(1): S33−S58. doi:10.1086/298075.
Blossfeld, H.-P. (1995). The new role of women. Family formation in modern societies. Boulder: Westview.
Blossfeld, H.-P. and Huinink, J. (1991). Human capital investments or norms of role transition ? How women’s schooling and career affect the process of family.
Budig, M.J. and Hodges, M.J. (2010). Differences in disadvantage: Variation in the motherhood penalty across white women’s earnings distribution. American
Sociological Review 75(5): 705−728. doi:10.1177/0003122410381593.
Budig, M.J. and England, P. (2001). The wage penalty for motherhood. American
Sociological Review 66(2): 204−225. doi:10.2307/2657415.
Cobb-Clark, D.A. and Dunlop, Y. (1999). Role of gender in job promotions. Monthly
Labor Review 122: 32.
Dex, S. (1991). Life and work history analyses: Qualitative and quantitative
developments. London/New York: Routledge (Sociological Review Monograph
37).
Dex, S., Joshi, H., Macran, S., and Mcculloch, A. (1998). Women’s employment transitions around child bearing. Oxford Bulletin of Economics and Statistics
60(1): 79−98. doi:10.1111/1468-0084.00087.
Drolet, M. (2002). Wives, mothers and wages: Does timing matter? Ottawa: Statistics Canada, Research paper; 186.
Duquet, N., Glorieux, I., Laurijssen, I., and Van Dorsselaer, Y. (2010). An unfinished job? The effect of subject choice and family formation processes on labour market outcomes of young men and women. Journal of Education and Work
23(4): 319−338. doi:10.1080/13639080.2010.484800.
Elder, G.H. (1994). Time, human agency, and social change: Perspectives on the life course. Social Psychology Quarterly 57(1): 4−15. doi:10.2307/2786971.
Esping-Andersen, G. (2009). The incomplete revolution. Adapting to women's new
roles. Cambridge: Policy Press.
Fernández-Kranz, D., Lacuesta, A., and Rodriguez-Planas, N. (2010). Chutes and ladders: Dual tracks and the motherhood dip. Bonn: Forschungsinstitut zur Zukunft der Arbeit, Discussion paper series; 5403.
Gabadinho, A., Ritschard, G., Müller, N.S., and Studer, M. (2011). Analyzing and visualizing state sequences in R with TraMineR. Journal of Statistical Software
40(4): 1−37.
Glorieux, I., Laurijssen, I., Minnen, J., and van Tienoven, T.-P. (2010). In search of the harried leisure class: Time-use surveys and patterns of leisure consumption.
Journal of Consumer Policy 33(2): 163−181. doi:10.1007/s10603-010-9124-7.
Gustafsson, S. (2003). Optimal age at motherhood. Theoretical and empirical considerations on postponement of maternity in Europe. In: Zimmermann, K.F. and Vogler, M. (eds.). Family, Household and Work. Berlin/Heidelberg: Springer-Verlag: 345−367. doi:10.1007/978-3-642-55573-2_17.
Gustafsson, S. (2005). Having kids later. Economic analyses for industrialized countries. Review of Economics of the Household 3: 5−16.
doi:10.1007/s11150-004-0977-x.
Gustafsson, S., Kenjoh, E., and Wetzels, C. (2002). The role of education in postponement of maternity in Britain, Germany, the Netherlands and Sweden. In: Ruspini, E. and Dale, A. (eds). The gender dimension of social change: The
contribution of dynamic research to the study of women’s life courses. Bristol:
The Policy Press: 55−79.
Hank, K. (2002). Regional social contexts and individual fertility decisions: A multilevel analysis of first and second births in Western Germany. European
Journal of Population 18: 281−299. doi:10.1023/A:1019765026537.
Hoem, J.M. (1986). The impact of education on modern family-union initiation.
Journal of Population 2: 113−133. doi:10.1007/BF01796886.
Hoem, J.M., Neyer, G., and Andersson, G. (2006). The relationship between educational field, educational level, and childlessness among Swedish women born in 1955−59. Demographic Research 14(15): 331−380. doi:10.4054/Dem
Res.2006.14.15.
Hogan, D.P. (1978). The variable order of events in the life course. American
Sociological Review 43(4): 573−586. doi:10.2307/2094780.
Kalmijn, M. (1996). Effecten van opleidingsniveau, duur en richting op het tijdstip waarop paren hun eerste kind krijgen. Bevolking en Gezin 1: 41−71.
Kan, M.Y. (2007). Work orientation and wives’ employment careers: An evaluation of 's Preference Theory. Work and Occupations 34(4): 1−23.
Kind, en Gezin (2013). Het kind in Vlaanderen 2013. Brussels: Kind en Gezin.
Klerman, J.A. and Leibowitz, A. (1999). Job continuity among new mothers.
Koelet, S. (2005). Standvastige verschillen. Een analyse van theoretische benaderingen over de verdeling van het huishoudelijke werk van vrouwen en mannen op basis van tijdsbudgetonderzoek. [PhD thesis]. Brussels: Vrije Universiteit Brussel.
Kogan, I. and Schubert, F. (2003). General indicators on transition from school to work. Youth transitions from education to working life in Europe. Part I. Brussels: Eurostat, Statistics in Focus. Population and Social Conditions. Theme 3; 4/2003.
Korenman, S. and Neumark, D. (1991). Does marriage really make men more productive? The Journal of Human Resources 26(2): 282−307.
doi:10.2307/145924.
Kravdal, Ø. (1994). The importance of economic activity, economic potential and economic resources for the timing of first births in Norway. Population Studies
48(2): 249−267. doi:10.1080/0032472031000147786.
Kreyenfeld, M. (2000). Educational Attainment and First Births : East Germany before and after Unification. Rostock: Max Planck Institute for Demographic Research, MPIDR Working Papers; 2000-011.
Kurz, K., Steinhage, N., and Golsch, K. (2005). Case study Germany. Global competition, uncertainty and the transition to adulthood. In: Blossfeld, H.-P., Klijzing, E., Mills, M., and Kurz, K. (eds.). Globalization, uncertainty and youth
in society. London/New York: Routledge: 47−78.
Lappegård, T. (2002). Education attainment and fertility pattern among Norwegian women. Oslo: Statistics Norway, Documents; 2002/18.
Lappegård, T. and Rønsen, M. (2005). The Multifaceted impact of education on entry into motherhood. European Journal of Population 21(1): 31−49.
doi:10.1007/s10680-004-6756-9.
Laurijssen, I. (2012). Verdeeld tussen arbeid en gezin. Een panelstudie naar de context en dynamiek van de keuze voor deeltijds werk. [PhD thesis]. Brussels: Vrije Universiteit Brussel.
Laurijssen, I. and Glorieux, I. (2010). Tijdsdruk en de combinatie van arbeid en gezin. Een verkennende analyse op basis van de SONAR data. Leuven: Steunpunt Studie en Schoolloopbanen, SSL-report; SSL/OD2/2010.21.
Liefbroer, A.C. and Corijn, M. (1999). Who, what, where, and when? Specifying the impact of educational attainment and labour force participation on family formation. European Journal of Population 15(1): 45−75.
doi:10.1023/A:1006137104191.
Liefbroer, A.C. (2005). The impact of perceived costs and rewards of childbearing on entry into parenthood: Evidence from a panel study. European Journal of
Population 21:367−391. doi:10.1007/s10680-005-2610-y.
McRae, S. (2003). Constraints and choices in mothers’ employment careers: A consideration of Hakim's Preference Theory. British Journal of Sociology 54(3): 317−338. doi:10.1080/0007131032000111848.
Miller, A.R. (2011). The effects of motherhood timing on career path. Journal of
Population Economics 24(3): 1071−1100. doi:10.1007/s00148-009-0296-x.
Mills, M. (2004). Stability and change: The structuration of partnership histories in Canada, the Netherlands, and the Russian Federation. European Journal of
Population 20(2): 141−175. doi:10.1023/B:EUJP.0000033862.83081.ad.
Mills, M. and Blossfeld, H.-P. (2005). Globalization, uncertainty and the early life course. In: Blossfeld, H.-P., Klijzing, E., Mills, M., and Kurz, K. (eds.).
Globalization, uncertainty and youth in society. London/New York: Routledge:
1−24.
Moen, P. and Sweet, S. (2004). From ―work-family‖ to ―flexible careers‖. Community,
Work and Family 7(2): 209−226. doi:10.1080/1366880042000245489.
Oppenheimer, V.K. (1988). A theory of marriage timing. American Journal of
Sociology 94(3): 563−591. doi:10.1086/229030.
Oppenheimer, V.K. (2003). Cohabiting and marriage during young men’s career-development process. Demography 40(1): 127−149. doi:10.2307/3180815.
Oppenheimer, V.K., Kalmijn, M., and Lim, N. (1997). Men’s career development and marriage timing during a period of rising inequality. Demography 34(3): 311−330. doi:10.2307/3038286.
Petersen, T., Penner, A.M., and Hogsnes, G. (2011). The male marital wage premium: Sorting vs. differential pay. Industrial and Labor Relations Review 64(2): 283−304.
Pollmann-Schult, M. (2011). Marriage and earnings: Why do married men earn more than single men? European Sociological Review 27(2): 147−163.
Rindfuss, R.R., Morgan, S.P., and Offutt, K. (1996). Education and the changing age pattern of American fertility: 1963-1989. Demography 33(3): 277−290.
doi:10.2307/2061761.
Rohwer, G. and Pötter, U. (2005). TDA user’s manual. Bochum: Ruhr-Universität-Bochum.
Rosenfeld, R.A., Van Buren, M.A., and Kallberg, A.L. (1998). Gender differences in supervisory authority: Variation among advanced industrialized democracies.
Social Science Research 27(1): 23−49. doi:10.1006/ssre.1997.0609.
Sixma, H. and Ultee, W.C. (1983). Een beroepsprestigeschaal voor Nederland in de jaren tachtig. Mens en Maatschappij 58: 360−382.
Skirbekk, V., Kohler, H.-P., and Prskawetz, A. (2004). Birth month, school graduation, and the timing of births and marriages. Demography 41(3): 547−568.
doi:10.1353/dem.2004.0028.
Stone, J., Netuveli, G., and Blane, D. (2007). Modelling socioeconomic trajectories: An optimal matching approach. International Journal of Sociology and Social
Policy 28(5/6): 217−230.
Taniguchi, H. (1999). The timing of childbearing and women’s wages. Journal of
Marriage and the Family 61(4): 1008−1019. doi:10.2307/354020.
Van Bavel, J. (2010). Choice of study discipline and the postponement of motherhood in Europe: The impact of expected earnings, gender composition and family attitudes. Demography 47(2): 439−458. doi:10.1353/dem.0.0108.
Van Bavel, J. (2012). The reversal of gender inequality in education, union formation and fertility in Europe. Vienna Yearbook of Population Research 10:127−154.
doi:10.1553/populationyearbook2012s127.
Waite, L.J. (1995). Does marriage matter? Demography 32(4): 483−507.
doi:10.2307/2061670.
Waldfogel, J. (1997). The effect of children on women’s wages. American Sociological