DEMOGRAPHIC RESEARCH
VOLUME 31, ARTICLE 49, PAGES 1455
−
1476
PUBLISHED 16 DECEMBER 2014
http://www.demographic-research.org/Volumes/Vol31/49/ DOI: 10.4054/DemRes.2014.31.49
Research Article
Family size and intra-family inequalities in
education in Ouagadougou
James Lachaud
Vissého Adjiwanou
Thomas K. LeGrand
Jean-François Kobiané
©2014 Lachaud, LeGrand, Adjiwanou & Kobiané.
This open-access work is published under the terms of the Creative Commons Attribution NonCommercial License 2.0 Germany, which permits use, reproduction & distribution in any medium for non-commercial purposes, provided the original author(s) and source are given credit.
1 Introduction 1456
2 Background 1458
3 Data and method 1461
3.1 Variables 1461
3.2 Methods 1464
4 Results 1465
4.1 Multivariate Results 1467
5 Discussion 1471
6 Acknowledgments 1472
References 1473
Family size and intra-family inequalities in education in
Ouagadougou
James Lachaud1
Thomas K. LeGrand2
Vissého Adjiwanou3
Jean-François Kobiané4
Abstract
BACKGROUND
While the potential benefits for educational investment of decline in family size are well known, some questions have emerged on the distribution of these benefits. Do all the children in a family benefit equitably from the improved conditions brought about by limiting their number? And what are the consequences of reduction in family size for social inequalities in educational opportunity within the family?
OBJECTIVE
This study aims to analyze the inequalities in education between children within the same family in the context of falling fertility in Ouagadougou, the capital city of Burkina Faso.
METHODS
Inequalities in school attainment are analyzed, first in regard to family sizes and second in terms of gender, birth order, and the interactions between these two variables. Probit models are estimated and adjusted Wald F statistics with Bonferroni corrections for multiple comparisons are computed.
RESULTS
The results show that family households with fewer children exhibit different patterns of investment in children’s schooling, with lower inequalities between children by gender and birth order. At the post-primary level, however, the firstborn girls in small families appear to be less likely to be enrolled in school compared with those in large
1 University of Montreal; Quebec, Canada. E-Mail: [email protected].
2 University of Montreal, Quebec, Canada. 3 University of Cape Town, South Africa.
families, and also to be disadvantaged in their schooling compared to other children of small families.
CONCLUSIONS
Reduced fertility appears to have negative effects on the schooling of the oldest girls and beneficial effects for all other children in the household. To mitigate this disadvantage, measures should be considered to reconcile domestic work with the new opportunities emerging from expanding school systems and smaller family sizes.
1. Introduction
The global policy goal of extending education to all children (as enshrined in UNESCO's Education For All (EFA) movement) remains a daunting challenge in most sub-Saharan African countries, despite the central role of schooling in economic growth, individual development, and social mobility. Over the past three decades many programs and policies have been designed and introduced to facilitate access to education. These programs have resulted in an expansion of educational opportunities and a development of alternative schools with more flexibility, and they have generally reduced the costs to families (Lloyd 2005). For example, in Ouagadougou, the capital city of Burkina Faso, the number of schools and classrooms grew by about 30% during the second half of the 1990s (Pilon et al. 2002). In the Central Region of the country where Ouagadougou is located, census data shows that the net enrolment ratio in primary education5 rose from 66% in 1996 to 84% in 2006. The same trend has been observed in most large cities in sub-Saharan African countries, where major school infrastructure programs have been implemented (Lloyd 2005).
Recent decades have also witnessed a considerable increase in families’ commitment to the formal schooling of their children. This attitude shift can be seen in the strategies developed by families to enhance their children’s wellbeing through access to a good education. One of these strategies has long been studied, theoretically and empirically: the changing of family structure through limiting the number of children (Blake 1981; Bougma and LeGrand 2013; Eloundou-Enyegue and Williams 2006; Kuepie et al. 2011; LeGrand et al. 2003). The results of these studies suggest that each additional child represents a drain on available family resources: hence the arrival of a new child requires changes to resource distribution and, all else being equal, reduces the share allocated to each child. Thus, limiting the number of children should
5 The net enrolment ratio is the percentage of the total population of a given school age that is enrolled in
enable the household to better provide for each of them (Downey 2001). Some researchers have argued that this phenomenon, combined with changes in the overall population age structure and a decrease in the economic dependency ratio, results in a “demographic dividend” – a window of opportunity for rapid economic growth and substantial improvements in schooling levels in developing countries (Bloom and Canning 2003).
However, some questions have emerged about the distribution between the children within the family of these potential benefits of lower fertility (Allendorf 2012a; Allendorf 2012b; Lloyd and Gage-Brandon 1994; Parish and Willis 1993). Who are the winners and will there be losers? Boys or girls? The first born or subsequent children? In other words, do all the children in a household benefit equitably from the improved conditions brought about by limiting their number? More precisely, what are the consequences of falling family size for social inequalities in educational opportunity within the family?
Most studies that have dealt with these questions have focused on gender inequalities between children within the family (Allendorf 2012b; Lloyd and Gage-Brandon 1994). Reduced family size results in a lower household economic dependency ratio and so relieves some of the resource constraints that may force families to choose between their children in terms of educational investment. There is no longer a need to choose between boys and girls or between oldest and other children. In addition, according to Allendorf (2012b), smaller family size may accompany a redefinition of family roles away from those traditionally established, of family expectations and economic perspectives linked to the schooling of girls compared to boys, and of the firstborn compared with younger children. And this, in turn, alters the paradigm defining the relative value of each child within the family, as well as the principles of resource allocation between children, and so may be conducive to reducing intra-familial inequalities. To our knowledge, to date only two studies have directly examined the effects of family size on intra-family school inequality in sub-Saharan Africa. Lloyd and Gage-Brandon (1994) found that high fertility has a negative impact on girl’s education in Ghana: girls with many younger siblings had a lower likelihood of school enrolment, a greater probability of dropping out, and fewer overall numbers of schooling attained. By contrast, Eloundou-Enyegue and Davanzo (2003) reported that family size does not seem to affect the educational inequalities between girls and boys within the family in the context of Cameroon.
responsible for domestic work (cooking, cleaning, etc.), childcare, and also for ‘husband care’ – cooking special foods, ironing his clothes, and so on. As their labor market participation increases, substitutes must be found for those activities (Schultz 1981). Two ways commonly used in the region are hiring a young maid or fostering in an older child to help with domestic work. Nonetheless, a number of studies have shown that, in the absence of the mother and without adequate child care policies, girls - and especially the oldest daughter - are often called upon to assume the maternal figure, with adverse effects on their schooling (Gertler, Levine, and Ames 2004; Montandon and Sapru 2002).
This study examines the patterns of intra-household inequalities in education between children in the context of rapidly falling fertility in five neighborhoods of Ouagadougou. More specifically, it seeks to describe and analyze schooling inequalities between children (brothers versus sisters, and firstborn versus subsequent births), living in households with different numbers of children, after controlling for a range of other sociocultural and economic factors. In this way the study aims to contribute to a better understanding of the potential consequences of falling fertility for educational inequalities, and to the development of policy recommendations that aim to enhance education for all.
2. Background
Like other cities in Sub-Saharan Africa, in recent years Ouagadougou has witnessed a rise in gender equality in access to schooling as well as a rise in the level of school enrolment (Pilon 2003). In primary school6 the gender parity index (female/male) rose from 67.0 in 1997 to 84.0 in 20027. School enrolment figures for the Central Region show that girls have even become slightly advantaged in the most recent years: for boys the brut enrolment ratio rose from 76.7% in 2006–07 to 87.4% in 2011–2012, while for girls it grew from 75.2% to 90.6%.8 This trend was also observed at the post-primary level, where the gender parity index attained 104 for new enrolments in the 7th year of elementary education in 2010–20119. Data from the Demtrend survey used here also
6 In the Burkinabe education system, elementary education is composed of a 9-year cycle known as the
“années fondamentales”, divided into 6 basic primary years and 3 post-primary years. The secondary school cycle follows on from this, with 4 years of schooling.
7 “Statistiques de l’éducation de base 2005/2006” from the Ministry of Basic Education and Literacy (MEBA,
in French).
8 “Statistiques de l’éducation de base 2011/2012; 2012/2013” from the Ministry of Basic Education and
Literacy.
9 Annuaire statistique de l’Enseignement secondaire -2011 from the Ministry of Secondary and Higher
reveal this reversal of the trend in five neighborhoods of Ouagadougou (Kobiané et al. 2013). For the generation born between 1953 and 1977 in the study population, boys received markedly more schooling than girls, whereas, for the children born to this cohort of women, gender inequality in schooling attainment disappears and even reverses in the latest years. Increased enrolment can be explained in part by the substantial expansion of the primary school system throughout the country over the past decades: ruralisation of primary schooling since 1967, revolutionary schooling in 1984, and the Education For All program in 2000 (Kobiané and Bougma 2009). While much of the emphasis of these programs has been on rural areas, it remains the case that most schools, like most other public services, are concentrated in urban areas and particularly in the capital, facilitating access to free or reduced-cost primary education for young city dwellers.
By contrast, there remain wide social disparities in the likelihood of children continuing in school after the primary level. Data from Burkina Faso, as in many other countries in the region, show a rapid decline in school enrolment of children after the age of 12 or 13 (Kobiané 2006). Furthermore, schools are unevenly distributed across space within the capital itself, especially at the post-primary and secondary levels where the private sector is the main provider (Kobiané et al. 2013). According to these figures, almost 87.1% of post-primary schools are concentrated in the formal (zoned) neighborhoods of Ouagadougou, while less than 13% are in the spontaneous settlement areas in the urban periphery where over half of the population lives (Kobiané et al. 2013).
Regarding family size, Burkina Faso is one of the last countries to begin its fertility transition (Locoh 2002). Although one cannot point to a general decline in fertility across the country, the major urban areas and, in particular, Ouagadougou have experienced a relatively large drop over the past quarter century. DHS data show that fertility in the city decreased from 4.7 children per woman in 1993 to 4.0 in 1998, and to 3.4 in 2010. Falling fertility is leading to changes in household composition and structure in Ouagadougou, and to a marked increase in the prevalence of small families (Baya and Laliberté 2008).
al. 2011). In their study on urban sub-Saharan Africa (including Burkina Faso), Kuepie et al. (2011) used twin births as a natural experiment and found that family size has an exogenous negative effect on human capital accumulation, although the magnitude of the effect seems small. In the case of Ouagadougou, a recent study by Bougma and LeGrand (2013), using involuntary infertility as an instrumental variable, showed that the number of biological siblings has a strong negative impact on child schooling, with each additional child born to a mother estimated to cause the average school attainment of other children to fall by roughly one year.
Moreover, it is important to highlight several complex sociocultural or contextual factors in Sub-Saharan countries that have hindered research to date on family size and educational investment in children. These include child fostering, polygamy, and child mortality (Lloyd and Gage-Brandon 1994; Randall, Coast, and Leone 2011). Child fostering, or the entrusting of generally poorer children to more affluent family members, could be seen as a traditional form of family mutual aid that affects not only family size but also the family’s budgetary constraints, by transferring or sharing burdens or responsibility between households within the broader family group. In Ouagadougou, where fostering is fairly common, fostered children are often disadvantaged compared to the parents’ own children in terms of educational investment (de Vreyer 1994; Pilon 2003). Thus, while the education of children is seen as an obligation for parents, in the African context this is not always the case for other children living in the household.
3. Data and method
We use data from the Demtrend project, based on a subsample of the population being longitudinally followed by the Ouagadougou Health and Demographic Surveillance System (Ouaga-HDSS). The Ouaga-HDSS is a demographic monitoring system set up in 2008 that covers over 18,000 households and more than 84,000 individuals in five areas in the northern part of the city: two ‘formal’ neighbourhoods and three spontaneous ‘slum’ neighbourhoods largely bereft of public infrastructure (for details, see Rossier et al. 2012). The Demtrend survey, fielded in 2012, was designed to study “the consequences of women’s fertility and household composition strategies for school enrolment and employment among children in an urban environment in Burkina Faso”. It collected information from all women in the Ouaga-HDSS who were at or near the end of their reproductive lives (ages 35–59) and who had given birth to a least one child who survived to at least age 3 (2,952 women). In the absence of significant contraceptive use or problems of infertility, and considering the average age of onset of reproductive life and the average birth interval in Ouagadougou, a woman would typically have given birth to at least 4 to 5 children by age 35; thus the 22.8% of women with at most three children are considered as having low fertility (a relatively small family size). The survey asked women for details of the schooling of each of their children, both those living with them in the household and those residing elsewhere. Complementary data on household characteristics and ethnicity collected by the Ouaga-HDSS system was merged with this information; most came from the third round of data collection that occurred three months prior to the Demtrend survey (see Kobiane et al. 2013 for details).
For this study we focus on school-age children aged 8 to 17 who are living with their interviewed mother. The lower limit of 8 years old was chosen to take into account the late entry into primary school, which is a common feature of Burkina Faso. The upper limit of 17 years was established to reduce the risk-selection biases due to older children leaving the family home for reasons of marriage (especially for girls), employment, or other reasons. The sample size is 3,852 children: 1,867 girls and 1,985 boys.
3.1 Variables
Two dichotomous dependent variables for schooling are used: • Current school enrolment for children aged 8 to 17;
The second variable captures a more sustained investment by parents in children’s human capital development and ensures that the successful completion of the six years of primary education is followed by registration in the seventh year of elementary education - the first year of post-primary school. Note that, given the common delays in entering and then progressing through the Burkinabe school system, few children who had attained post-primary school had dropped out by age 17.
The main independent variables of interest are the sex and birth order of the mother’s biological children. We also estimate models with the following three interaction terms: oldest girls, oldest boys, and children of higher order births. In addition, family size is defined in relation to the mother’s birth history and is measured by the number of children ever born, or the woman’s parity. This indicator relates to the reproductive behaviour of women over their entire reproductive lives up to the moment of data collection and, as noted above, includes deceased children and thus their associated direct and indirect costs. Demtrend and Ouaga-HDSS data do not provide information on the children of polygamous fathers who live elsewhere – a frequent occurrence in Ouagadougou where co-wives often live in separate households. This is unfortunate as, following Lloyd and Brandon (1994), we suspect that the results will differ depending on whether family size is based on a same-mother or a same-father sample.
The regressions control for the effects of a number of other variables. These include the child’s age and his/her number of past repeated school years, the mother’s age (which also captures the effects of changes over time), her education (literate or illiterate)10 and her ethnic group (Mossi, representing over 90% of the population living in Ouagadougou, versus other), household type (polygamous or not), socioeconomic status (poorer, poor, or better off, based on an underlying index calculated from the household assets and housing quality using principal components method; see Vyas and Kumaranayake 2006), sex of the household head, and type of neighbourhood (formal versus spontaneous informal). Moreover, child fostering is captured by two variables: whether the child under question was fostered in the past, and the presence of young fostered children living in the household at the time of the survey. We do not control for whether the child under study has a sibling currently fostered out as this is a rare phenomenon in the data, occurring to less than 1% of the children.
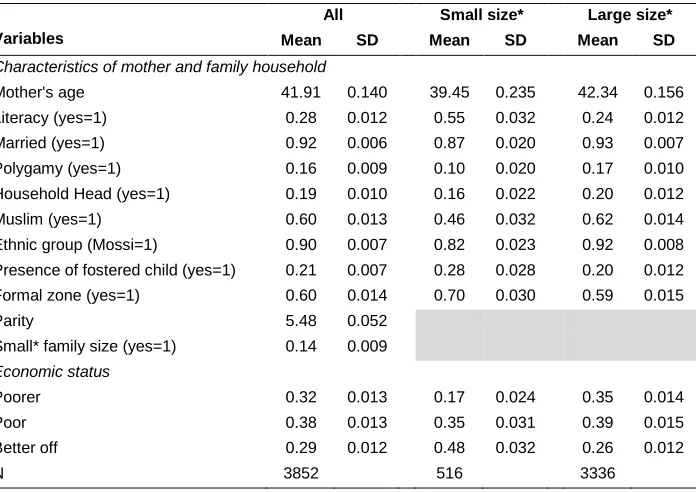
Table 1 presents summary statistics for variables used in the analysis. Of the 3,852 children aged 8 to 17 in the data, 12% were firstborn and over 48% were girls. Roughly 21% of all the 2,952 mothers interviewed had small families (≤3 children ever born), and 14% of the children in the data lived in such families.11 In terms of schooling, more
10 The ability to read and write.
11 The lower percentage for children is due simply to the fact that there are, on average, fewer children present
than 95% of children aged 8 to 17 had been enrolled at one time in their lives in a formal educational institution. Eighty-seven per cent of those children were currently attending school, but only 46% of children aged 12 to 17 had attained the post-primary level. In small families, 96% of the children were currently enrolled in school and 60% of those between the ages of 12–17 had attained the post-primary grades; for large families the percentages were 85% and 43%, respectively.
Table 1: Summary statistics for variables used in the analysis
Variables
All Small size* Large size*
Mean SD Mean SD Mean SD
Education
Currently in school 0.87 0.007 0.96 0.009 0.85 0.008
Ever been schooled 0.95 0.005 0.99 0.004 0.95 0.006
Post-primary level‡ 0.46 0.011 0.60 0.030 0.43 0.012
Age: 8 0.08 0.005 0.07 0.013 0.08 0.005
9 0.09 0.006 0.08 0.014 0.10 0.006
10 0.09 0.005 0.10 0.016 0.09 0.005
11 0.09 0.005 0.10 0.014 0.09 0.005
12 0.11 0.005 0.14 0.016 0.11 0.006
13 0.10 0.005 0.10 0.017 0.10 0.006
14 0.11 0.005 0.10 0.014 0.11 0.006
15 0.11 0.005 0.11 0.014 0.11 0.005
16 0.10 0.005 0.08 0.011 0.11 0.006
17 0.10 0.005 0.11 0.014 0.10 0.005
Gender (daughter=1) 0.48 0.009 0.51 0.024 0.48 0.009
Birth rank (Oldest=1) 0.12 0.006 0.38 0.020 0.08 0.006
Interaction terms
Oldest daughter 0.06 0.005 0.22 0.020 0.04 0.004
Oldest son 0.06 0.004 0.16 0.017 0.04 0.004
2nd rank or + 0.88 0.006 0.62 0.020 0.92 0.006
Previously been fostered 0.03 0.004 0.03 0.009 0.03 0.004
Table 1: (Continued)
Variables
All Small size* Large size*
Mean SD Mean SD Mean SD
Characteristics of mother and family household
Mother's age 41.91 0.140 39.45 0.235 42.34 0.156
Literacy (yes=1) 0.28 0.012 0.55 0.032 0.24 0.012
Married (yes=1) 0.92 0.006 0.87 0.020 0.93 0.007
Polygamy (yes=1) 0.16 0.009 0.10 0.020 0.17 0.010
Household Head (yes=1) 0.19 0.010 0.16 0.022 0.20 0.012
Muslim (yes=1) 0.60 0.013 0.46 0.032 0.62 0.014
Ethnic group (Mossi=1) 0.90 0.007 0.82 0.023 0.92 0.008
Presence of fostered child (yes=1) 0.21 0.007 0.28 0.028 0.20 0.012
Formal zone (yes=1) 0.60 0.014 0.70 0.030 0.59 0.015
Parity 5.48 0.052
Small* family size (yes=1) 0.14 0.009
Economic status
Poorer 0.32 0.013 0.17 0.024 0.35 0.014
Poor 0.38 0.013 0.35 0.031 0.39 0.015
Better off 0.29 0.012 0.48 0.032 0.26 0.012
N 3852 516 3336
Sources: Calculated with Data from Ouaga-HDSS 2011 and Demtrend 2012
‡ Calculated for those aged 12–17 and who have been in school, 2624. * Small size≤ 3 children; large size ≥4.
3.2 Methods
co-wives. Adjusted Wald F statistics were calculated using the Bonferroni12 correction for multiple comparisons to test the significance of differences observed between children of the same gender and birth rank of small and large families. Finally, the Stata cluster method was employed to take into account the likelihood of correlated errors between brothers and sisters living in the same household, and the Hubert-White formula was used to compute robust significance levels.
4. Results
Figure 1 shows the proportions of children aged 8 to 17 enrolled in school and of children aged 12 to 17 at post-primary school, by family size. The proportion of children currently enrolled in school falls as family size increases, a trend that is markedly more pronounced at the post-primary level.
Figure 1: Education by family size
Source: 2011 Ouaga-HDSS data and 2012 Demtrend survey data
12 Bonferroni adjustments consist in dividing the α significance threshold by the number of coefficients to be
tested simultaneously, so that the overall significance level does not exceed the nominal level, and to obtain more conservative confidence intervals.
0.00 0.25 0.50 0.75 1.00
1 2 3 4 5 6 7 8 or +
P
ropor
ti
on
Family size
Table 2 shows that this negative association between family size and school enrolment is evident independent of the age and sex of the children. The enrolment gap between large and small families appears to widen considerably after age 15, to about 20%. The same phenomenon is observed for the post-primary level from the age of 14 onwards.
Inequalities between girls and boys in terms of access to school appear to be minor or even non-existent. Girls appear to have generally caught up or even to be slightly more likely to be enrolled in school than boys. That said, while girls in larger families have a small advantage at the post-primary level (45% are enrolled, versus 41% for boys), in smaller families girls are less likely to access post-primary level schooling (57% versus 63%) and they also tend to enter post-primary school later than boys.
Table 2: Proportion of children currently enrolled in school by gender, age, and family size
Age Small size Large size
All Son Daughter All Son Daughter
In any formal school (ages 8–17)
8 0.95 0.97 0.93 0.90 0.91 0.89
9 0.99 1.00 0.98 0.96 0.95 0.97
10 1.00 1.00 1.00 0.96 0.97 0.95
11 1.00 1.00 1.00 0.94 0.91 0.96
12 0.99 1.00 0.98 0.91 0.90 0.92
13 1.00 1.00 1.00 0.92 0.93 0.90
14 0.98 0.95 1.00 0.90 0.87 0.92
15 0.95 0.95 0.93 0.82 0.78 0.86
16 0.85 0.84 0.90 0.64 0.57 0.71
17 0.86 0.85 0.85 0.65 0.64 0.66
Total 0.96 0.95 0.96 0.85 0.84 0.87
In post-primary school (ages 12–17)
12 0.16 0.22 0.11 0.06 0.06 0.05
13 0.36 0.41 0.31 0.25 0.24 0.25
14 0.65 0.56 0.74 0.43 0.43 0.42
15 0.87 0.85 0.88 0.58 0.52 0.63
16 0.82 0.86 0.77 0.63 0.57 0.68
17 0.88 0.89 0.88 0.65 0.65 0.65
Total 0.60 0.63 0.57 0.43 0.41 0.45
4.1 Multivariate results
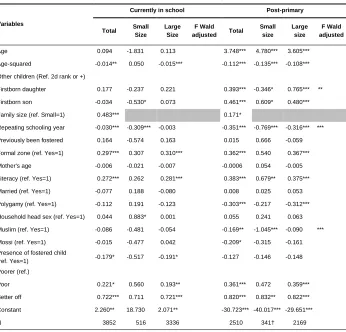
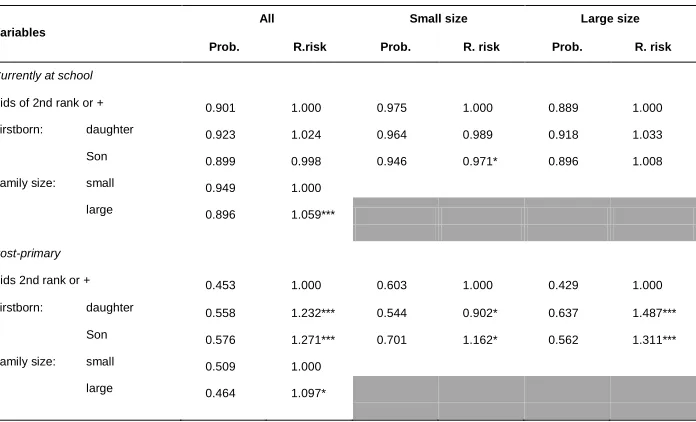
Table 3 presents the probit regression estimates for the determinants of current school enrolment for children aged 8 to 17, and for access to post-primary education for children aged 12 to 17. To facilitate the interpretation of the estimates, Table 4 in turn presents the mean predicted probabilities and relative risks for the gender, birth order, and family size variables, calculated from the Table 3 regression results.
The negative association between family size and school attendance for children aged 8–17, seen in the descriptive analysis above, is again evident in the regression results in Table 3. Children from small families are considerably more likely to be currently enrolled (β*=0.483) than children from large families, a difference that is significant at the 1% level. The predicted probability for children born into small families to attend school is 0.95, compared to 0.90 for those from larger families. In the regression that combines children from large and small families, access to schooling appears to be little differentiated by sex or birth order. However, the separate regressions estimated by family size reveal a number of differences. In larger families the firstborn child (whether a son or a daughter) is more likely to be currently enrolled in school compared to subsequent births, although this difference is not significant (column 3). Conversely, in small families the firstborn child is less likely to attend school – an effect that is stronger and statistically significant at the 10% level for firstborn boys (column 4). The predicted probabilities in Table 4 show that, irrespective of birth order and gender, children born into small families are more likely to attend school than others. That said, the benefit of living in a smaller family incurs more to children of birth order 2+: they move from being relatively disadvantaged in larger families to relatively advantaged in smaller ones.
With respect to the post-primary schooling of children aged 12–17, those born into smaller families exhibit a higher likelihood of being enrolled (predicted probability = 0.51) than those from larger families (PP=0.46), a gap that is significant at the 10% level. In addition, the pooled regression results show that firstborn children, both boys and girls, are more likely to access post-primary schooling than subsequent children, a result that is significant at the 1% level.
The pooled regression results, however, mask sharp differences between smaller and larger families in terms of intra-family inequality in access to education. In smaller families the estimates indicate that firstborn girls are disadvantaged in terms of post-primary schooling at the 10% level of significance, compared to children whose birth order rank is 2 or over; by contrast, firstborn boys are advantaged, also at the 10% level. Both firstborn boys and girls from larger families are much more likely to attend school than siblings born subsequently, and these differences are highly significant. Indeed, in large families the relative risk of a firstborn girl attending post-primary school is 1.49 that of later-born brothers and sisters; for firstborn boys, the relative risk is 1.31.
Table 3: Coefficients of Probit Models
Variables
Currently in school Post-primary
Total Small Size
Large Size
F Wald adjusted Total
Small size
Large size
F Wald adjusted
Age 0.094 -1.831 0.113 3.748*** 4.780*** 3.605***
Age-squared -0.014** 0.050 -0.015*** -0.112*** -0.135*** -0.108***
Other children (Ref. 2d rank or +)
Firstborn daughter 0.177 -0.237 0.221 0.393*** -0.346* 0.765*** **
Firstborn son -0.034 -0.530* 0.073 0.461*** 0.609* 0.480***
Family size (ref. Small=1) 0.483*** 0.171*
Repeating schooling year -0.030*** -0.309*** -0.003 -0.351*** -0.769*** -0.316*** ***
Previously been fostered 0.164 -0.574 0.163 0.015 0.666 -0.059
Formal zone (ref. Yes=1) 0.297*** 0.307 0.310*** 0.362*** 0.540 0.367***
Mother's age -0.006 -0.021 -0.007 -0.0006 0.054 -0.005
Literacy (ref. Yes=1) 0.272*** 0.262 0.281*** 0.383*** 0.679** 0.375***
Married (ref. Yes=1) -0.077 0.188 -0.080 0.008 0.025 0.053
Polygamy (ref. Yes=1) -0.112 0.191 -0.123 -0.303*** -0.217 -0.312***
Household head sex (ref. Yes=1) 0.044 0.883* 0.001 0.055 0.241 0.063
Muslim (ref. Yes=1) -0.086 -0.481 -0.054 -0.169** -1.045*** -0.090 ***
Mossi (ref. Yes=1) -0.015 -0.477 0.042 -0.209* -0.315 -0.161
Presence of fostered child
(ref. Yes=1) -0.179* -0.517 -0.191* -0.127 -0.146 -0.148
Poorer (ref.)
Poor 0.221* 0.560 0.193** 0.361*** 0.472 0.359***
Better off 0.722*** 0.711 0.721*** 0.820*** 0.832** 0.822***
Constant 2.260** 18.730 2.071** -30.723*** -40.017*** -29.651***
N 3852 516 3336 2510 341† 2169
Table 4: Mean predicted probabilities and relative risks
Variables
All Small size Large size
Prob. R.risk Prob. R. risk Prob. R. risk
Currently at school
Kids of 2nd rank or + 0.901 1.000 0.975 1.000 0.889 1.000
Firstborn: daughter 0.923 1.024 0.964 0.989 0.918 1.033
Son 0.899 0.998 0.946 0.971* 0.896 1.008
Family size: small 0.949 1.000
large 0.896 1.059***
Post-primary
Kids 2nd rank or + 0.453 1.000 0.603 1.000 0.429 1.000
Firstborn: daughter
0.558 1.232*** 0.544 0.902* 0.637 1.487***
Son 0.576 1.271*** 0.701 1.162* 0.562 1.311***
Family size: small 0.509 1.000
large 0.464 1.097*
Sources: Calculated with Data from Ouaga-HDSS 2011 and Demtrend 2012
Relative risks are the ratio of mean predicted probabilities. Significance: *** 0.01 **0.05 *0.10.
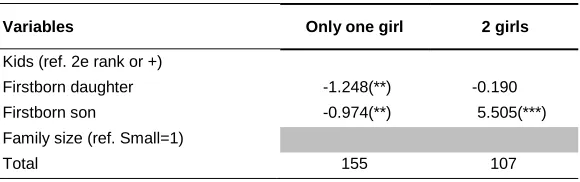
Children born into polygamous families appear to be less likely to attend post-primary school, a finding that is consistent with the idea that larger numbers of half-siblings will serve to ‘dilute’ the resources available to invest in a given child’s schooling. In the regressions of overall school attendance for children aged 8–17, the estimated coefficient for polygamy is small and insignificant. Additional regressions were fitted on data limited to non-polygamous households to assess the sensitivity of the estimates (see Table 5 in the Appendix). The estimated coefficients for the birth order by gender variables for current enrolment at ages 8–17 were essentially unchanged, while those for access to post-primary education became somewhat larger, indicating somewhat more pronounced effects. Separate models were not fitted for children of polygamous families because the size of this subsample is too small.
lower likelihood of attaining post-primary level than all of their siblings. By contrast, if the only son is the firstborn, his chances are higher than all the other children. These results suggest that, irrespective of the family composition of small families, the firstborn girls have less access to post-primary schooling. That said, it should be noted that these regressions were estimated on relatively small numbers of children and the results were statistically insignificant.
5. Discussion
This study examines patterns of intra-family inequality in terms of the school enrolment of children born into small versus large families in five neighborhoods of Ouagadougou, the capital city of Burkina Faso. As is the case in many other sub-Saharan cities, fertility levels in Ouagadougou have fallen over the past decades, leading to a substantial rise in the number of smaller families. While most researchers now believe that declining fertility has net beneficial effects on children’s schooling and, more generally, on economic growth, the question of how those benefits are distributed among children within the family is less well understood. We find that family size is associated with systematic differences in children’s schooling within families – results that are pertinent for predicting how inequalities in education may evolve over time.
Children of small families display higher probabilities of school enrolment (or of attaining the post-primary school level) than those in large families, largely irrespective of their age and gender. This tendency remains evident after controlling for the characteristics of the mother and of the household. At the post-primary level, firstborn girls from small families appear to be substantially less likely to be enrolled compared with those hailing from large families; in sharp contrast, firstborn boys and children of birth order 2 and above with few siblings are much more likely to attend post-primary school. These findings are robust and remain visible when data are limited to non-polygamous families or when the gender composition of offspring in small families is taken into account.
more involved in work activities located outside the home there will be a growing need to find a substitute to do important domestic work (cooking, cleaning, childcare, etc.). In the context of Ouagadougou, where there is a lack of public facilities for taking care of small children and a general unwillingness of men to participate in domestic activities, it may often be the case that the firstborn daughter is called upon to provide that work, with adverse consequences for her schooling (Gertler, Levine, and Ames 2004; Montandon and Sapru 2002).
The maternal employment information in our data is unfortunately limited and problematic: for those reasons, we did not control for mother’s work in the regression analysis above.13 That said, mothers in smaller families were found to be significantly more likely to report working during the week preceding the survey than those in large families. When women’s work was taken into account in the regressions, at the post-primary level the firstborn daughters of working mothers continued to be disadvantaged in terms of enrolment, while firstborn daughters of non-working mothers were not. While these coefficients are statistically insignificant, their signs are consistent with the notion that the changing roles of mothers may contribute to the educational disadvantages faced by their firstborn daughters in small families.
In sum, the results suggest that falling fertility is associated with generally greater investments in children’s schooling, especially after the primary level, but that there are systematic differences in who benefits among children within families. Firstborn daughters in particular appear not to benefit from smaller family sizes and their access to schooling even seems to decline. Lower fertility thus may lead to a new pattern of intra-family social inequalities in educational attainment, unless appropriate compensatory measures are implemented to address the issue. There is a need to adapt public policies to target firstborn girls in small families, who are the main losers in the process.
6. Acknowledgments
Financial support and the data used for this study come from the Demtrend Project, funded by the Hewlett Foundation and the French government (Agence inter-établissements de recherche pour le développement/AIRD). We also thank Marc Pilon for his comments and suggestions.
13 The questionnaires asked about women’s work during the week prior to the survey. In Ouagadougou
References
Allendorf, K. (2012a). Like daughter, like son? Fertility decline and the transformation of gender systems in the family. Demographic Research 27(16): 429–454.
doi:10.4054/DemRes.2012.27.16.
Allendorf, K. (2012b). Going Nuclear? Family Structure and Young Women’s Health in India, 1992–2006. Demography 50(3): 853–880. doi:10.1007/s13524-012-0173-1.
Baya, B. and Laliberté, D. (2008). Crises des solidarités ou solidarités dans la crise? Une lecture à partir de l'analyse de l'évolution de la structure des ménages entre 1993 et 2003 à Ouagadougou, Burkina Faso. African Population Studies 23(2): 273–287.
Blake, J. (1981). Family Size and the Quality of Children. Demography 18(4): 421– 442. doi:10.2307/2060941.
Bloom, D. and Canning, D. (2003). How Demographic Change Can Bolster Economic Performance in Developing Countries. World Economics 4(4): 1–14.
Bougma, M. and LeGrand, T.K. (2013). Fertility Decline and Investment in Children's Human Capital in urban Burkina Faso: What Causal Relationship? Demography (Accepted).
Calvès, A.-E. and Schoumaker, B. (2004). Deteriorating Economic Context and Changing Patterns of Youth Employment in Urban Burkina Faso: 1980–2000. World Development 32(8): 1341–1354. doi:10.1016/j.worlddev.2004.03.002. Charmes, J. (2012). The Informal Economy Worldwide: Trends and Characteristics.
Margin: The Journal of Applied Economic Research 6(2): 103–132.
doi:10.1177/097380101200600202.
de Vreyer, P. (1994). La demande d'éducation: déterminants économiques. Afrique contemporaine(172): 92–107.
Downey, D. (2001). Number of siblings and intellectual development. The resource dilution explanation. Am Psychol 56(6-7): 497–504. doi:10.1037/0003-066X.56.6-7.497.
Eloundou-Enyegue, P.M. and Davanzo, J. (2003). Economic Downturns and Schooling Inequality, Cameroon, 1987-1995. Population Studies 57(2): 183–197.
Eloundou-Enyegue, P.M. and Williams, L.B. (2006). Family Size and Schooling in Sub-Saharan African Settings: A Reexamination. Demography 43(1): 25–52.
doi:10.1353/dem.2006.0002.
Gertler, P., Levine, D.I., and Ames, M. (2004). Schooling and Parental Death. The Review of Economics and Statistics 86(1): 211–225. doi:10.1162/003465 304323023769.
Kobiané, J.-F. (2006). Ménages et scolarisation des enfants au Burkina Faso : à la recherche des déterminants de la demande scolaire. Louvain-la-Neuve Academia-Bruylant.
Kobiané, J.-F. and Bougma, M. (2009).Analyse des résultats définitifs - Thème 5- Instruction, Alphabétisation et Scolarisation Ouagadougou: Ministère de l’Economie et des Finances (RGPH-2006).
Kobiané, J.-F., Legrand, T.K., Pilon, M., Bougma, M., and Lachaud, J. (2013). Rapport final-DEMTREND, Tendances démographiques en Afrique subsaharienne. Burkina Faso, Ouagadougou: Observation de population de Ouagadougou. Kuepie, M., Tenikue, M., Nouetagn, S., and Misangumukin, N. (2011). Number of
siblings and school achievement in sub Sahara Africa. Luxembourg: CEPS, Instead (Working Paper No 2011-31).
LeGrand, T., Koppenhaver, T., Mondain, N., and Randall, S. (2003). Reassessing the Insurance Effect: A Qualitative Analysis of Fertility Behavior in Senegal and Zimbabwe. Population and Development Review 29(3): 375–403. doi:10.1111/ j.1728-4457.2003.00375.x.
Lloyd, C.B. (2005). Growing up Global: The Changing Transitions to Adulthood in Developing Countries. Washington: National Academic Press.
Lloyd, C.B. and Gage-Brandon, A.J. (1994). High Fertility and Children's Schooling in Ghana: Sex Differences in Parental Contributions and Educational Outcomes. Population Studies 48(2): 293–306. doi:10.1080/0032472031000147806.
Locoh, T. (2002). Structures familiales et évolutions de la fécondité dans les pays à fécondité intermédiaire d'Afrique de l'Ouest. Documents de travail de l'INED. Mier Y Terán, M. (1996). The implications of Mexico’s fertility decline for women’s
Montandon, C. and Sapru, S. (2002). L’étude de l’éducation dans le cadre familial et l’apport des l’approches interculturelles. In: Darsen, P.R. and Perregaux, C. (eds.). Pourquoi des approches interculturelles en sciences de l’éducation ? Bruxelles: De Boeck: 125–145.
Oppong, C. (1993). Occupational and Conjugal Inequalities and Insecurity: effects on family organization and size. In: Federici, N., Oppenhein Mason, K., andSogner, S. (eds.). Women's Position and Demographic Change. Oxford: Clarendon Press Oxford.
Parish, W.L. and Willis, R.J. (1993). Daughters, Education, and Family Budgets Taiwan Experiences. The Journal of Human Resources 28(4): 863–898.
doi:10.2307/146296.
Piechaud, A. (2011). Démographie du Burkina Faso: évolutions, tendances actuelles, perspectives.[Master Thesis]. Université Paris-Descartes, Paris.
Pilon, M. (2003). Confiage et scolarisation en Afrique de l'Ouest : Un état des connaissances. In Paris: UNESCO.
Pilon, M., Baux, S., Kaboré, I., and Lokpo, K.L. (2002). Étude exploratoire de l’offre et de la demande d’éducation à Ouagadougou. Ougadougou: Unité de recherche en démographie//Université de Ouagoudou (UERD/UO)
Randall, S., Coast, E., and Leone, T. (2011). Cultural constructions of the concept of household in sample surveys. Population Studies 65(2): 217–219. doi:10.1080/ 00324728.2011.576768.
Rossier, C., Soura, A., Baya, B., Compaoré, G., Dabiré, B., Dos Santos, S., Duthé, G., Gnoumou, B., Kobiané, J.F., Kouanda, S., Lankoandé, B., Legrand, T., Mbacke, C., Millogo, R., Mondain, N., Montgomery, M., Nikiema, A., Ouili, I., Pison, G., Randall, S., Sangli, G., Schoumaker, B., and Zourkaleini, Y. (2012). Profile: the Ouagadougou Health and Demographic Surveillance System. International journal of epidemiology 41(3): 658–666. doi:10.1093/ije/dys090.
Schultz, T.P. (1981). Economics of Population. MA: Addison-Wesley
Appendix
Table A1: Coefficients of Probit Models for non-polygamous families
Variables
Currently at school Post-primary
Total Small size
Large size
F Wald adjuste
d
Total Small size
Large size
F Wald adjuste
d
Children (ref. 2e rank or +)
Firstborn daughter 0.085 -0.296 0.109 0.276 * -0.408* 0.657*** **
Firstborn son -0.133 -0.483 -0.042 0.431*** 0.672** 0.419** Family size
(ref. Small=1) .491 *** 0.204
Sources: Calculated with Data from OUAGA-HDSS 2011 and Demtrend 2012 All control variables are included
The coefficient is statistically significant at: *** 0.01 **0.05 *0.10. † Firstborn girl=20%, firstborn son=19% and kids of rank 2d or + = 61%
Table A2: Composition family effect: Small family
Variables Only one girl 2 girls
Kids (ref. 2e rank or +)
Firstborn daughter -1.248(**) -0.190
Firstborn son -0.974(**) 5.505(***)
Family size (ref. Small=1)
Total 155 107