Detection and classification of brain tumor using Artificial Neural Network
from EEG Images
Shashi Kiran.S
†and Liyakathunisa*
†
Assistant Professor, JNN College of Engineering, Shimoga, Karnataka, India
E-mail: [email protected]
* Assistant Professor, Sri Jayachamarajendra College of Engineering, Mysore, Karnataka, India
E-mail: [email protected]
Abstract
Brain tumor is an abnormal intracranial growth caused by cells reproducing themselves in an uncontrolled manner. Curing cancer has been a major goal of medical researchers for decades. The early detection of cancer can be helpful in curing the disease completely. In this paper we propose an ANN base approach to identify brain tumor from electroencephalogram (EEG) signals. It mainly consists of three stages; they are pre-processing, feature extraction and classification. The pre-processing involves resizing so that the further processing is easier. Feature Extraction involves extracting the features. The classification stage involves Artificial Neural network. Raw EEG signals are valuable in brain tumor diagnosis. On this basis, a brain tumor identification system is developed to analyze those features to judge whether brain tumor is present or not.
KeyWords
Artificial Neural Network (ANN), Brain tumor, Classification, electroencephalogram (EEG), MLP, Wavelet Transform.
1.
INTRODUCTION
The human brain is the most complex object ever known. It is basically soft, delicate, and spongy mass of tissue. A tumor is a mass of tissue that's formed by gathering of abnormal cells.
Brain tumor is a group of abnormal cells that grows inside of the brain or around the brain. All healthy cells can be destroyed by the tumor in the affected region. Brain tumor can also damage healthy cells by crowding other parts of the brain and causing brain swelling and inflammation within the skull.
The complex brain tumor can be separated into two general categories depending on the tumors origin, their growth pattern and malignancy.
Primary brain tumors originate in the brain itself or in tissue close to it, such as in the brain-covering membranes, cranial nerves, pituitary glands or pineal gland. Primary brain tumors begin when normal cells acquire errors (mutations) in their DNA. These mutations allow cells to grow and divide at increased rates and to continue living when healthy cells would die. The result is a mass of abnormal cells, which forms a tumor.
Secondary (metastatic) brain tumors are tumors that result from the cancer that starts elsewhere in your body and then spreads (metastasizes) to brain. Secondary brain tumors most often occur in people who have a history of cancer. But in rare cases, a metastatic brain tumor may be in the first sign of cancer that began elsewhere in the body. Secondary brain tumors are far more common than are primary brain tumors.
There are numerous methods to be used to diagnose a brain tumor; these methods include a Magnetic Resonance Imaging (MRI) scan, Computerized Axial Tomography CAT, (CT) scan or an electroencephalogram (EEG), to name a few. With an electroencephalogram, the abnormalities in the brain functioning can be identified and if this is carried out an early stage, brain disorders can be treated preventing further complications [1]. The earlier the detection is, the higher the chances of successful treatment are.
patients’ chance of survival is very low. Therefore, there is a great need for a new technology to diagnose the brain tumor in its early stages.
Medical diagnosis is one of major problem in medical application. Several research groups are working world wide on the development of neural networks in medical diagnosis. Neural networks are used to increase the accuracy and objectivity of medical diagnosis [2].
The flow of the topics is as follows. In section 2, we provide a brief review of the related work, in section 3, the functioning of Electroencephalography for diagnostic purpose is discussed. In section 4, system design is presented. In section 5, pre-processing is discussed. In section 6, feature extraction technique is dealt. The method of training of Neural Network and the classification work carried out is explained in section 7. The results obtained during experimentation and conclusions drawn are elaborated in section 8.
2. RELATED WORK
The literature shows the various methods for the detection of brain tumor. Eltaher Mohamed Hussein, Dalia Mahmoud, Adam Mahmoud used an approach to detect brain tumor using Computer Aided Diagnosis (CAD) system using ANNs to classify brain tumors [2]. From each MR Image a Harlick texture features was extracted to prepare training data which was introduced to neural network as input and target vectors.Arati Kothari discusses a Brain Cancer Detection and Classification System which uses computer based procedures to detect tumor blocks or lesions and classify the type of tumor using Artificial Neural Network in MRI images of different patients with Astrocytoma type of brain tumors [3]. The image processing techniques such as histogram equalization, image segmentation, image enhancement, morphological operations and feature extraction have been developed for detection of the brain tumor in the MRI images of the cancer affected patients. T. Purusothaman analyses various clustering techniques to track tumor objects in Magnetic Resonance (MR) brain images. The input to this system is the MR image of the axial view of the human brain. The Clustering algorithms used are K-means, SOM, Hierarchical Clustering and Fuzzy C-Means Clustering [4]. Manoj K Kowar and Sourabh Yadav presented a technique for the detection of tumor in brain using segmentation and histogram thresholding. The method can be successfully applied to detect the contour of the tumor and its geometrical
dimension [5]. Meghana Nagori, Shivaji Mutkule and Praful Sonarkar used an approach to extract metabolite values from graph. Metabolites like NAA, Creatine, Choline and Cr2 are used to detect the brain tumor. Cho/NAA ratio plays most important role in deciding the tumor type so weights are assigned to each metabolite while clustering. By clustering algorithms, they achieved accuracy up to 86%. The system is based on decision tree algorithms [6]. N. NandhaGopal develops a new approach for brain tumor detection using Meta Heuristic Algorithm. It aims to develop effective algorithm for the segmentation of Brain MRI images. In the Preprocessing system, film artifacts and unwanted portions of MRI brain image are removed. In the Enhancement process, the noise and high frequency components are removed using median filters. The Segmentation process has three different approaches like block based (non algorithmic), PSO and HPACO algorithm segmentation [7]. K. Somasundaram and T. Kalaiselvi implemented a method to locate the regions occupied by brain tumors. Initially the brain is extracted by removing the unwanted non-brain regions like skull, scalp, fat and muscles. Then the brain is segmented into well known regions like WM, GM, CSF and background using FCM algorithm. CSF class is analyzed for symmetric property along the central vertical line. If no symmetry is found, then the image with CSF class is segmented further into CSF and tumor classes using extended maxima transform. This transform helps to separate the tumor region from the normal CSF region [8]. Dina Aboul Dahab, Samy S. A. Ghoniemy, Gamal M. Selim developed a modified Probabilistic Neural Network (PNN) model that is based on learning vector quantization (LVQ) with image and data analysis and
manipulation techniques is proposed to carry out an automated brain tumor classification using MRI-scans. The assessment of the modified PNN classifier performance is measured in terms of the training performance, classification accuracies and computational time. The simulation results showed that the modified PNN gives rapid and accurate classification compared with the image processing and published conventional PNN techniques [9]. Hence, in recent literature it is observed that principles of neural networks have been very widely used for the detection of lung cancer in medical images.
Electroencephalography is the neurophysiologic measurement of the electrical activity of the brain using electrodes placed on the scalp. The resulting traces are known as electroencephalogram (EEG) and they represent an electrical signal from a large number of neurons. The EEG is a brain non-invasive procedure frequently used for diagnostically purposes.
The greatest advantage of EEG is speed. Complex patterns of neural activity can be recorded occurring within fractions of a second after a stimulus has been administered. EEG can determine the relative strengths and positions of electrical activity in different brain regions [10].
The EEG consists of a set of multi-channel signals. The pattern of changes in signals reflects large-scale brain activities. The electrodes are located on the surface of the scalp. The positions are determined by dividing the skull into perimeters by connecting few reference points on human head. The electrical nature of the human nervous system has been recognized for more than a century.
It is well known that the variation of the surface potential distribution on the scalp reflects functional activities emerging from the underlying brain. This surface potential variation can be recorded by affixing an array of electrodes to the scalp, and measuring the voltage between pairs of these electrodes, which are then filtered, amplified, and recorded.
The resulting data is called the EEG. Modern techniques for EEG acquisition collect these underlying electrical patterns from the scalp, and digitalize them for computer storage. Electrodes conduct voltage potentials as microvolt level signals, and carry them into amplifiers that magnify the signals approximately ten thousand times.
The use of this technology depends strongly on the electrodes positioning and the electrodes contact. For this reason, electrodes are usually constructed from conductive materials, such us gold or silver chloride, with an approximate diameter of 1 cm, and subjects must also use a conductive gel on the scalp to maintain an acceptable signal to noise ratio.
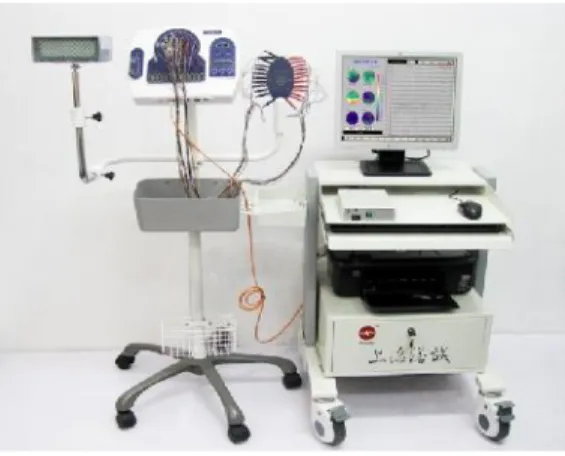
This method of EEG signal recording is shown in Fig. 1 and EEG equipment is shown in Fig. 2.
Fig. 1 EEG signal recording
3.1 Normal and Abnormal EEG
waveforms
When EEG waveforms is recorded for a patient who is awake or rest with eyes closed, a wave of about 1hz in frequency is continuously generated from the occipital region in almost symmetrical fashion in left and right side of the brain while it becomes larger just like the tide rises and falls. This wave is called alpha wave is considered as a standard wave of a normal patient captured over a few seconds.
Patterns in an abnormal patient usually include the appearance of a spike, sharp wave and slow wave complex. Between these abnormal waves an irregular slow wave appears and the background waveform is disturbed. Fig 3 and 4 shows normal and abnormal EEG waveforms.
Fig. 3 Normal EEG waveform
Fig. 4 Abnormal EEG waveform
4. SYSTEM DESIGN
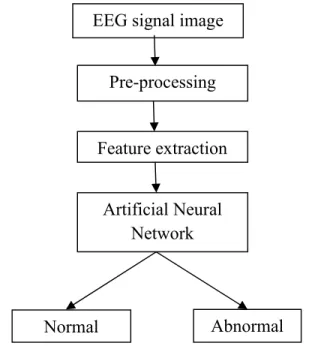
EEG images are valuable in brain tumor diagnosis. The system first preprocesses the raw EEG image and then extracts set of features to represent information of the image for Artificial Neural Network for recognition as shown in the fig. 5.
Figure 5: Stages of the proposed algorithm
5. PREPROCESSING
The EEG signal needs to be pre-processed in order to achieve the correct classification. The techniques to refine the data suitable for analyzing are included under the pre-processing technique.
Size normalization, noise elimination and re-sampling are the normal techniques in pre-processing.
Normally, size of the images varies. It is better to re-size the image to a fixed size so that classification of size affecting recognition results can be avoided. Normalization is done to convert the image size to a fixed size by fitting it within a fixed grid of 50X50 pixels size.
The Preprocessing in the brain tumor detection system involves the following two steps.
In the first step, resizing of the image is done. The EEG images obtained will not be of same size and they need to be converted to a standard size. This is required so that the set of features obtained for all the EEG images will be same. Here the resizing is done to get [50 X 50] matrix size image.
In the second step, conversion of the image to gray scale image is done. Along with the resizing of the image, conversion is done to get a gray scale image from RGB image. This is because for the RGB image, each pixel will be represented in three planes and the set of features obtained are more. This step is done to have reduced set of features.
EEG signal image
Pre-processing
Feature extraction
Artificial Neural
Network
6. FEATURE EXTRACTION
Feature extraction can be defined as "extracting the information from the image which is most relevant for the classification purposes". A feature extraction method that proves to be successful in one application domain may not be very useful in another application. Quality of feature selection determines the classification rate. If the features have sufficient distinguishing characteristics, it is easy for classifier for recognition.
Wavelet transforms can be used for feature extraction. Wavelet transform of an image yields a set of coefficients which characterizes several physical features of the image. It is a simple, less computationally expensive technique giving more detailed information.
Wavelet transforms decomposes a signal into a set of basis functions unlike Fourier transforms, whose basis functions are sinusoids. Wavelet transforms are based on small wave called wavelets of varying frequency and limited duration [11].
Wavelet can be applied on portions of an unknown signal to extract information from the unknown signal using a “shift, multiply and sum” technique called convolution [12]. Wavelet transform represents windowing technique with variable-sized regions. Wavelet analysis allows the use of long time intervals where we want more precise low-frequency information, and shorter regions where we want high-frequency information. Hence wavelet transform has been used for feature extraction.
If the features extracted are carefully chosen, it is expected that the features set will extract the relevant information from the input data in order to perform the desired task using this reduced representation instead of the full size input. Wavelet transform is used to extract features of images. The number of features obtained for each of the x-ray image are 500. These features are then fed to the Classifiers for further processing.
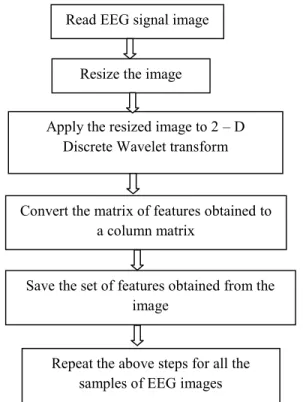
The flowchart given in the fig. 6 describes the steps involved in feature extraction.
7. CLASSIFICATION
Artificial neural network is used as classifier in this system. Multi-layer feed forward neural networks are used for classification with only one hidden layer.
Number of feature vector coefficients decides the number of nodes in the input layer. Since the wavelet feature has 500 coefficients, input layer of 500 nodes are used. The number of nodes in the hidden layer is 300. One node is used in the output layer. In the output layer, the neuron is trained to produce output (logic 1) only when an EEG with the symptoms of brain tumor input pattern is presented and produce output (logic 0) for healthy image pattern of EEG. Therefore the number of nodes in the output layer is one.
7.1 Training of Neural Network
A general three-layered Multi Layered Perceptron (MLP) back-propagation network is as shown in Fig. 7 with connection weights [13]. There are ‘I’ number of nodes in the input layer, ‘J’ number of nodes in the hidden layer and ‘K’ number of nodes in the output layer. The inputs to the layer are zi, for i = 1, 2, . . .I. The hidden and output values are denoted as yjand Okrespectively where j = 1,2, . . , J and k = 1,2, . ., K. The weight Vjiconnects the output of ith neuron with the input to the jth neuron. The
Resize the image
Repeat the above steps for all the samples of EEG images Read EEG signal image
Apply the resized image to 2 – D Discrete Wavelet transform
Convert the matrix of features obtained to a column matrix
Save the set of features obtained from the image
weight Wkjconnects the output of jthneuron with the input to the kthneuron.
The network needs to be trained in a supervised mode. During the training process, a set of pattern examples is used, each example consisting of a pair with the training pattern input and corresponding target output. The patterns are presented to the network sequentially, in an iterative manner. The appropriate weight corrections are being performed during the process to adapt the network to the desired behavior. The iterative procedure continues until the connection weight values allow the network to perform the required mapping.
The minimization of the error function is carried out using a gradient-descent technique. The necessary corrections to the weights of the network for each iteration n are obtained by calculating the partial derivative of the error function in relation to each weight, which gives a direction of steepest descent. A gradient vector representing the steepest increasing direction in the weight space is thus obtained. Since minimization is required, the weight update value uses the negative of the corresponding gradient vector component for that weight. The delta rule determines the amount of weight update based on this gradient direction along with a step size.
The error function is defined as the mean square sum of differences between the output values of the network and the desired target values.
The error function is expressed as
kk pk pk
p
d
o
E
1
2
2
1
for a specific pattern ‘p’. The subscript ‘p’ refers to a specific pattern that is at the input and produces the output error,‘d’ is desired response vector and ‘o’ is the output vector.
Activation function used for the output of a neuron is the unipolar sigmoid function given by
) exp(
1 1 )
(
net net
f
where λ is the slope of the sigmoid function and ‘net’ is the net input of the neuron.
Each neural classifier has to be first trained to recognize the cancerous and healthy image and produce the desired output when it is presented with the wavelet features of a particular image. Error Back Propagation training method is employed for this purpose.
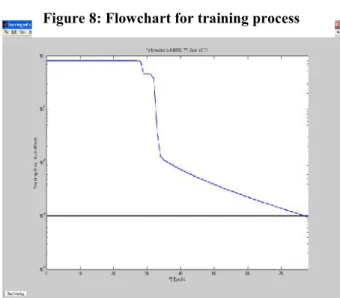
Weights are updated using the error (difference) between the actual output of the network and the desired (target) output, during training. Weights are adjusted repeatedly and error is calculated either until error reduces to 0.01 or 5000 epochs of training is reached. Training graph of neural network is as shown in Figure 8. The final weights at the end of the training represent the memory of neural network. They are saved and used for brain tumor detection. For each of brain tumor and healthy image, 30 samples are used for training.
Ok
vji
wkj
z1
z
lo
1o
kyj
y1
jthcolumn of nodes kthcolumn of nodes
Hidden Layer
Output Layer
Input Layer
ithcolumn of nodes
--- (1)
Figure 7: Three layered feed forward multi-layer neural classifier
The steps involved in training of neural network is shown in the flow chart in Figure 8. An example of training of the neural network with the features extracted from the image to classify the tumor is shown in Figure 9.
Figure 9:Training graph of Neural Network
7.2 Testing of Neural Network
In the testing phase, the features of the testing image are fed to the network and feed forward computations are carried out to obtain the output of the network. The output of the network lies in the range 0 to 1 due to sigmoid function. These are rounded to nearest binary value [‘0’ or ‘1’].
This binary output is compared with target value of the learnt patterns. If it matches with the target value, the pattern is said to be recognized and is displayed. Once the Artificial Neural Network is trained to recognize the brain tumor and healthy images, it is ready to use for recognizing the EEG signal as brain tumor or healthy. During recognition phase, Artificial Neural Network has the capacity to generalize and identify the brain tumor images with little variations when compared to the images used for training.
8. RESULTS AND CONCLUSION
The proposed system describes a novel procedure which uses the Wavelet features and Artificial Neural Network for the detection of brain tumor from EEG waveform. Separate training network is considered to train the brain tumor and healthy waveform. The performance of the system Set the target matrix corresponding to the
number of healthy and cancerous images Input different samples of cancerous as well as healthy EEG images and obtain
wavelet features
Create the neural network by specifying the number of input layer, hidden layer
and output layer
Specify the goal, error performance function and maximum number of epochs
to train
Save the network Train the network
was evaluated for 50 different EEG images and observed to possess a recognition accuracy of 90%.
The codes have been written for the images to be recognized. Experimental results show that brain tumor EEG image as well as healthy EEG images is recognized correctly. The percentage of error can be reduced by extracting more features from input images or by taking more number of samples for training.
References
[1] Seenwasen Chetty, Ganesh. K. Vinayagamurthy, A Neural network based detection of brain tumors using electroencephalography, International conference on Artificial Intelligence and Soft Computing, Banff, Canada, July 17 – 19, 2002
[2] Eltaher Mohamed Hussein, Dalia Mahmoud Adam Mahmoud, Brain Tumor Detection Using Artificial Neural Networks, Journal of Science and Technology Vol. 13, No. 2 ISSN 1605 – 427X Engineering and Computer Sciences (ECS), December 2012
[3] Arati Kothari, Detection and classification of brain cancer using artificial neural network in MRI Images
,
World Journal of Science and Technology 2012, 2(5):01-04 ISSN: 2231 – 2587[4] T. Purusothaman, Performance Analysis of Clustering Algorithms in Brain Tumor Detection of MR Images,European Journal of Scientific Research ISSN 1450-216X Vol.62 No.3 (2011), pp. 321-330
[5] Manoj K Kowar and Sourabh Yadav, Brain Tumor Detction and Segmentation Using Histogram Thresholding, International Journal of Engineering and Advanced Technology (IJEAT) ISSN: 2249 – 8958, Volume-1, Issue-4, April 2012
[6] Meghana Nagori, Shivaji Mutkule and Praful Sonarkar, Detection of Brain Tumor by Mining fMRI Images, International Journal of Advanced Research in Computer and Communication Engineering Vol. 2, Issue 4, January 2013
[7] N. NandhaGopal, Automatic Detection Of Brain Tumor through Magnetic Resonance Image, International Journal of Advanced Research in Computer and Communication Engineering, Vol. 2, Issue 4, April 2013
[8] K. Somasundaram and T. Kalaiselvi, Automatic Detection of Brain Tumor from MRI Scans Using Maxima Transform, Image Processing (NCIMP 2010)
[9] Dina Aboul Dahab, Samy S. A. Ghoniemy, Gamal M. Selim,Automated Brain Tumor Detection and Identification Using Image Processing and Probabilistic Neural Network Techniques, International Journal of Image Processing and Visual Communication ISSN 2319-1724 : Volume (Online) 1 , Issue 2 , October 2012.
[10] M. Teplan,Fundamentals of EEG Measurement, Measurement Science Review, Volume 2, Section 2, 2002.
[11] Liyakathunisa, C.N. Ravi Kumar, “A Novel and Efficient Wavelet based Denoising for Super Resolution Reconstruction of Low Resolution Mammogram Images” in Proc Medical Imaging: Perspectives on Perception and Diagnostics”, 2-Day International Symposium Organized in Conjunction with the Seventh Indian Conference on Computer Vision, Graphics And Image Processing (ICVGIP) 2010, 9-10 December 2010, IIT Delhi.
[12] Raghuveer.M.Rao and Ajit.S.Bopardikar, Wavelet Transforms, Introduction to Theory and Applications, Pearson Education, 2000