DESERT 17 (2013) 147-159
Application of Numerical Taxonomy Analysis in
Sustainable Development Planning of Combating Desertification
M.H. Sadeghi Ravesh
*a, H. Ahmadi
b, Gh.R .Zehtabian
c, M. Tahmoures
da
Assistant professor, Faculty of Agriculture, Islamic Azad University, Takestan Branch, Takestan, Iran b
Professor, Islamic Azad University, Science and Research Branch, Tehran, Iran c
Professor, Faculty of Natural Resources, University of Tehran, Karaj, Iran d
PhD. Student, Faculty of Natural Resources, University of Tehran, Karaj, Iran
Received: 1 August 2009; Received in revised form: 12 August 2010; Accepted: 12 November 2010
Abstract
Due to increasing importance of desertification challenges and its consequences the necessity of sustainable development achievement in arid and semi-arid regions is essential in order to avoid limited sources wasting, increase the efficiency of controlling, reclamation and restoration projects of natural areas. Based on the literature review, it has been recognized that combating desertification projects in Iran were yet inconsequential and incomprehensive. It is essential to achieve sustainable and comprehensive development in combating desertification issue. In relation to the mentioned case, investigation and ranking of current status of development indices of combating desertification process in different areas, is crucial which will determine the level of, budgeting and manpower polices. Therefore, numerical taxonomy model was recognized as a suitable tool for determination of ranking and classification of combating desertification indices. The study model is used for investigating and ranking of existing situation of combating desertification in the urban areas of Yazd province during the period of 2002-2007. The model evaluates development and extension of combating desertification indices in the urban areas using analytical structure and the final results are shown as the assessment Maps. The results show that Yazd, Taft, Mehriz and Khatam urban areas with expansion score of 0.89 from total combating desertification indices have unsuitable situation while Bafgh, Sadough and Tabas with expansion score of 0.44, 0.45 and 0.49, respectively had better situation. Moreover, it is recognized that budgeting and future development planning of the urban areas from combating desertification on the basis of the obtained results and raking of this research.
Keywords: Combating Desertification Indices; Numerical Taxonomy Model; Sustainable Development; Yazd
Province
1. Introduction
Desertification is generally understood to refer to land degradation in arid, semi- arid and dry semi-humid climatic zones (Thomas, 1997). It involves five principal processes: vegetation degradation, water erosion, wind erosion, salinization and water logging, and soil crusting and compaction (Dregne, 1999). Nowadays human activities and impacts on natural resources, especially in arid, semi arid and humid regions was changed the meaning of
Corresponding author. Tel.: +98 282 5270130, Fax: +98 282 5270130.
E-mail address: [email protected]
(FRWMO1, 2005), the adoption of suitable
policies in conformity with sustainable projects have been done for desertification and for this purpose since many years ago, in the frame work of fixation of flowing sand in Hamidieh, Albrarveh and Albaji of Khozestan province (Kochpideh and Keykhosravi, 2007) have been managed and done in different provinces of Iran, for example the improvement project of degraded rangelands (Institute of planning and agricultural economics research, 2001), green belt project (FRWMO, 2003), integrated desert management (FRWMO, 2005), wind erosion control and stabilization of moving sand Project (FRWMO, 2002), and finally national activity of combat desertification and decrease of drought effects (FRWMO, 2004). In spite of done activities and projects, about 100 million hectares of Iran’s area has affected with desertification phenomenon, because of human activities especially (FRWMO, 2005), and despite accomplishment of the project and planning, while having a relative success, the project could not achieve to comprehensive recognition of desertification process, land degradation and its related damage. Therefore achievement to integrated recognition control and management of desert areas is essential and necessary for sustainable development of arid and semi-arid areas (UNEP & FAO, 1999). One of the important factors of sustainable development of combating desertification planning is recognition and determination of development level of combating desertification indices. In this research combating desertification development means investments amounts, activities and performance of combating desertification process in the urban areas of Yazd province. Since balanced combating desertification in all areas in order to achieve to sustainable development is considerable, therefore recognition of current situation of combating desertification helps desert areas mangers for better understanding and decision making and recommends them for using the limited facilities and resources for control of desertification process in less developed and deprived areas. Therefore, in order to obtain sustainable development and quantitative evaluation of combating desertification process, some indices are proposed which are the chief topics of combating desertification, such as planting, seedling, irrigation, etc in the areas. These
1- Forest, Range and Watershed Management Organization (FRWMO)
indices are important in evaluation of combating desertification performance. In the scope of management of desert issue and in order of investigate the current condition of combating desertification indices and improvement of the indices in direction of sustainable development planning in national and international scale comprehensive and systematic researches have not been performed yet, and allocation of resources and facilities have been managed only on the basis of personal basis decision. Therefore the objective of this research is to study the assessment of development score of the urban areas from the viewpoint of combating desertification indices that has been studied in Yazd province. The results of this study could be used in sustainable development of combating desertification projects and can be used in different areas of Iran.
It should be noted that application of taxonomy model in desertification issues has no previous history and for the first time it has been used in Khezrabad region, Yazd province (Sadeghi Ravesh et al., 2009).
2. Materials and Methods
2.1. Study area
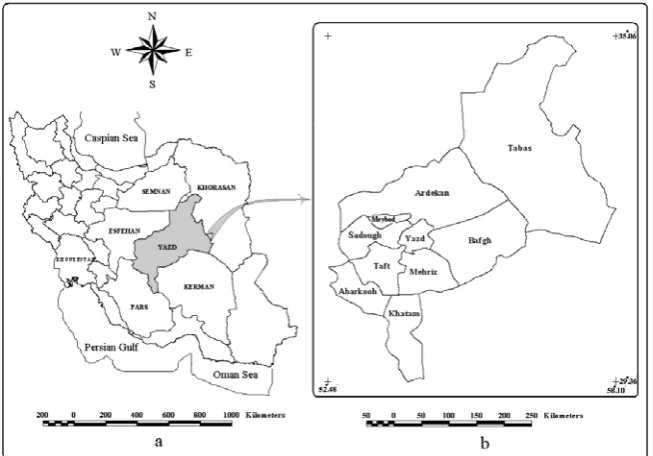
Yazd province is located in the central part of Iran plateau and interior part of Kavir Namak with an area of 128463 km2. Geographic location of the study area is 29° 36' to 35° 06' Northern latitude and 52° 48' to 58°10' Eastern longitude. (Fig.1). The climate of the areas is arid and cold according to Emberge climatic classification. The mean annual precipitation of the area is 60-80 mm with high annual variation. The desert areas have involved about 46.7% of Yazd province, and the areas include different desert geomorphologic faces. Therefore, the province was considered as the typical province for evaluation of current condition of desertification indices.
2.2. Methodology
i i ij ij
S
X
-X
Z
2m 1
j aj bj
ab
Z
Z
D
Fig. 1. Location map of the study area; a) Iran’s map; b) Yazd’s map
2.2.1. Determination of the options and evaluation indices
In this study, the options are the urban areas (units studied), and evaluation indexs are main desertification activities in urban areas which imply amount of investments, activities and operations about desertification in urban and province level.
2.2.2. Development data matrix
After determination of urban areas and evaluation indices, data indicate desertification activities selected at each urban level; and data matrix was formed based on Taxonomy model framework.
2.2.3. Normalization of the data matrix from equation 1
Where: (1)
ij
Z
= normalized value of the numbersij
X
= numerical value of dataXi
= mean of datai
S
= standard deviation of data2.2.4. Recognition of heterogeneous options
At this stage, reassessment of indices values about each urban area was done, in order to prevent unrealistic results.
2.2.4.1 Calculation and determination of cumulative distances among the options in a symmetric matrix from equation 2
(2)
Where:
ab
D
= cumulative distances among the optionsaj
Z
= normalized of the number related to "a" row and each column in matrix.bj
Z
= normalized of the number related to "b" row and each column in matrix2.2.4.2. Determination of shortest distance between each row of the symmetrical matrix
In determining this parameter, the shortest distance was considered expect the distance of each city from itself which is equal to zero.
2.2.4.3. Determination of upper and low limits of the shortest distance from equation 3
Where:
dr
O
= upper and low limits of the shortest distancedr
= the mean of the shortest distancedr
Numerical
Taxonomy
Model
Determination of the options (cities) and evaluation indices as individuals or in groups Formation of data matrix in which
the options (cities) are placed on line and combating desertification indices
are placed on column Normalization of data matrix
Calculation and determination of cumulative intervals using:
Determination of the lowest distance in each line of symmetric
matrix (dr)
Determination of upper
limit and low limit using:
Determination of ideal amount or the largest number of each column
of standard matrix (Doj)
Calculation of the pattern of the options using:
Calculation of upper limits of the options using:
Calculation of development score of the options using:
Fig. 2. Steps of numerical taxonomy analysis
i i ij ij
S
X
-X
Z
2m 1
j aj bj
ab
Z
Z
D
m1 i n
1 j
2 j ij
-
PI
Z
Cio
Cio
2
Cio
Co
Co
Cio
Fi
-Odr
≤
dr
≤
Odr
m1 i
n 1 j
2 j ij
-
PI
Z
Cio
Cio
2
Cio
Co
Co
Cio
Fi
2.2.5. Determination of ideal amount of standard matrix
In this step at the end of standard matrix the highest value of each column is obtained as Positive Ideal Index (PI). In combating desertification issues, development is an incremental function of the studied variables. Therefore, the highest value in each column of normalized matrix is the positive ideal value while the decreasing function of the variable of development assigns the highest negative value of standardized matrix as Negative Ideal value (NI) which is the desired score (Sadeghi Ravesh., 2008).
2.2.6. Calculation of the pattern of the options development from equation 4
(4)
Where
Cio =the pattern of the options development
ij
Z = normalized of the number related to each row and column in matrix.
j
PI = positive ideal number related to each
column in matrix.
2.2.7. Calculation of upper limit of the options development (CO) from equation 5
(5) Where:
Co
= upper limit of the options developmentCio
= the mean of the pattern of the options developmentCio
= standard deviation of the pattern of theoptions development
2.2.8. Calculation of development score of the options (Fi) from equation 6
(6) Where:
Fi
= development score of the optionsCio
= the pattern of the options developmentCo
= upper limit of the options development2.2.9. Provision of development map of the options
In order to ease and accuracy in data analysis and to achieve results, development maps of options in terms of desertification activities were provided. For this purpose, development
map for each city in relation to each index was provided using calculated development degrees of each index and GIS software.
3. Results
The taxonomy model used and assessed in the urban areas of Yazd province as the following steps:
3.1. Determination of the evaluation options (urban areas) and indices (de de-desertification indices)
In the first step in order to assess combating desertification performance, 10 urban areas of Yazd province (Abarrkooh, Ardakan, Bafgh, Taft, Khatam, Sadough, Tabas, Mehriz, Meybod and Yazd) have been selected and investigated from de desertification indices such as: the area of planted lands, the area of irrigated lands, the area of restricted lands, wells and pools, and the area of prepared or performed as combating desertification projects.
3.2. Development of the data matrix
In this stage, data indicate desertification activities were presented in data matrix format according to research literature (Jihad- Agriculture Organization of Yazd province, 2006) (Table1).
3.3. Normalization of the data matrix
After formation of data matrix and in order to equalize data scale and for preparation of unscaled data, the data has been normalized using equation 1, and normal matrix of combating
desertification indices has been formed (Table 2).
3.4. Recognition of heterogeneous urban areas
3.4.1. Calculation and determination of cumulative distances among the urban areas in a symmetric Matrix
Table 1. Matrix of combating desertification indices for the urban areas of Yazd province for the period of 2002- 2006 Combating desertification Indices Preparation of combating desertification projects (ha) well construction
and water storage pools Enclosure and conservation of vegetation cover (ha) Irrigation and protection (ha) Planted area (ha) Options (Urban area) 0 3 63724 4683 1164 Abarkooh 108000 3 29492 1596 430 Ardakan 92000 4 50670 4450 470 Bafgh 0 0 0 0 0 Taft 15636 1 15676 2519 290 Khatam 16700 3 156340 5125 840 Sadough 0 1 198884 6995 2235 Tabas 0 0 0 0 0 Mehriz 0 1 49548 6725 2240 Meybod 0 0 0 0 0 Yazd 23233.6 1.6 56433.4 3209.3 766.9 X 39055.57 1.43 65075.7 2581.95 817.43 S
Table 2. Normal matrix of combating desertification indices for the urban areas of Yazd province during 2002- 2006 Combating desertification Indices Preparation of combating desertification projects well construction and
water storage pools Enclosure and conservation of vegetation cover Irrigation and protection Planted area Options (Urban areas) -0.59 0.98 0.11 0.57 0.49 Abarkooh 2.17 0.98 -0.41 -0.62 -0.41 Ardekan 1.76 1.68 -0.09 0.48 -0.36 Bafgh -0.59 -1.012 -0.87 -1.24 -0.94 Taft -0.19 -0.42 -0.63 -0.27 -0.58 Khatam -0.17 0.98 1.53 0.74 0.09 Sadough -0.59 -0.42 2.19 1.47 1.79 Tabas -0.59 -1.12 -0.87 -1.24 -0.94 Mehriz -0.59 -0.42 -0.11 1.36 1.8 Meybod -0.59 -1.12 -0.87 -1.24 -0.94 Yazd 2.17 1.68 2.19 1.47 1.8 PI
All the cumulative distances were calculated and a two dimension matrix that is called "matrix of cumulative distances between the urban areas” is formed (Table 3). Prime diameter of this matrix represents the distance of each unit from itself which is equal to zero.
3.4.2. Determination of shortest distance between each row of the symmetrical matrix
Shortest distance between each row of the matrix (except the distance of each unit from itself and matrix diameter) is defined as shortest distance (dr) (Table 3).
Table 3. Matrix of cumulative distances among the urban areas of Yazd province
Shortest distance (dr) Yazd Meybod Mehriz Tabas Sadoogh Khatam Taft Bafgh Ardakan Abarkooh Options (Urban area) 1.54 3.27 2.08 3.27 2.97 1.54 2.13 3.27 2.6 3.18 0 Abarkooh 1.40 3.59 4.24 3.59 5.06 3.37 2.78 3.59 1.40 0 3.18 Ardekan 1.40 4.15 3.92 4.15 4.55 2.64 3.02 4.15 0 1.40 2.60 Bafgh 0 0 3.92 0 4.96 3.91 1.33 0 4.15 3.59 3.27 Taft 1.33 1.33 2.96 1.33 4.09 2.84 0 1.33 3.02 2.78 2.13 Khatam 1.54 3.91 2.85 3.91 2.45 0 2.84 3.91 2.64 3.37 1.54 Sadoogh 2.30 4.96 2.30 4.96 0 2.45 4.09 4.96 4.55 5.06 2.97 Tabas 0 0 3.92 0 4.96 3.91 1.33 0 4.15 3.59 3.27 Mehriz 2.08 3.92 0 3.92 2.30 2.85 2.96 3.92 3.92 4.24 2.08 Meybod 0 0 3.92 0 4.96 3.91 1.33 0 4.15 3.59 3.27 Yazd
3.4.3. Determination of upper and low limits of the shortest distance and conclusion
Mean and standard deviation of the shortest distance have been calculated and the upper and low limits of the distance have been determined using equation 3. The amounts of the shortest
3.5. Determination of ideal amount of standard matrix
In this stage, the largest number was selected as the matrix standard or in other words, the positive idea index was determined in each column (Table2).
3.6. Calculation of the pattern of the urban areas development (Cio)
After the confidence of the homogeneity of the urban areas and with due attention to standard matrix and positive ideal Index (Table 2), by using equation 4, standard deviation of the normalized data has been calculated in accordance with the indices of the urban areas from positive ideal number (PI) of the same index (Table 4), the small distance of each index from PI, represents development of that index in the city and vice versa.
3.7. Calculation of upper limit of the urban areas development (CO)
In order to determine development scores of the urban areas, ranking and preparation of the map of development indices, upper limit of the urban areas has been calculated in all cases using equation 5.
3.8. Calaulation of development score of the urban areas (Fi)
Finally, development score of the urban areas (Fi) has been calculated from equation 6 (Table 5).
In accordance with the method, development degrees of the options are between zero and one (OFI1). If the amount is close to zero (0) which shows the better condition of the option from the derived development indices and vice versa.
Table 4. The pattern matrix of development of the urban areas according to the indices and all indices separately Combating
desertification Indices Preparation of combating Cio1
desertification projects well construction
and water storage pools Enclosure and
conservation of vegetation cover Irrigation
and protection Planted
area Options (Urban area)
3.87 2.76 0.70 2.01 0.90 1.31 Abarkooh 4.06 0 0.70 2.60 2.09 2.21 Ardekan 3.20 0.41 0 2.10 0.99 2.16 Bafgh 6.30 2.76 2.80 3.06 2.71 2.74 Taft 5.16 2.36 2.10 2.82 1.74 2.38 Khatam 3.14 2.34 0.70 0.66 0.73 1.70 Sadough 3.47 2.76 2.10 0 0 0.005 Tabas 6.30 2.76 2.80 3.06 2.71 2.74 Mehriz 4.16 2.76 2.10 2.30 0.10 0 Meybod 6.30 2.76 2.80 3.06 2.71 2.74 Yazd 4.79 2.17 1.68 2.17 1.47 1.80 Cio 1.156 0.726 0.847 0.728 0.897 0.999 Cio
1- The pattern of the urban areas development
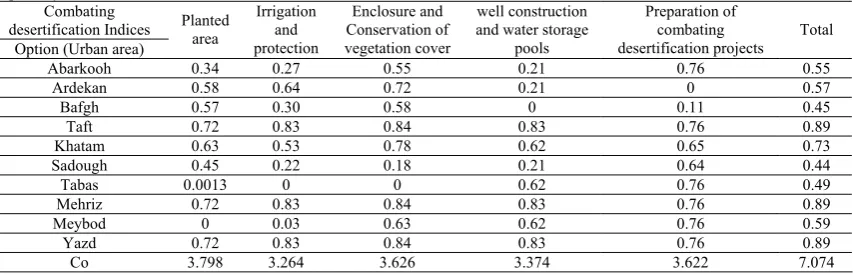
Table 5. Matrix of development degree of the urban areas according to the combating desertification indices and all indices separately
Combating
desertification Indices Preparation of combating Total
desertification projects well construction
and water storage pools Enclosure and Conservation of vegetation cover Irrigation and protection Planted area Option (Urban area)
0.55 0.76 0.21 0.55 0.27 0.34 Abarkooh 0.57 0 0.21 0.72 0.64 0.58 Ardekan 0.45 0.11 0 0.58 0.30 0.57 Bafgh 0.89 0.76 0.83 0.84 0.83 0.72 Taft 0.73 0.65 0.62 0.78 0.53 0.63 Khatam 0.44 0.64 0.21 0.18 0.22 0.45 Sadough 0.49 0.76 0.62 0 0 0.0013 Tabas 0.89 0.76 0.83 0.84 0.83 0.72 Mehriz 0.59 0.76 0.62 0.63 0.03 0 Meybod 0.89 0.76 0.83 0.84 0.83 0.72 Yazd 7.074 3.622 3.374 3.626 3.264 3.798 Co
3.9. Provision of development map of the urban areas on the basis of combating desertification indices
In order to ease and accuracy in data analysis and to achieve results, in framwork urban area
development matrix (Table 5), and using Arcview3.2a, development maps of urban area
urban areas (Table 5) were selected using Photoshop software and the boundaries were separated and they have been saved as Tiff format. Then by using R2V software the map raster format of the map was converted to the vector format and the vector map of the selected limits was inputted to Arcview, in order to provide the ranking of the urban areas based on the development indices. (Lillesand and Kiefer, 2000)
On the basis of taxonomy model and in order to access the development of combating desertification project in Yazd province, important results have been obtained. They have been presented below and effective projects and better planning can be offered according to taxonomy analyses:
3.9.1. Ranking of deprivation and development on the basis of taxonomy analyses
3.9.1.1. Determination of development degree on the basis of the area of planted lands index
In accordance with the area of planted lands index, Meybod and Tabas have the best conditions with development degrees of 0 and 0.0013 respectively. Abarkooh and Sadough have place in third and forth degree with development degrees of 0.21 and 0.45, respectively.
Ardakan, Bafgh and Khatam have unsuitable conditions with development degrees of 0.57, 0.58 and 0.63 respectively. Yazd, Taft and Mehriz have the worst with development degrees of 0.37 (Fig 3).
Fig. 3. Ranking of the urban areas of Yazd province on the basis of the planted lands area index
3.9.1.2. Determination of development degrees on the basis of the area of irrigated and protected lands
Tabas, Meybod and Sadough have the best condition with development degrees of 0, 0.03 and 0.22, respectively in accordance with the area of irrigated and protected lands. Abarkooh and Bafgh have unsuitable condition with development degrees of 0.53 and 0.64, respectively. While Yazd, Taft and Mehriz have the worst conditions with development degrees of 0.83 (Fig 4).
3.9.1.3. Determination of development degrees on the basis of area of restricted lands
Fig. 4. Ranking of the urban areas of Yazd province on the basis of the area of irrigated and protected lands index
Fig. 5. Ranking of the urban areas of Yazd province on the basis of enclosure lands index
3.9.1.4. Determination of development degrees on the basis of dug and equipped wells, index
In accordance with the numbers of dug and equipped wells index and taxonomy analysis the following results have been obtained.
Bafgh with development degrees of 0 and Ardekan, Sadough and Abarkooh urban areas
Fig. 6. Ranking of the urban areas of Yazd province on the basis of constructed and equipped wells index
3.9.1.5. Determination of development degree according to proposed or performed combating desertification projects index
According to proposed combating desertification projects index and taxonomy analysis, these results have been obtained:
Ardakan and Bafgh have the most suitable condition with development degrees of 0 and 0.11, respectively. Sadough and Khatam have been assessed in next degrees with development degrees of 0.64 and 0.65 respectively. The other urban areas of the province have unsuitable conditions with the degree of 0.76 (Fig. 7).
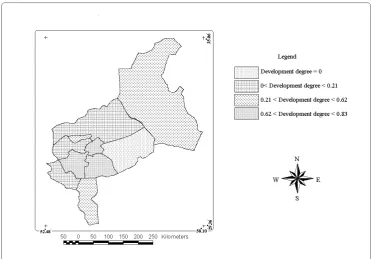
3.9.1.6. Determination of development degree on the basis of all combating desertification indices
In accordance with all combating desertification indices and taxonomy analysis it has been concluded that Sadough, Bafgh and Tabas have the best situation with development
degrees of 0.44, 0.45 and 0.49, respectively. Abarkooh,Ardakan and Meybod have been placed in the next ranks of combating desertification performance development. Khatam has unsuitable condition with the degree of 0.73. Yazd, Taft and Mehriz are the most deprived urban areas from all combating desertification indices viewpoint (Fig. 8).
Fig. 8. Ranking of the urban areas of Yazd province on the basis of all combating desertification indices
In order to assess combating desertification status comprehensively as well as to separate from evaluation of development degree of combating desertification indices, the area of desert lands and the area of desert lands of each
city and the province and the risk of desertification occurrence have been considered and the obtained results are shown in Figs 9, 10 and Table 6.
Fig. 9. The area of desert lands of Yazd province (Reference: Jihad- Agriculture Organization of Yazd province, 2006.)
0 500000 1000000 1500000 2000000 2500000 3000000 3500000
Ar
e
a
(
h
a
Abarkooh Ardekan Bafgh Taft Khatam Sadough Tabas Mehriz Mybood Yazd
City
Fig. 10. The comparative graph of desert lands area to the city and province area (Reference : Forest, Range and Watershed Management Organization & Tak-sabz company, 2002.)
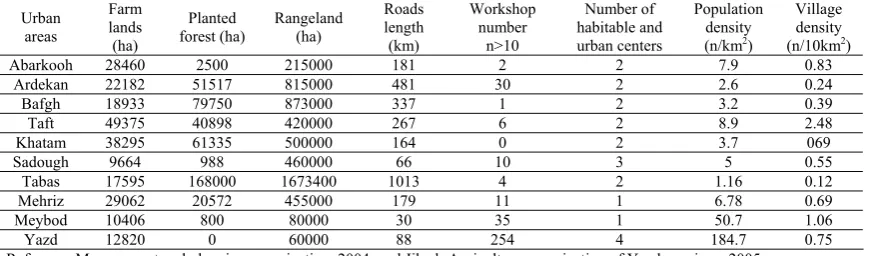
Table 6. Potential resources affected by desertification process
Village density (n/10km2)
Population density (n/km2)
Number of habitable and urban centers Workshop number n>10 Roads length (km) Rangeland (ha) Planted forest (ha) Farm lands (ha) Urban areas 0.83 7.9 2 2 181 215000 2500 28460 Abarkooh 0.24 2.6 2 30 481 815000 51517 22182 Ardekan 0.39 3.2 2 1 337 873000 79750 18933 Bafgh 2.48 8.9 2 6 267 420000 40898 49375 Taft 069 3.7 2 0 164 500000 61335 38295 Khatam 0.55 5 3 10 66 460000 988 9664 Sadough 0.12 1.16 2 4 1013 1673400 168000 17595 Tabas 0.69 6.78 1 11 179 455000 20572 29062 Mehriz 1.06 50.7 1 35 30 80000 800 10406 Meybod 0.75 184.7 4 254 88 60000 0 12820 Yazd
Reference:Management and planning organization. 2004; and Jihad- Agriculture organization of Yazd province, 2005
4. Discussion and Conclusion
The study of research references showed that there is no record in applying organizing methods such as taxonomy analysis for assessing development and zoning desertification at the national and international level. So, comparing the results of this study With similar studies is not possible.
The results of analysis show that Yazd, Taft and Mehriz have the most unsuitable and instable conditions with development degrees of 0.89. Although the area of deserted lands in Taft and Mehriz (about 120000-124000 ha) and their proportion to whole area of the mentioned urban areas (20.74% and 18.38% respectively) are small and negligible that it is justified limitations of performed combating desertification project. Because of existence of considerable and potential resources affected by desertification such as farmlands, industrial centers, populated areas, the effects of desertification development is considerable. Although Yazd has negligible desert lands area
(145000 ha) the area of desert lands to the area of the city is high (58.6%). In addition, the city is political center of the province and there are many potential resources such as industrial and population centers in the boundaries of the city that have been affected by desertification. Khatam has unsuitable and instable conditions with development degree of 0.73 and with respect to the city has the largest farming lands (about 380000 ha) it can be affected by desertification. Ardakan has not suitable condition with development degree of 0.57 and with respect to the area of desert land of the city (920000 ha) and its proportion to whole lands of the city (39.89%) is high.
According to the conducted analysis, Sadough, Bafgh and Tabas have suitable development in combating desertification indices. With respect to the large area of desert lands in the mentioned urban areas (139000, 736000, 3311000 ha, respectively) and their proportion to the area of the city and the province are high (24.73, 1.08, 48.91, 5.73, 60.3 and 25.78) and affected potential resources are
0 10 20 30 40 50 60 70 Ar ea (%
Abarkooh Ardekan Bafgh Taft Khatam Sadough Tabas Mehriz Mybood Yazd
City
also considerable (Figs 9, 10 and Table 6), therefore desertification indices condition has been assessed positively in the urban areas. In accordance with the results, it is essential to consider potential resources affected by combating desertification and desert lands in planning and future investments in order to achieve sustainable development in arid and semi- arid areas.
References
Azar, A., and Rajabzade, A., 2003. Applied decision making, MADM performance, Negaheh Danesh press, 183 p. (In Farsi).
Bergamp, G., 1995. A Hierarchical Approach for Desertification Assessment, Environmental Monitoring and Assessment, 37, pp. 59 -78.
Dregne, H.E., 1999. Desertification assessment and control. In: The United Nations University (Ed.). New Technologies to Combat Desertification, Proceedings of the International Symposium held in Tehran. Iran, 12–15 October 1998, 121pp.
Forest, Range and Watershed Management Organization (FRWMO), 2005. National program for desert land management of Iran, Deputy State of Rangeland and soil, Office of desertification and sand fixation, Tehran. (In Farsi), 112 pp.
Forest, Range and Watershed Management Organization (FRWMO), (2004). National program for comparison desertification and decline of drought effects, Tehran. (In Farsi), 159 pp.
Forest, Range and Watershed Management Organization (FRWMO), 2003. Country Studies of desertification projects, Deputy State of Rangeland and soil, Office of desertification and sand fixation, Tehran. (In Farsi), 201 pp.
Forest, Range and Watershed Management Organization (FRWMO) and Tak-sabz company., 2002. Project of recognition of critical centers of wind erosion and determination of executive priorities of the country. Tehran. Author. (In Farsi), 71 pp.
Institute of planning and agriculture economics research, 2001. Integrated project of reclamation and
development of agriculture and natural resources of different catchments areas of Iran, Tehran. Author. (In Farsi), 149 pp.
IRAN., UNEP., FAO., 1999. Desertification and its control in Iran, International expert meeting on special needs and requirements of developing countries with low forest cover and unique types of forests. Available from:
http://www.1fccs.net/forestry3.htm.
Jihad- Agriculture Organization of Yazd province, National Center for dedesertification, 2006. Studies for detection of critical wind erosion Critical focus and determination of Executive priorities of Yazd province, (Research projects), Yazd, 96 pp.
Jihad- Agriculture Organization of Yazd province, 2005. Aspects of agriculture in Yazd province, Yazd, Project and planning management. (In Farsi), 71 pp.
Kochpideh, N. and Keykhosravi, D., 2007. Evolution date of Natural Resources of Iran, Pooneh press, 95 p. (In Farsi), 91 pp.
Lillesand, T. M., and Kiefer, R. W., 2000. Remote sensing and image interpretation , 4th ed, New York,
John Wilew and sons, 115pp.
Management and planning organization, 2004. Integrated researches of Yazd province. Management and planning organization of Yazd press. (In Farsi), 73 pp
Sadeghi Ravesh, M.H., 2008. Investigation of effective desertification factors on environment degradation. A thesis submitted to graduate studies office in partial fulfillment of the requirement for the degree of Ph.D., Azad University. (In Farsi), 141 pp.
Sadeghi Ravesh, M. H., Ahmadi. H., Zehtabian, G. R., and Rehayi Khoram, M., (2009). Development of the Numerical Taxonomy Model to Assess Desertification: An Example of Modeling Intensity in Central Iran. Journal of Philipp Agric Scientist, 92:
213- 227.
Thomas, D. S. G., 1997. Science and desertification debate, Journal of Arid Environments, 37: 599-608.
Veron, S. R., Paruelo, J. M., and Oesterheld, M., 2006. Assessing desertification. Journal of Arid Environments, 6: 751-763.