The Strength of the Bus Structure with the Determination of
Critical Points
Dušan Mežnar* - Momir Lazovič
Tovarna Vozil Maribor d.o.o., Skupina Viator&Vektor, Slovenia
A monocock structure of an airport bus is a very demanding product as regards its strength. With the application of the FEA (Finite Element Analysis
)
method the allegedly critical points of the framework were determined; these especially occurred on the door frameworks. The experimental methods of measuring mechanical deformations confirmed the presumptions that maximum deformations measured at the points which were previously analysed with the FEA method. The driving regime with a maximum speed of 40 km/h in a circle with a minimum turning radius and a changeable regime of acceleration and braking proved critical. The measurements led to appropriate construction amendments, additional strengthening of the framework and other measures which fulfilled the required strength criteria.©2010 Strojniški vestnik - Journal of Mechanical Engineering. All rights reserved. Keywords: buses, motor vehicles, bodies, reinforcements, strength
0 INTRODUCTION
The framework of a bus is a self-bearing construction made from steel profiles welded together in a monocock.
The monocock consists of a chassis frame and the frameworks of the front and rear panels, the left and the right panels, the roof, the dash board and other components.
The chassis and the body are one and the same structure.
The self-bearing monocock bus construction means that it is completely prepared for the installation and fitting of the bus chassis and the body systems and sets.
The monocock construction predetermines the places where the engine, the transmission gear, the suspension, the axles, the steering system and the other equipment will be fitted. A sufficient rigidity of the construction ensures elastic deformations of the bus framework, but keeps them within the maximum permissible limits so that they do not affect the functions of individual aggregates and systems.
Above all this refers to the door function; their opening and closing, a limited deformation of the air-conditioning device mounted on the roof, and the unaffected function of the propulsion installations, the engine etc. There should be a favourable ratio between the rigidity and the weight of the bus which also serves as a criterion for proving and estimating the
successfulness of the construction in reference to its carrying capacity and own weight [1].
A special feature of the airport bus regarding the wheelbase of dimension 8400 mm was taken into account. Therefore specific and especially extreme loads were included in the project and construction analyses. The strength analysis provides a comparison with the data on similar buses which in the past suffered from the occurrence of cracks, roof waving, deflections of the tracks, cracks on the door corners etc.
1 THE BASIC STRUCTURE
A monocock consists of four modules:
a) the chassis frame,
b) the left and right panel frameworks,
c) the front and real panel frameworks,
d) the roof.
The basic part of the monocock is the chassis frame onto which the panels and the roof are mounted. The positioning of the main points for the installation of the systems and aggregates is controlled vertically with regard to the floor, laterally with regard to the centre of the axles and longitudinally with regard to the determined distances.
metal sheets to the monocock structure which provides the latter with reinforcement and at the same time solves the issues of noise and temperature isolation, vibrations, uneven surfaces etc.
2 A MONOCOCK, THE SELF-BEARING BUS CONSTRUCTION
Monocock is the self-bearing construction for fitting of the propulsion system of the vehicle: the engine, the clutch, the transmission gears, the suspension, the axles and individual sets of the braking, steering and other systems.
Due to this function, the monocock is an essential part of the bus as it has to be designed in a way which enables an uninterrupted and simple fitting of all the systems and aggregates to their pre-determined installation positions. The self-bearing monocock construction is a step forward and represents a pre-defined form, design and function. In addition, all analyses of the crash impact tests are taken into account.
3 THE APPLICATION OF THE FEA METHOD
A linear modular analysis FEA is used to determine the basis for the analysis and testing of the strength with an experimental method. The objective is determination or a rough estimation of the load and deformations of the monocock.
Fig. 1. FEA with a local concentration of tension
More specific data are only obtained experimentally using the strain gauge, i.e. by applying the method of measuring the strength with electrical resistance. The FEA model only served to determine the locations where the measuring tapes will be applied (Fig. 1).
On the most loaded locations 32 points were determined at which measuring tapes were adhered to the framework at an early stage of the monocock construction. In this phase the starting values of deformations and strength were determined which had a »zero value« in the finished bus – the system was re-set and the bus's own deformations were neutralised after the installation of the bus equipment; so in measurements only absolute values were taken into account.
Combinations of measuring tapes (Fig. 2) which registered deformations in all directions, i.e. in x, y, z orientations, were used. These were linear measuring tapes and rosettes which are normally used in measuring composed loads and deformations.
Fig. 2. Adherence of the measuring tapes
4 PREPARATION OF THE CONSTRUCTION FOR MEASUREMENT
The self-bearing bus construction was tested using the measuring tapes on 32 locations (Fig. 3) which were determined after a preliminary analysis and a FEA calculation. The most critical points were the corners of the six bus doors which was also indicated by the tension measurement [2].
loading, i.e. for different regimes of driving of an unloaded and loaded vehicle. The following analyses were made [3]:
analysis of the vehicle's statics,
analysis of acceleration and driving ahead,
analysis of braking,
analysis of driving in a circle with
acceleration and braking.
The maximum permissible tension with regard to the used material and the manner of use of the bus was 150 MPa.
An example of the tension calculation is given according to the equation Eq (1) .
E 2.1 10 850 178.5 N/mm (MPa) 5 2 . (1)
Table 1 presents partial results of the measurements of the bus structure strength for the different driving conditions.
5 THE METHODOLOGY OF MEASUREMENTS AND MARGIN
CONDITIONS
Maximum tension values were achieved at the measuring points during the driving of a loaded bus in a circle with braking. The test surface on which the experiment was carried out was uneven with holes and bumps. The tension oscillations were especially emphasised due to the impact loads at passing through obstacles [4] and [5]. We arrived to the following conclusions:
a) The testing, i.e. measuring of the propulsion
strength of the bus framework was carried out under special conditions which are not suitable for the regular use of the bus. The driving regime of a fully loaded bus with sharp braking in a bend presented a critical test of the strength.
a) b)
a) 1 – A rear door pillar, 6 – A middle door pillar, 2 – B front door pillar
b)26 -27 – A front door pillar, 21 – A middle door pillar, 16 – H holder
Fig. 3. Measuring points: a) on the left, b) right side of the framework
Table 1. Maximum deformation values (m/m)
Point Driving regime 1 6 12 16 21 26 27
01 unloaded – on the spot without zero adjustment 155 -600 25 140 -670 90 -60
03 unloaded - driving 15,5 -37 -20 5 - 11 7
07 unloaded – driving – bend + breaking 120 180 295 310 - 110 160
08 loaded -70 340 30 5 320 -90 130
10 loaded – driving + braking -300 620 70 380 530 -260 330
12 loaded – bend + braking 320 660 -400 380 850 -280 440
13 loaded – on the spot – elevated at the back 1075 350 -360 -140 400 -185 250
14 loaded – driving – without H-holder -695 625 -200 250 570 -200 360
b) In the case of an unloaded bus the deformations and tensions at point 16 (65.1 MPa) and at point 12 (61.95 MPa), both under 150 MPa which is supposed to be the maximum permissible value of the strength of the framework material.
c) The design relating to the propulsion strength
derives from the loading conditions which were determined according to the following criteria:
70% driving on the airport:
o 40% acceleration and driving,
o 30% normal braking (extreme
braking 2 to 5%),
o 30% driving in a circle;
30% waiting – staying at standstill.
6 THE MEASURES FOR INCREASING THE RESISTANCE MODULUS IN THE
LONGITUDINALDIRECTION
Regardless of the test results the following measures for increasing the resistance modulus in the longitudinal direction were taken [6]:
strengthening of individual parts of the
existing construction: the track, the door pillars, the roof etc.,
new solutions on the framework of the second
prototype which included additional joints in the framework,
other measures – modifications of the
framework.
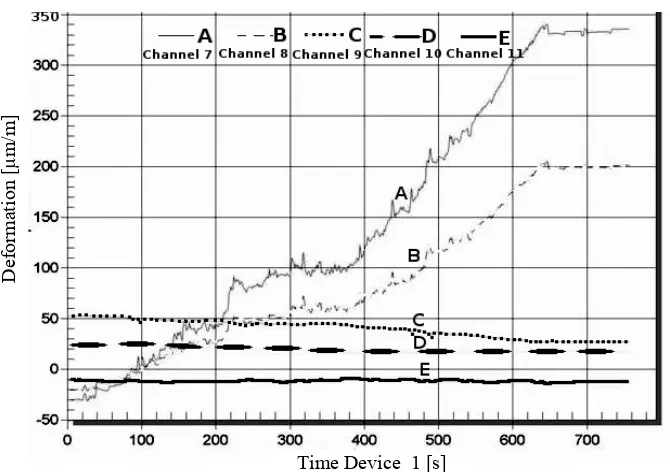
All critical points which were determined on the basis of FEA were constructionally analysed and appropriately strengthened. Figs. 4 to 7 show deformations of the critical points on the framework and in the area of the opening for the middle bus door [7]. The measuring points 6 to 10 determined deformations on the left side of the middle door; the measuring points 21 to 25 determined deformations on the right side of the middle door in the case of a fully loaded bus. Position 6 was a linear strain gauge on the lower part of the horizontal profile near the front pillar of the right middle door. Position 7 was a linear measuring tape on the rear side of the front pillar of the right middle door near the upper horizontal profile. The measuring points 8, 9 and 10 were joined in one strain gauge – a rosette, where two
of the three measuring tapes were adhered at 900
angle (horizontal and vertical network) and the
third measuring tape was adhered at 450 angle [8]
to [9]. The rosette was located in the middle of the front strengthening plate to the right of the middle door [10].
Fig. 4. Strains at measuring point 6 to 10 of a loaded vehicle
D
efo
rmatio
n [µm/m]
Fig. 5. Strains at measuring point 21 to 25 of a loaded vehicle
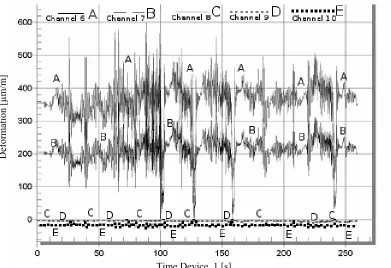
Fig. 6. Dilatation at measuring point 6 to 10 during the driving and braking of a loaded vehicle
D
efo
rmatio
n [µm/m]
D
efo
rmatio
n [µm/m]
Fig. 7. Strains at measuring point 21 to 25 during the driving and braking of a loaded vehicle
The location of the measuring tapes on the right side of the framework followed the same principle as on the left side which is shown in Fig. 3. The deformations of the framework at critical points did not exceed 350 m/m at static loading [11] and achieved maximum 800 m/m during the driving of a loaded bus [12] and [13,14].
7 CONCLUSION
The experimental methods of measuring mechanical deformations confirmed the presumptions that maximum deformations were measured at the points which were previously analysed with the FEA method. The driving regime with a maximum speed of 40 km/h in a circle with a minimum turning radius and a changeable regime of acceleration and braking proved critical. The measurements led to appropriate construction amendments, additional strengthening of the framework and other measures which fulfilled the required strength criteria.
8 REFERENCES
[1] Kušar, J., Duhovnik, J., Tomaževič, R.,
Starbek, M. (2007). Finding and evaluating customers needs in the product-development
process. Strojniški vestnik – Journal of
Mechanical Engineering, vol. 53, no. 2, p. 78-104.
[2] Puklavec, B. (2004). Preparation of
measuring points for strain measurement on the prototype of the Neoplan airportbus. University of Maribor, Faculty of Civil Engineering, Institute of Civil and Traffic Engineering, Maribor. Documentation of Tovarna vozil Maribor.
[3] Puklavec, B. (2004). Results of strain
measurements on the prototype of the Neoplan airportbus. University of Maribor, Faculty of Civil Engineering, Institute of Civil and Traffic Engineering, Maribor. Documentation of Tovarna vozil Maribot. [4] Kušar, J., Bradeško, L., Duhovnik, J.,
Starbek, M. (2008). Project management of
product development. Strojniški vestnik –
Journal of Mechanical Engineering, vol. 54, no. 9, p. 588-606.
D
efo
rmatio
n [µm/m]
[5] Gnosa, S., Bartha, E. (2004). Testing protocol III. Neoplan Bus GmbH.
[6] Lazović, M. (2004). Measuring protocols
for airport bus Neoplan 11.11.2004, Car Factory Maribor.
[7] Lazović, M. (2005). Integral testing of
airport buses, 7th Conference and exhibition
of Inovative automobile technology, IAT'05. Bled, 21.-22. April, p. 271-281.
[8] Chen, L.F. (2004). Comparative analysis for bus side structures and lightweight
optimization. ImechE, Proc. Instn. Mech.
Engrs., vol. 218, part D: J. Avtomobile Engineering.
[9] Mc.Manus, K.J., Mann, A., Evans, R.P. (1998). The analysis of road roughness and the perception of road roughness. Proceedings of 5th international symposium
on heavy vehicle weights and dimensions in conjunction with 5th engineering foundation
conference on vehicle-infrastructure interaction, Maroochydore, Queensland.
[10] Matolcsy, M. (2001). Body section rollover test as an approval method for required
strength of bus superstructures. Automotive
and Transportation Technology Congress and Exhibition (P-371), Barcelona.
[11] de Aquiar, F.H.V., Gimenez, M.C., Pazian,
A., Spinelli, D.M. (2002). Frame structure
optimization for bus chassis. SEA International.
[12] Sharp, J., Pesheck, E., Nelson, D.,
McLellan, G.A. (2000). Orion bus industries: Virtual prototyping of a transit
bus to predict service life. 15 International
ADAMS User Conference, Rome ,Italy, 15.nov. 2000
[13] Gu, P., Slevinsky, M. (2003). Mechanical
bus for modular product design. CIRP
Annals-Manufacturing Tehnology, vol. 52, no. 1, p. 113-116.
[14] Bartha, E. (2005). Virtual prototyping of a
transit bus to predict service life. MAN