Journal of Chemical and Petroleum Engineering, University of Tehran, Vol. 48, No.1, Jun. 2014, PP. 15-25 15
* Corresponding author: Tel: +98- 21- 61112196 Email: [email protected]
A Numerical Study on Agglomeration in High
Temperature Fluidized beds
Zahra Mansourpour*, Navid Mostoufi and Rahmat Sotudeh-Gharebagh
School of Chemical Engineering, College of Engineering, University of Tehran, Tehran, Iran
(Received 6 August 2013, Accepted 4 March 2014)
Abstract
Soft-sphere discrete element method (DEM) and Navier-Stokes equations were coupled with equations of energy for gas and solids to investigate the process of agglomeration in fluidized bed of polyethylene particles at high temperature. The Newton’s second law of motion was adapted for translational and rotational motion of particles and agglomerates. The cohesive force for polyethylene particles was calculated based on a time dependent model for solid bridging by the viscous flow mechanism. The motion of agglomerates was described by means of the multi-sphere method. By taking into account the cohesiveness of particles at high temperatures and considering real dynamic agglomerates, the fluidization behavior of a bed of polyethylene particles was successfully simulated in terms of increasing the size of agglomerates. Effect of the inlet gas temperature on mass and size of agglomerates was investigated. A mechanistic study in terms of contact time, cohesive force and repulsive force, which are the key parameters in the formation of agglomerates, were also carried out.
Keywords
: Agglomeration, Discrete element method, Fluidized bed, High temperature solid bridgeIntroduction
In high temperature fluidized beds, such as gas-phase polymerization reactors and iron oxide reduction beds, formation of agglomerates via solid bridge is a well-recognized feature. In order to use these types of reactors more effectively, there is a need to obtain a fundamental understanding of the dynamic behavior of such systems. Fortunately recent progress in the computational resources, have allowed carrying out detailed simulations of different aspects of the complex phenomena occurring in the fluidized beds. Popular mathematical models proposed thus far can be grouped into two categories: the continuum-continuum approach at a macroscopic level represented by the so called two fluid model (TFM) [1] and continuum–discrete approach at a macroscopic level mainly represented by the so called combined computational fluid dynamics and discrete element method (CFD-DEM) [2]. In the CFD-DEM, the motion of particles is modeled as a discrete phase, described by the Newton’s second law of motion for an individual particle, while the flow of fluid (gas or liquid) is treated as a continuum phase, described by
16 Journal of Chemical and Petroleum Engineering, University of Tehran, Vol. 48, No.1, Jun. 2014
were defined as clusters of primary particles in which solid bridges sustain during the collision of particles. The formed agglomerates move only with the translational motion. The most important issue that can be detected by this definition is early de-fluidization of the bed. When particles stick to each other, both translational and rotational motions provide the real mobility of the fluidized bed. Omitting the rotational motion of agglomerates and considering the same temperature for particles lead to sudden de-fluidization of the bed in the model developed by Kuwagi et al. [7]. Therefore, the possibility of studying macroscopic behavior of particulate systems, which is controlled by interaction forces, is limited in this condition. Mansourpour et al. [8, 9] proposed a new approach according to the multi-sphere method based on the CFD-DEM to explore the agglomeration phenomena in a fluidized bed. The effect of operating condition including pressure and velocity on agglomeration state was investigated in macro and micro- scale studies.
In the present work, it was tried to define the sintered agglomerate as a real object in which its translational and rotational motions are calculated according to the multi-sphere method based on the CFD-DEM and investigate the effect of inlet temperature on the fluidization state. In the previous work [7] in which the effect of inlet temperature on the fluidization was considered, the motion of agglomerates and particles were described by translational motion rather than both translational and rotational motions which are the realistic description of object’s motion according to the laws of dynamics. Considering just the translational motion of agglomerates, results in the sudden fluidization of bed. But de-fluidization proceeds gradually when the motions of agglomerates are described based on both rotational and translational motions. The model was completed with applying energy balance equations for both gas and particles in order to consider
temperature distribution effect on agglomeration behavior. Formation of solid bridge between contacting particles was modeled by the viscose flow mechanism. The variation of the mass and the size of agglomerates were investigated at the various inlet gas temperatures.
2. Model developments
The CFD-DEM code used for the present work was developed in our previous work [10]. In this model, the gas phase was described with the volume-averaged Navier-Stokes equation. The Newton’s second law of motion was adapted for translational and rotational motion of particles and agglomerates at any time t as follows:
f f f if f
k f dt
V d
m coh
i g j
i t cont j contnij i
i
i
1( ,,, ,,,) , , (1)
f R dt
d
I cont ti j
k
j i j
i i
i
, , , 1 ,
(2)
In the agglomeration phenomenon, particles adhere to each other via solid bridge and form larger agglomerates. Since agglomerates with irregular shapes are formed during the agglomeration process, it was required to adapt an appropriate model to track them as a real object. As the agglomerate is a collection of spherical particles which can retain their solid bridge with no overlap, the motion of agglomerates can be described according to the multi-sphere method proposed by Kruggel-Emden et al. [11]. The cohesive force ( fcoh) was calculated based on a time dependent model proposed by Seville et al. [12] for solid bridging by viscous flow mechanism for polyethylene (PE) particles at high temperature. When the temperature of a particle increases to higher than the softening point of PE (95 0C), the particle surface becomes sticky. Colliding particles with sticky surface grow towards larger agglomerates due to formation of permanent solid bridges.
A Numerical Study on Agglomeration ….. 17
a) In each time step, when it is found that two particles have newly come into contact, the contact time (tcon) corresponding to their
inter-particle solid bridge is stored. The radius of solid bridge increases during the contact time with respect to the temperature of colliding particles according to the following formula [12]:
) 2
3 (
2 / 1
. .
p con p
x t
r
b
s (3)
The rate of material migration to the contact point is a sensitive function of temperature in the viscous flow mechanism. The sintering is opposed by viscosity which has the Arrhenius type function of temperature:
) exp(
0
T R
Es
p
(4)
The solid bridge force is then expressed as follows:
2 ..
. . . sb sb
coh
x
f (5)
b) In each time step, there are two possibilities for particles that were previously in contact:
b-1) If they are still in contact, their contact time is modified as:
t t
tcon. con.,0 (6)
and the solid bridge force is calculated according to Eqs. (3) –(5) in this time step. b-2) If the deformation period is finished and particles are not in contact anymore, the solid bridge is examined whether it can remain or not. The solid bridge strength can be judged by the maximum repulsion force (frep,max) during deformation. The value of
frep,max can be calculated according to the
maximum deformation during the contact period by the following equation:
max max, n
rep k
f
(7)If frep,max>fcoh the solid bridge breakage
takes place but if frep,max<fcoh the solid
bridge remains firm between the two colliding particles and they are sintered and remain in the same agglomerate.
c) In each time step, when the solid bridge between two particle is broken in a collision, xs.b. and tcon are setto zero.
The velocity of any agglomerate formed from sticking individual particles, particle and an agglomerate or two agglomerates is calculated according to the momentum conservation before and after the collision. Since the solid bridging is a time dependent
mechanism, incorporating the agglomeration model into the CFD-DEM approach is possible via the soft sphere approach. Equations used to calculate the fluid-particle force and contact forces between the particles in this work are listed in Table 1. Equations of energy balance were considered for both gas and particle phases. More details about the trajectory of gas and solid phase coupling and strategy of solving are described by Mansourpour et al. [10].
3. Results and discussion
3.1. Case studyTo explore the agglomeration phenomenon in a gas-solid fluidized bed, a set of numerical simulations were conducted. Table 2 summarizes the computational conditions and parameters used in these simulations. The coefficients of restitution and friction for PE particles were considered as 0.9 and 0.3, respectively. The bed was rectangular with 0.06 m width, 0.24 m height and initially filled with 5000 particles. The thickness of the bed was 0.001 m (equal to the diameter of large particles). The packing condition was achieved by randomly positioning the particles in the bed and allowing them to settle by their gravitational force for one second (without cohesive force) which formed a packed bed with 0.06 m height. At this stage, the hot gas was injected into the bed through the uniform distributor considered for this bed. Initial temperature of particles and inlet gas temperature were 95 0C and 110 0C, respectively. Different operating temperatures, ranging from 100
0C to 130 0C, were used in simulations. The
18 Journal of Chemical and Petroleum Engineering, University of Tehran, Vol. 48, No.1, Jun. 2014
and viscous flow mechanism was considered based on the experimental data
reported by Seville et al. [13].
Table 1: Details of expressions used for calculating contact and drag forces acting on particle i
Forces or torque Symbol Equation
Normal forces Contact fcn,ij kn cij ni
) ( ,
Damping fdn,ij
i i ij r iV n n
) . ( ,
Tangential forces Contact fct,ij
i ij t ij t i ij t t ij
cn k t t
f
, , , , , min
Damping fdt,ij
j j i i i ij ri V t R R
, . Torque Interparticle j i T, ij c i f R , Gravity i g f ,
mg
i
Fluid drag force
i f
f,
i pi V U V 1
, 0.8
1 4 3 8 . 0 , 1 75 . 1 1 150 65 . 2 2 2 2 pi i f D pi i f pi f d V U C d V U d
1000 Re , 44 . 0 1000 Re , Re Re 15 . 0 1 24 , , , 687 . 0 , i p i p i p i p D C where: j i ij r i i i i ji V V V
R R n x x
R
, , , c k i
i fi
B fp f i pi f i
p F f V
V U d c / ,
Re ,
1 ,
Table 2: Computational conditions used in the present simulations
Particle phase Gas Phase
Particle Polyethylene Fluid Air
Particle shape Spherical CFD cell Width (m) 3×10⁻³
Number of Particles 2500 Large
2500 Small Height (m) 3×10
-3
Particle diameter (m) 0.001,0.0008
Density (kg.m-3) 920 Bed geometry Width (m) 0.06
Spring constant (N.m-1) 800 Height (m) 0.24
Sliding friction coefficient 0.3 Thickness (m) 1×10⁻³
Restitution coefficient 0.9
Heat capacity (W.kg-1.K-1) 2.01×10³ Viscosity (kg.m-1.s-1) 1.85×10⁻⁵
Normal tensile strength (Pa) 30×106 Bed distributor Porous Plate
Surface tension (Nm-1) 0.0275 U
mf (m.s-1) 0.187
Gas velocity (m.s-1) 4
Umf Time step (s) 5×10⁻⁷ Conduction coefficient
(W.m-1.K-1) 2.9×10
-2
Heat capacity (W.kg-1.K-1) 1.8×10³
A Numerical Study on Agglomeration ….. 19
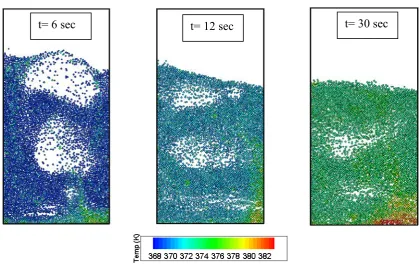
Figure 1 shows the snapshots of the agglomerating fluidized bed in which the hot gas (110 0 C) was injected to the bed at the superficial gas velocity of 0.75 m.s-1. In this figure, particles are colored according to their temperature. As can be seen in Figure 1, at the beginning of simulation (t = 6 sec.), injecting the hot gas through the distributor only affects the temperature of particles near the distributor. There are hot zones at the vicinity of the distributor as well as at the corner of the bed. According to the viscous flow mechanism (Eqs.(3)-(5)), the probability of solid bridge formation between two particles increases by increasing the contact time and temperature of contacting particles. Therefore, dense regions, in which particles have more contact time and dead zones at the corner of the bed and the distributor zone with high temperature, are introduced as regions in where the possibility of the agglomeration formation is greater. As a result, only particles at the distributor zone have the potential to form the agglomerates and light agglomerates comprised of two or three particles start to form. At this time, the bed is completely fluidized and vigorous bubbles pass through the bed. Rising bubbles in the bed create particle circulation which results in the mixing of particles and increasing the bed temperature, generally. Thus, after elapsing enough time (t = 12 sec.), not only the particles at the vicinity of the distributor, but also the particles at the middle and top of the bed may participate in agglomeration formation. At this time, the bed is gradually transformed into a de-fluidized bed with small bubbles. At the end of simulation (t = 30 sec.), massive agglomerates are gathered in the distributor zone and a de-fluidized layer is formed in this region. This is due to the fact that de-fluidization in this process occurs as a consequence of two different mechanisms: sintering and segregation. Formation of large agglomerates, which have minimum fluidization velocities greater than the gas velocity applied in simulation, leads to accumulation of a large fraction of
agglomerations at the bottom of the bed. Thus, segregation promotes the de-fluidization by increasing the contact time of particles. In this situation, small bubbles exist only in the middle or surface of the bed.
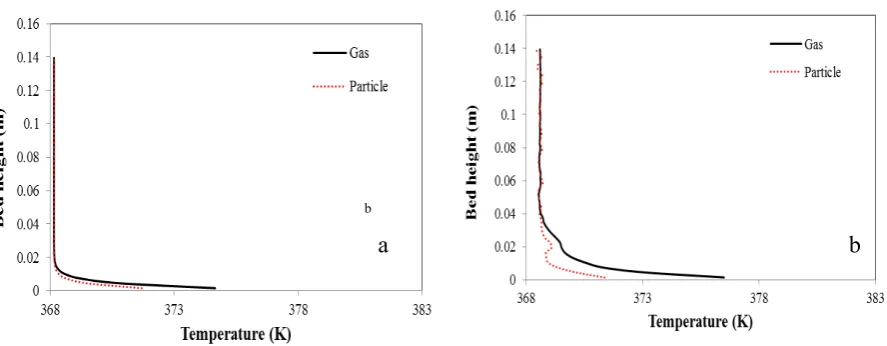
Figure 2 shows longitudinal temperature profile of particles and gas at two gas velocities. A steep gradient of the bed temperature can be found near the distributor above which the bed temperature is almost constant. By increasing the inlet gas velocity, the gas affects on the particles at higher levels of the bed due to enhancing the energy content introduced into the bed and increasing the heat transfer coefficient between gas and particles. These results show that the distributor zone is a region with the most possibility of agglomerate formation in the bed and a major fraction of agglomerates form at the distributor zone.
3.2. Macro-Scale studies
20 Journal of Chemical and Petroleum Engineering, University of Tehran, Vol. 48, No.1, Jun. 2014
DEM-CFD is an appropriate tool for particle-level studies such as agglomeration process. Therefore, the effect of inlet gas velocity is investigated in macro and micro scales in the following section.
Figure 3 demonstrates the number of agglomerates versus time at various inlet gas temperatures at t=20 sec. It can be seen from this figure that the number of agglomerates increases with increasing the inlet gas temperature. Because the temperature of colliding particles increases with increasing the inlet gas temperature, the possibility of formation of stronger solid bridge becomes greater. Thus, the number of solid bridges which can sustain versus repulsive forces is increased.
The influence of inlet gas temperature on the mass of agglomerates at t= 20 sec. is
shown in Figure 4. According to this figure, the distribution of agglomerates shifts to heavier agglomerates and its tail becomes wider as the inlet temperature is increased from 100 0C to 120 0C. Also, Figure 4 demonstrates that there are two peaks at the inlet gas temperature of 130 0C: one corresponding to the light agglomerates and the other to the massive agglomerates containing more than ten particles. The higher inlet gas temperature increases the temperature of colliding particles. As the rate of material migration to the contact point increases exponentially with temperature of colliding particles, the rate of sintering enhances dramatically at 130
0C. This situation results in formation of
massive agglomerates which form a de-fluidized layer at the distribution region.
Figure 1: The snapshots of particles temperature during the agglomeration phenomena
A Numerical Study on Agglomeration ….. 21
Figure 2: Vertical profile of particles and gas temperature a) U/Umf=2, b) U/Umf=5
Figure 3: The profiles of number of agglomerates versus time at various inlet gas temperatures
Figure 4: Distribution of mass of agglomerates at different inlet gas temperature
0 200 400 600 800 1000 1200 1400 1600
0 5 10 15 20
Number of
Agglomerates
(-)
Time (sec)
T=100 C T=110 C T=120 C T= 130C
0 0.0002 0.0004 0.0006 0.0008 0.001
0.1 1 10 100
Agglomerate mass
(kg)
Distribution of number of particles in agglomerates (-)
T= 100 C T= 110 C T= 120 C T= 130 C
b
22 Journal of Chemical and Petroleum Engineering, University of Tehran, Vol. 48, No.1, Jun. 2014
Figure 5: The distributions of cohesion force (curves in left side) and repulsion force (curves in right side) in the logarithmic scale at different inlet gas temperature
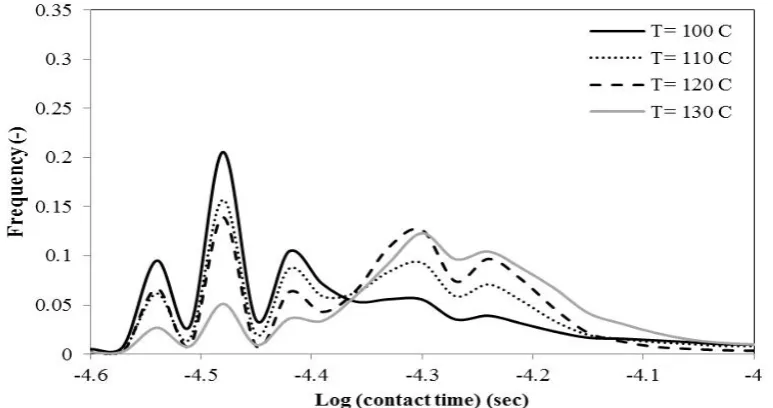
Figure 6: Distribution of particles logarithmic contact time for different gas velocities at t = 15 sec
3.3. Micro-Scale studies
To investigate the cause of these macro-scale studies, it is necessary to focus on micro-scale phenomena and particle-particle interactions. It is known that there exist three phenomena in formation of a permanent solid bridge:
1) The possibility of solid bridge formation between the particles in contact. The lower number of contacts between particles reduces the possibility of solid bridge formation.
2) The possibility of permanent solid bridge formation which is sufficiently strong to resist the breakage forces due to movement of other particles and bubbles. According to the viscose flow mechanism (Eqs. 3-5), the cohesive force (fcoh) depends on the temperature of
colliding particles and their contact time. 3) The chance of breakage of solid bridge is
A Numerical Study on Agglomeration ….. 23
the inter-particle cohesive force due to increase in the maximum overlap and repulsion force (frep,max).
Therefore, understanding the microscopic mechanism in terms of contacts time tcont, fcoh and frep,max is vital to truly
explore the agglomeration phenomena at high temperatures.
According to the above mentioned concepts, cohesion and repulsion forces affect on the formation of permanent solid bridge between particles in contact. Distributions of cohesion and repulsion forces at various inlet gas temperatures are illustrated in Figure 5. It can be seen from this figure that as the temperature increases, the cohesion force becomes greater while the repulsion force does not change significantly. According to Figure 1, the temperature of particles is increased and in return the cohesion force is enhanced with increasing the inlet gas temperature. On the other hand, the repulsion force between colliding particles does not change considerably. According to the criteria for examination of solid bridge strength described in solid bridge force section, the permanent solid bridge is formed when the cohesion and repulsion forces have the same order of magnitude. Therefore, the amount of overlap between the curves of cohesion and repulsion forces can be a criterion for forming permanent solid bridge. According to Figure 5, the overlap increases with increasing the inlet gas temperature. In fact, the cohesion force grows about two orders of magnitudes while repulsion force does not increase significantly by increasing the temperature from 100 0C to 130 0C. Thus, the cohesion force, as a positive factor in sintering, is more sensitive to increase in the inlet gas temperature than the repulsion force, as a negative factor in the formation of agglomerates.
Distribution of the contact time of particles in the logarithmic scale at various inlet gas temperature at t = 15 sec. is shown
in Figure 6. This figure shows that the contact time between particles increases
when the inlet gas temperature is increased. By increasing the inlet gas temperature, the sharp peaks become smaller while the wide part of distribution grows. This is due to this fact that as the temperature is increased, the number of individual particles with smaller contact time decreases and the number of large agglomerates with greater contact time increases. On the other hand, segregation phenomena and reduction in the movement of agglomerates lead to growth of the wide part of the distribution, especially at the highest temperature (130 0C). As mentioned in Figure 4, massive agglomerates with more than ten particles form in 130 0C. These massive agglomerates result in a wide distribution at large contact times.
Conclusions
24 Journal of Chemical and Petroleum Engineering, University of Tehran, Vol. 48, No.1, Jun. 2014
movements promote the agglomeration process and initiate the de- fluidization state in the bed in shorter times.
Nomenclature
CD fluid drag coefficient
dp particle diameter, m
e restitution coefficient
Es activation energy of surface
viscosity, J mol-1
Coh
f cohesive force between particle i
and j, N
j ik n Cont
f , , ,
normal contact force between
particle i and j or particle k in
agglomerate i and particle j, N
j i t Cont
f ,,,
tangential contact force between
particle i and j or particle k in
agglomerate i and particle j, N
i f
f ,
particle-fluid interaction force, N
i g
f, gravitational force of particle i or
particle k in agglomerate i N
max ,
rep
f max repulsive force of particle i
and j or particle k in agglomerate i
and particle j, N
g gravitational acceleration, m s-2
Ii moment of inertia of particle or
agglomerate i, kg m2
ki number of contacting particle j
with particle i or particles k in
agglomerate i
kn normal spring coefficient, N m-1
kt tangential spring coefficient, N m-1
mi mass of particle and agglomerate i,
kg
n unit vector
r reduce radius of colliding
particles, m
R gas constant, J mol-1K-1
j i
R, The vector from particle i to
particle j, m
Re reynolds number
t time, s
con
t contact time, s
0 ,
con
t contact time in previous time step,
s
ij torque, N m
T maximum temperature of colliding particles, K
U fluid velocity, ms-1
Umf minimum fluidization velocity, ms -1
Vc cell volume, m3
Vi velocity of particle and
agglomerate i, m s-1
Vp particle volume, m3 .
.b s
x solid bridge radius, m
Greek symbo
β inter-phase momentum transfer
coefficient, kg m-3s-1
γp surface tension, Nm-1
δ deformation coefficient, m
ε Porosity
η damping coefficient
μ friction coefficient
µf fluid viscosity, kg m-1 s-2
µp particle viscosity, kg m-1 s-2
µ0 pre exponential factor, kg m-1 s-2 ρf fluid density, kg m-3
ρp particle density, kg m-3 σ normal tensile strength, Pa
ωi angular velocity of particle i or
particle k in agglomerate i, s-1
Subscript
g Gas p Particle
s.b. solid bridge
References
:
1- Anderson, T.B. and Jackson, R.A. (1967). "Fluid mechanical description of fluidized beds: Equations of motion." Ind. Eng. Chem. Fund., Vol. 6, pp. 527-539..
2- Cundall, P.A. and Strack, O.D.L. (1979). "A discrete numerical model for granular assemblies." Geo technique, Vol. 29, pp. 47–65.
3- Deen, N.G., Annaland, Van Sint M., Van der Hoef, M.A. and Kuipers, J.A.M. (2007). "Review of discrete particle modeling of fluidized beds." Chem. Eng. Sci., Vol. 62, pp. 28-44.
A Numerical Study on Agglomeration ….. 25
5- Iwadate, Y. and Horio, M. (1998). "Prediction of agglomerate sizes in bubbling fluidized beds of group C powder." Powder Technol., Vol. 100, pp. 223-236.
6- Li, Sh., Marshall, J. S., Liu, G. and Yao, Q. (2013) "Adhesive particulate flow: The discrete-element method and its application in energy and environmental engineering.” Progr. Energ. Combust. Sci., Vol. 37, pp. 633-668.
7- Kuwagi, K., Mikami, T. and Horio, M. (2000). "Numerical simulation of metallic solid bridge particles in a fluidized bed at high temperature." Powder Technol., Vol. 109, pp.27-40.
8- Mansourpour, Z., Mostoufi, N. and Sotoudeh-Gharebagh, R. (2013). "A mechanistic study of agglomeration in fluidized beds at elevated pressures." The Canadian J. Chem. Eng., Vol. 91, pp. 560-569.
9- Mansourpour, Z., Mostoufi, N. and Sotoudeh-Gharebagh, R. (2014). "Investigating agglomeration phenomena in an air-polyethylene fluidized bed using DEM–CFD approach." Chem. Eng. Res. Des., Vol. 92, pp. 102-118.
10- Mansourpour, Z., Karimi, S. Zarghami, R., Mostoufi, N. and Sotoudeh-Gharebagh, R. (2010). "Insights in hydrodynamics of bubbling fluidized beds at elevated pressure by DEM–CFD approach." Particuology, Vol. 8, pp. 404-414.
11- Kruggel-Emden, H., Rickelt, S. Wirtz, S. and Scherer, V. (2008). "A study on the validity of the multi- sphere discrete element method." Powder Technol., Vol. 188, pp. 153-165.
12- Seville, J.P.K., Willett, C.D. and Knight, P.C. (2000). "Interparticle forces in fluidization: a review." Powder Technol., Vol. 113, pp. 261-268.