in the population sciences published by the Max Planck Institute for Demographic Research Konrad-Zuse Str. 1, D-18057 Rostock · GERMANY www.demographic-research.org
DEMOGRAPHIC RESEARCH
VOLUME 11, ARTICLE 1, PAGES 1-42
PUBLISHED 04 AUGUST 2004
www.demographic-research.org/Volumes/Vol11/1/
DOI: 10.4054/DemRes.2004.11.1
Research Article
Sociodemographic Effects on the Onset
and Recovery of ADL Disability among
Chinese Oldest-old
Danan Gu
Zeng Yi
1 Introduction 2
2 Data and methodology 5
2.1 Data source 5
2.2 Measuring the onset and recovery of ADL disability
6
2.3 Accuracy and reliability of ADL disability 7
2.4 Sociodemographic factors 7
2.5 Control variables 8
2.6 Analytic strategies 9
3 Results 10
3.1 Descriptive information of sociodemographic variables and ADL dynamic changes
10
3.2 Onset of disability 14
3.3 Recovering from disability 19
3.4 Difference between the estimates including and not including the ADL changes before dying
21
4 Discussion 24
5 Acknowledgements 30
Notes 31
References 33
Research Article
Sociodemographic Effects on the Onset and Recovery
of ADL Disability among Chinese Oldest-old
Danan Gu 1
Zeng Yi 2
Abstract
By pooling the data from the three waves (1998, 2000, and 2002) of the Chinese Longitudinal Health and Longevity Survey, this study examines the association of sociodemographic factors with the onset and recovery of ADL disability including changes in functional status before dying. The results show that the sociodemographic factors play some specific roles in disability dynamics at very high ages even after controlling for a rich set of confounders. Our results also point out that the conventional method, which excludes the information of ADL changes before dying due to unavailability of the data, overestimates the effects of age, gender, ethnicity, and living alone on disability transitions whereas it underestimates the effects of SES, although such discrepancies are not very big compared with the results including information of ADL changes before dying.
1
Research Associate at the Sanford Institute for Public Policy at Duke University. Correspondence should be sent to: Dr. Danan Gu, Sanford Institute for Public Policy, Duke University, 2024 W Main St., Durham, NC 27705, U.S.A. Email: [email protected]
2
1. Introduction
Understanding the disability dynamic mechanism could lead to better targeting of efforts to reduce or postpone disabilities at older ages (Melzer et al. 2001). A growing number of studies have shown strong associations of sociodemographic factors with the dynamic changes of disability in the elderly (e.g., Crimmins, Hayward, and Saito 1994; 1996; Gill, Robison and Tinetti 1997; Land, Guralnik, and Blazer 1994; Manton, Stallard, and Corder 1995). With few exceptions (e.g., Crimmins and Saito 1993), almost all prior studies consistently find that the incidence rate of disability increases with age, whereas the probability of getting better decreases with age (e.g., Crimmins et al. 1996; Gill et al 1997; Hayward, Crimmins, and Saito 1998; Laditka and Wolf 1998; Land et al. 1994; Manton 1988; Rogers, Rogers, and Belanger 1992). Gender difference in the dynamics of ADL disability is inconclusive. Some studies have reported that older males have an advantage in disability dynamics over older females (Crimmins et al. 1996; Hayward et al. 1998; Jagger, Arthur, Spiers et al. 2001), while some other studies provide an opposite result (i.e., elderly women have the advantage) (e.g., Crimmins and Saito 1993; Land et al 1994), and still others find that there is no significant gender difference in disability dynamics (Ferrucci et al. 1996; Guralnik et al. 1997; Rogers et al. 1992). Contradictory results of racial and ethnic difference in disability dynamics among elders are also frequently reported (Boult, Kane, Louis et al. 1994; Crimmins et al. 1996; Land et al. 1994; Mendes de Leone et al. 1997). Although most studies have shown that the higher SES could reduce the risk of the onset of disability and increase the likelihood to regain functioning at late ages (Crimmins et al. 1996; Land et al. 1994; Seeman et al. 1994), a small number of studies find that such protective effects are not significant or are weak (Melzer et al. 2001; van Groenou, Deeg, and Penninx 2001; Geroldi et al. 1996). Despite the challenges from several recent studies (e.g., Arber and Cooper 1999), the protective effects of marriage on disability at late ages have been widely recognized (Goldman, Korenman, and Weistein 1995; Murphy, Glaser, and Grundy 1997; Rogers et al. 1992). The effect of living arrangement on disability dynamics in older ages is somewhat less studied and the results are largely divided (e.g., Grundy 2001; Hebert Brayne, and Spiegelhalter 1999).
adjacent surveys for survivors and have not covered the disability dynamic information of deceased persons, however. So far, six approaches to deal with the disability of the decedents between survey intervals in the longitudinal study on disability transitions have been employed: (a) excluding decedents’ data from the analyses (e.g., Harris et al. 1989) (Note 1); (b) combining death and disability into a single category (e.g., Roos and Havens 1991); (c) considering death and disability as separate categories but excluding disability information for the decedents (e.g., Crimmins et al. 1996; Hayward et al. 1998); (d) assuming that the decedents’ probabilities of disability transitions are the same as those of survivors with the same sex, age, health status, and some other characteristics (Manton and Land 2000); (e) estimating simulated monthly transition probabilities of disability using the microsimulation approach (Laditka and Wolf 1998); and (f) including the decedents’ disability information before dying collected from the next-of-kin of the deceased respondents in the estimation of disabled life expectancy through an extended multi-state life table method (Zeng, Gu, and Land 2004). By comparing 24 monthly assessments of functional disability with a single assessment over a 24-month interval, Gill et al. (2002) found that the underestimation of disability was considerably high, and increased progressively as the length of assessment interval increased. Zeng et al. (2004) found that the disabled life expectancy was significantly underestimated if information concerning the changes in disability status before death were excluded.
have onset of a disease or have not yet been diagnosed with any disease except osteroarthritis (Note 2). Another study indicates that 20% of female centenarians and 45% of male centenarians could carry out ADL independently (Andersen-Ranberg et al. 1999). These studies provide evidence that the heterogeneity of disability dynamics in very high ages does exist. Awareness of the heterogeneity of functional ability, variations in rates of changes in functioning, and their correlates among the oldest-old population is very important in the study of healthy longevity. Disability dynamics among the oldest-old have not yet been systematically examined. Thus, improvement in knowledge of dynamic patterns of disability of the oldest-old would lead to the ability to better predict their future disability transitions, develop strategies, conduct intervention programs, and formulate sound policies.
The third limitation of previous studies is that most of them have been based on populations in Western developed nations, particularly in the Unites States and Europe, and research on disability of the elderly in developing countries has been rare, although several recent studies have dealt with a few Asian and African countries (e.g., Lamb 1997; Liu et al. 1995; Zimmer, Martin, and Chang 2002; Zimmer et al. 1998), but none of them focused on the oldest-old. China, a developing country, has the largest number of oldest-old in the world. The number of oldest-old in China in 2000 reached 12 million, and will climb to 23 million and 100 million in 2020 and 2050, respectively, under medium scenario projection (UN 2002; Zeng and George 2000). Such an astonishing trend raises questions about the functional ability of the oldest-old, quality of life in their late age and the sustainability of the current health system of China. However, very little was known about the disability dynamics of this subpopulation in China. Given that China differs substantially from Western developed societies in living arrangement, health practice, cultural setting, and sociopolitical system including health care policy, studies on the Chinese oldest-old population could provide a better understanding of the underlying mechanisms of prevalence and dynamics of disability.
2. Data and methodology
2.1 Data source
Data is derived from the first three waves of the Chinese Longitudinal Healthy Longevity Survey (CLHLS) in 1998, 2000, and 2002 in randomly selected half of the counties/cities in 22 provinces of China. The survey was initiated to meet the needs for scientific research on the oldest-old, a sub-population about which we know very little but that is growing at extraordinary speed and needs the most help. The survey staff interviewed 8,959 voluntary participants aged 80+ in the baseline survey in 1998. Among them, 2,418 were centenarians, 3,013 were nonagenarians, and 3,528 were octogenarians. In the second wave in 2000, out of the 8,959 baseline interviewees, 4,474 (53.0%) survived to the time of the 2000 interview, 3,355 (37.4%) died before the time of 2000 interview, and 860 (9.6%) were lost to follow-up. In the 2000 wave, the total sample reached 11,161 including 6,337 newly added respondents. Among those 11,161, the number of centenarians, nonagenarian, and octogenarians are 2,431, 3,812, and 4,918, respectively. In the 2002 wave, out of the 11,161 respondents interviewed at the 2000 interview, 5,911 (53.0%) survived at the 2002 interview, 3,401 (30.5%) died before the 2002 interview, and 1,849 were lost to follow-up (16.7%). To produce more robust results, as has been done in some previous studies (e.g., Crimmins et al. 1994), all three waves of data are pooled together in this study. As a result of the pooling, we deal with the number of observations/cases rather than the number of interviewees in this study. Each interviewee has at least two but at most three observations. Time 1 refers to the start-point of each two-year interval in which a dynamics of disability may occur, whereas Time 2 refers to the endpoint of each two-year interval. In other words, Time 1 in this study could be the interview time in 1998 or 2000, and Time 2 could be the interview time in 2000 or 2002. Furthermore, as has been done in previous studies (Zeng et al. 2002; Zeng and Vaupel 2004), persons who reported age 106 or higher at Time 1 are excluded from this study due to insufficient information for us to validate their reported extremely high age. The total number of observations included in this study is 19,778 (8,447 aged 80-89, 6,825 aged 90-99, and 4,506 aged 100-105).
was conducted with a proxy respondent. This is the first nation-wide longitudinal survey research project with such a large sample size on the oldest-old ever conducted in a developing country. A detailed description about the sampling design and data quality assessment of the CLHLS can be found elsewhere (Zeng et al. 2001; 2002; Gu and Zeng 2004).
Comprehensive information concerning the date of death, cause of death, ADL status and days of ADL disability before death, days of being bedridden before death, number of episodes of suffering from serious diseases (including length of hospital stay) from last interview to death, what kind of diseases were suffered before death, whether adequate medical treatment was received when suffering disease, how many days before death the elder did not go out of doors, how many days before death the amount of time in bed was longer than that out of bed, and sociodemographic characteristics such as marital status, family income, living arrangement before dying were also obtained from the next-of-kin of those interviewees who died prior to the next wave.
The CLHLS datasets used in this study have two unique and important features. First, the CLHLS collected the information before dying from the next-of-kin for those decedents who died before the subsequent interview. Second, this study contains a total 19,778 observations (8,447 aged 80-89, 6,825 aged 90-99, and 4,506 aged 100-105). Such a large sample size makes these datasets more reliable for studying the oldest-old population.
2.2 Measuring the onset and recovery of ADL disability
is classified as having a “recovery” from ADL disability if he/she moved from at least one ADL limitation at Time 1 to no ADL limitation at Time 2 or before dying (see Note 4 for the definition of ADL status before dying). Such dichotomous classification includes 2 x 2 = 4 sets of rates of functional transition and remaining, which enables us to clearly focus on the onset and recovery of disability although it loses some information about the ADL functional gradations of deterioration/improvement. If, for example, three ADL categories are adopted, we would have to deal with 3 x 3 = 9 sets of functional transitions and remaining, which largely complicates the models and interpretations and causes problems of small sample sizes. The strategy of such dichotomous classification has also been adopted in previous studies (e.g., Land et al. 1994; Rogers et al. 1992; Zimmer et al.1998).
2.3 Accuracy and reliability of ADL disability
The reliability of self-reported ADLs has been shown to be high and to be unaffected by age or cognitive status (e.g., Smith et al. 1990). The validity of self-reported ADL has been affirmed by several studies that have demonstrated high concordance between respondents and proxies (Magaziner et al. 1996).
The reliability coefficients of ADL (Note 5) in the CLHLS and some selected studies are presented in Table A1 in the Appendix. The value of Cronbach alpha in the CLHLS is close to or higher than that of some studies conducted in the USA (e.g., Fillenbaum 1988) and Canada (e.g., Penning and Strain 1994). These reliability coefficients are all above 0.7, the lowest criterion for group comparisons suggested by previous studies (Nunnally 1994; Stewart, Hays, and Ware 1992). Therefore, we are confident about the high data quality for ADL disability in the CLHLS.
2.4 Sociodemographic factors
Age, sex, current residence, ethnic group, SES in terms of education, economic independence, adequate financial resources, primary lifetime occupation, marital status, and living arrangement are the sociodemographic variables that we expected to be associated with the dynamics of ADL statuses in this study. All these factors were measured at Time 1.
general education level of the Chinese oldest-old is extremely low and other alternative coding did not improve the estimates. Although the cash or asset amount income of the oldest-old was unavailable, the main income source information was collected. We classify such sources into two categories: economic independence, namely, relying mainly on pension or one’s own financial source, and economic dependence, namely, relying mainly on spouse, children or other family members, government subsidy or other sources. And we also use another variable to measure whether the monetary sources are adequate to maintain the daily costs of the elderly. These two variables are a proxy of economic conditions in our study. Primary lifetime occupation of males is classified into two categories: agriculture and non-agriculture, whereas it is grouped into three categories for females: agriculture, housewife, and non-agriculture. Marital status has two categories: currently not married (including never married, divorced, and widowed) and currently married. Living arrangement is classified into living alone and not-living-alone. The distribution of above variables is listed in Table 1.
2.5 Control variables
To reduce the possibility of spurious associations, we select a set of control variables for the analysis guided by previous research in this area (e.g., Boult et al. 1994; Seeman, Bruce, and MacAvay 1996).
There is reliable evidence to substantiate that the quality and nature of family and social support/connections have a measurable influence on functional disability (Seeman et al. 1996; Steinbach 1992; Idler and Kasl 1997; Koenig 1995). In this study, religious activities, proximity with children, playing cards, and who takes care of the elder in the daily life are considered as the proxy of family and social support/connections.
It has also been well documented that sociodemographic differences in functional status are mediated by factors of health practice such as alcohol consumption, smoking, diet, exercise (Hubert et al. 2002; LaCroix et al. 1993), and other health related variables such as cognitive function (Gill et al. 1997), self-reported health (Goldman et al. 1995; Liu et al. 1995), and depression (Gregg et al. 2002). Chronic disease conditions (see Note 2) are strongly related to an individual’s ability to carry out activities of daily living (Guralnik et al. 1993; Femia et al.1997). Hearing impairment and visual impairment are also associated with disability (e.g., Gill et al. 1997). The lower and upper extremities are associated with functional dynamics, as well (Guralnik et al. 1995).
the respondents died or survived up to the next observation point was also included in the model as a dummy variable since the dynamics patterns of disability between survivors and the decedents are largely different (e.g., Melzer et al. 2001).
The presence or absence of these factors may facilitate or impede ADL decline or recovery. Neglect of the above potential confounders may lead to biases in investigating the effect of sociodemographic factors on the prevalence and dynamics of disability. Therefore, the results are more scientific and more statistically powerful if we add such variables into model as controls (Note 7).
2.6 Analytic strategies
Findings from recent studies show that mortality levels off at very high ages (e.g., Horiuchi and Wilmoth 1998; Thatcher, Kannisto, Vaupel 1998; Vaupel et al. 1998) and 20% of centenarians could avoid diseases except osteroarthritis (Evert et al. 2003). This raises our concerns that the age effect on disability dynamics may be different among octogenarians, nonagenarians, and centenarians. Another fact is that Macintyre and colleagues (1996) show that gender differences in health vary according to the life course stage. It is necessary to conduct studies of different age groups, rather than assume that the same relationships remain constant throughout the life course (Arber and Cooper 1999). Therefore, unlike most previous studies, which took age covariates in a multivariate model in analyzing disability, we run models separately for octogenarians, nonagenarians, and centenarians. It has become commonplace to analyze men and women separately in examining gender differences in the magnitude of the relationships between socio-economic characteristics and health (Arber and Cooper 1999:62), since men and women have different lifestyles, family and social roles, health and disablement outcome (Lamb 1997). Thus, we run models for males and females separately.
significant interactions are almost identical to those without such interactions. Therefore, no interaction term was included in the final models of our analysis.
To reduce the influence of the number of respondents who were lost to follow-up or of the missing value of some variables on data analysis and inference, the multiple imputation approach was applied in this study (Allison 2002). Two types of models were constructed to examine how adding controlling variables may influence the estimates of the effects of sociodemographic factors on disability dynamics. The first type, the “sociodemographic model”, contains only sociodemographic factors, while the second type, the “full model”, contains both sociodemographic factors and the other control variables mentioned above.
The random effect logit model is employed to run all models using STATA version 8 (STATA 2003) after correcting intra-subject correlation due to some subjects’ contributing two observations to the pooled data set at a specific time (Time 1 or Time 2) (e.g., Liang and Zeger 1986) (Note 8).
3. Results
3.1 Descriptive information of sociodemographic variables and ADL dynamic changes
Table 1 provides descriptive information about percentage distributions of sociodemographic variables used in this study. The prevalence rates of ADL disability are 17% and 21% for male oldest-old and female oldest-old, respectively (Note 9). The prevalence rate increases steeply with advancing age. Those who live in urban areas have a higher prevalence rate, as compared with those living in rural areas. Minority ethnic oldest-old have a lower prevalence rate of disability than do their Han counterparts. Persons with low education or who are not currently married have higher prevalence rates. Those living alone suffer less from limitations of daily functioning than do those living with others.
for any other confounding factors are also listed in Table 2. We do not discuss these bivariate cross-tabulations here since we will subsequently discuss the differentials across sociodemographic groups while controlling for other confounding factors.
Table 1: Percentage distributions of socio-demographic variables by gender
Males Females
Variables
# of obs. % a % disabled b # of obs. % a % disabled b
Total 8142 100.00 16.63 11636 100.00 20.88
Age
80-89 4255 52.26 16.33 4192 36.03 19.39
90-99 2944 36.16 30.04 3881 33.35 39.85
100-105 943 11.58 52.70 3563 30.62 62.00
Residence
Rural 3841 47.18 15.21 5841 50.2 19.58
Urban 4301 52.82 19.28 5795 49.8 23.32
Ethnic group
Han group 7644 93.88 16.91 10840 93.16 20.87
Minority group 498 6.12 12.03 796 6.84 22.01
Economic independence
No 2893 35.53 15.92 868 7.46 17.34
Yes 5249 64.47 17.87 10768 92.54 21.33
Adequate financial resources
No 1937 23.79 17.27 3225 27.72 20.33
Yes 6205 76.21 16.44 8411 72.28 21.07
Years of schooling
0 2889 35.48 15.02 9977 85.74 21.31
1+ 5253 64.52 17.44 1659 14.26 18.91
Primary lifetime occupation
Agriculture 4332 53.21 14.46 6255 53.76 19.30
Housekeeper NA NA NA 3732 32.07 24.72
Non-agriculture 3810 46.89 19.50 1649 14.17 19.81 Marital status
Currently without
spouse 5261 64.62 16.46 10908 93.74 21.62
Currently with
spouse 2881 35.38 16.83 728 6.26 16.51
Living alone
No 7323 89.94 17.72 10251 88.1 22.72
Yes 819 10.06 7.69 1385 11.9 11.09
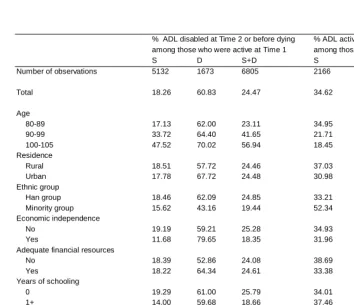
Table 2: Dynamic changes of ADL functioning by gender (Males)
% ADL disabled at Time 2 or before dying among those who were active at Time 1
% ADL active at Time 2 or before dying among those who were disabled at Time 1
S D S+D S D S+D
Number of observations 4379 1539 5915 1002 1225 2227
Total 14.21 58.07 22.17 40.82 20.04 34.39
Age
80-89 13.62 57.40 21.01 42.92 19.92 34.39
90-99 22.08 60.66 34.55 26.55 24.07 25.20
100-105 38.07 59.21 48.88 21.05 20.88 20.93 Residence
Rural 14.73 57.29 22.96 48.83 19.93 36.75
Urban 13.22 59.94 20.63 37.11 20.22 30.94
Ethnic group
Han group 14.54 59.57 22.56 42.57 19.20 33.14 Minority group 8.74 40.23 16.09 69.44 46.67 61.54 Economic independence
No 15.07 58.02 24.51 47.38 20.18 35.48
Yes 12.86 58.04 18.03 39.01 19.75 32.58
Adequate financial resources
No 15.92 54.04 23.53 51.45 23.90 36.79
Yes 13.70 59.40 21.74 42.05 18.18 33.62
Years of schooling
0 15.40 60.29 25.58 53.40 21.82 39.35
1+ 13.64 56.35 20.41 40.04 19.14 32.17
Primary lifetime occupation
Agriculture 14.36 56.88 23.31 47.98 19.85 35.73
Housekeeper NA NA NA NA NA NA
Non-agriculture 14.01 61.61 20.52 40.30 19.91 32.96 Marital status
Currently without spouse 14.10 57.14 23.44 50.29 19.67 36.11 Currently with spouse 14.32 59.56 20.71 37.97 20.63 32.36 Living alone
No 14.98 59.04 22.91 42.82 20.04 33.56
Yes 8.49 51.41 16.69 59.57 20.00 49.18
Table 2: Dynamic changes of ADL functioning by gender (Females)
% ADL disabled at Time 2 or before dying among those who were active at Time 1
% ADL active at Time 2 or before dying among those who were disabled at Time 1
S D S+D S D S+D
Number of observations 5132 1673 6805 2166 2665 4831
Total 18.26 60.83 24.47 34.62 22.51 30.66
Age
80-89 17.13 62.00 23.11 34.95 20.85 30.87
90-99 33.72 64.40 41.65 21.71 19.42 20.58
100-105 47.52 70.02 56.94 18.45 16.73 17.29 Residence
Rural 18.51 57.72 24.46 37.03 24.20 32.70
Urban 17.78 67.72 24.48 30.98 19.61 27.46
Ethnic group
Han group 18.46 62.09 24.85 33.21 22.34 29.67 Minority group 15.62 43.16 19.44 52.34 24.62 43.01 Economic independence
No 19.19 59.21 25.28 34.93 22.74 30.79
Yes 11.68 79.65 18.35 31.96 18.75 29.17
Adequate financial resources
No 18.39 52.86 24.08 38.69 25.18 33.14
Yes 18.22 64.34 24.61 33.38 21.20 29.79
Years of schooling
0 19.29 61.00 25.79 34.01 21.79 29.90
1+ 14.00 59.68 18.66 37.46 26.89 34.35
Primary lifetime occupation
Agriculture 17.13 58.47 23.08 38.45 23.54 33.70 Housekeeper 23.85 62.07 30.32 29.48 18.83 25.59 Non-agriculture 13.59 68.68 19.91 31.69 28.97 31.12 Marital status
Currently without spouse 18.59 60.37 24.93 31.97 20.35 28.20 Currently with spouse 16.55 64.29 21.91 55.67 38.24 49.66 Living alone
No 19.13 60.72 25.30 33.12 22.42 29.53
Yes 14.32 61.37 20.59 48.52 24.49 42.66
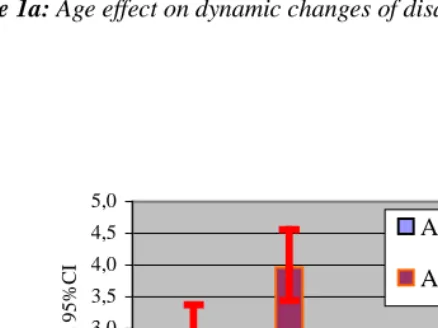
3.2 Onset of disability
Figure 1a and Figure 1b reveal that male nonagenarians and centenarians have a 1.8 times and 2.7 times higher risk to develop disability over a two-year interval, respectively, compared with male octogenarians given the same sociodemographic conditions. The effect of age on disability development is more substantial among females than among males. Moreover, such age patterns do not change very much even after controlling for all other confounders although the odds ratios are lessened. This indicates that age is a strong predictor of the onset of disability.
0,0 0,5 1,0 1,5 2,0 2,5 3,0 3,5 4,0 4,5 5,0
Males Females Males Females
Onset of disability Recovery from disability
O
dds
r
at
io
s and 95%C
I
Age 90-99/80-89
Age
100-105/80-0,0 0,5 1,0 1,5 2,0 2,5 3,0 3,5 4,0 4,5 5,0
Males Females Males Females Onset of disability Recovery from disability
O
dds
r
at
io
s and 95%C
I
Age 90-99/80-89
Age
100-105/80-Figure 1a: Age effect on dynamic changes of disability, Socio-demographic model
0,0 0,2 0,4 0,6 0,8 1,0 1,2 1,4 1,6 1,8
Onset of disability Recovery from disability
O
dds
r
at
io
s and 95%
C
I
Age 80-89 Age 90-99 Age 100-105
0,0 0,2 0,4 0,6 0,8 1,0 1,2 1,4 1,6 1,8
O nse t of di sabil ity Re cove ry from disabi li ty
O
dds
r
at
io
s and 95%
C
I
Age 80-89 Age 90-99 Age 100-105
Figure 2a: Gender effects on dynamic changes of disability, Socio-demgraphic
model
Table 3: Odds ratios of the onset of ADL disability by socio-demographic variables
Socio-demographic variables only Full model
Age 80-89 Age 90-99 Age 100-105 Age 80-89 Age 90-99 Age 100-105
Males
Single age 1.096*** 1.077*** 1.181* 1.080*** 1.061** 1.180* Urban (rural) 1.011 1.067 0.912 0.941 1.130 0.933 Minorities (Han) 0.573** 0.709# 0.799 0.408*** 0.691# 0.680
1+ year (s) schooling (no schooling) 0.799* 0.841# 0.691# 0.861 0.845 0.758
Economic independence (dependence) 0.776* 0.891 1.843# 0.965 0.980 1.672
Adequate financial resources (no) 0.924 0.952 1.206 0.990 1.109 1.484 Non-agriculture (agriculture) 1.014 1.068 0.950 1.071 1.197 1.125 Currently married (not married) 0.869 0.766* 1.006 1.055 0.857 1.026 Living alone (not living alone) 0.732* 0.676** 0.537* 0.694* 0.682* 0.421*
- Log Likelihood 1852.8*** 1275.0*** 301.2 1590.1*** 1150.9*** 277.3**
Df 9 9 9 30 30 30
Nagelkerke R2 0.022 0.016 0.025 0.160 0.111 0.103
Number of observations 3501 1968 446 3501 1968 446
Females
Single age 1.078*** 1.082*** 1.069# 1.058** 1.058** 1.028
Urban (rural) 0.950 1.209* 1.293* 1.043 1.284* 1.382* Minorities (Han) 0.881 0.694* 0.377*** 0.883 0.613** 0.389*** 1+ year (s) schooling (no schooling) 0.741** 1.102 0.780 0.838 1.170 0.886 Economic independence (dependence) 0.988 0.550* 0.668 1.005 0.580* 0.704 Adequate financial resources (no) 1.059 0.937 1.236# 1.216# 1.094 1.198
Primary lifetime occupation before age 60
Housewife (agriculture) 1.407** 1.249* 1.088 1.382** 1.310* 1.095 Non-agriculture (agriculture) 1.122 1.240 0.768 1.142 1.189 0.808 Currently married (not married) 0.925 1.667* 1.087 0.954 1.838* 1.192 Living alone (not living alone) 0.825# 0.969 0.793 0.900 0.929 0.746
- Log Likelihood 1815.8*** 1457.5*** 900.9*** 1782.3*** 1358.4*** 847.7***
Df 10 10 10 31 31 31
Nagelkerke R2 0.015 0.017 0.027 0.115 0.084 0.081
Number of observations 3294 2157 1354 3294 2157 1354
3.3 Recovering from disability
Figure 1a and Figure 1b show that the odds of recovery of nonagenarians and centenarians from disability are 35% less and 50% less than that of octogenarians, respectively, in sociodemographic model, and such effects didn’t change much after controlling for other confounders. This implies that age is strongly correlated with recovering from disability. But unlike its effects on the onset of disability, the magnitude of the age effect on recovering from disability among females is close to those among males. In general, females have a lower likelihood of regaining their daily functioning once they have become disabled as compared with their male peers. The gender difference is not significantly detected among octogenarians, while the gender differential effect is the biggest among nonagenarians.
change after controlling possible confounding, implying that the estimates of the sociodemographic effects are valid.
Table 4: Odds ratios of the recovery from ADL disability by socio-demographic
variables
Socio-demographic variables only Full model
Age 80-89 Age 90-99 Age 100-105 Age 80-89 Age 90-99 Age 100-105
Males
Single age 0.884*** 0.980 1.014 0.897** 0.978 1.054 Urban (rural) 0.726# 0.620** 0.506* 0.728 0.578** 0.522*
Minorities (Han) 2.841* 1.993* 1.445 2.867* 1.966* 1.627 1+ year (s) schooling (no schooling) 0.925 0.763# 0.849 0.933 0.751* 0.734
Economic independence (dependence) 0.881 0.834 0.881 0.785 0.843 0.794 Adequate financial resources (no) 0.931 1.107 0.879 0.693 1.012 0.849 Non-agriculture (agriculture) 1.033 0.926 0.791 1.009 0.983 0.760 Currently married (not married) 0.927 1.113 0.855 0.921 0.998 0.926 Living alone (not living alone) 2.590* 2.284** 1.935 2.828* 2.855** 2.238#
- Log Likelihood 454.3*** 532.2*** 245.3* 411.7*** 510.8*** 233.6*
Df 9 9 9 30 30 30
Nagelkerke R2 0.040 0.032 0.038 0.130 0.069 0.078
Number of observations 754 976 497 754 976 497
Females
Single age 0.942* 0.928*** 0.993 0.950# 0.942** 1.022
Urban (rural) 0.757 0.692** 0.597*** 0.724# 0.653** 0.588***
Minorities (Han) 1.223 1.673* 2.122** 1.545 1.675* 1.945*** 1+ year (s) schooling (no schooling) 1.219 0.699 0.736 1.057 0.660# 0.735
Economic independence (dependence) 0.741 0.834 0.663 0.669 0.839 0.679 Adequate financial resources (no) 0.915 0.968 0.839 0.863 0.903 0.826 Primary lifetime occupation before age 60
Housewife (agriculture) 0.796 0.696 0.687** 0.836 0.693* 0.710* Non-agriculture (agriculture) 0.979 1.108 1.332 1.091 1.168 1.265 Currently married (not married) 1.947** 0.963 --- 2.271** 0.945 ---Living alone (not living alone) 1.648# 1.234 1.360 1.278 1.122 1.524
- Log Likelihood 527.0*** 800.1*** 983.6*** 490.8*** 777.8*** 954.8***
Df 10 10 10 31 31 31
Nagelkerke R2 0.025 0.024 0.032 0.090 0.051 0.060
Number of observations 898 1724 2209 898 1724 2209
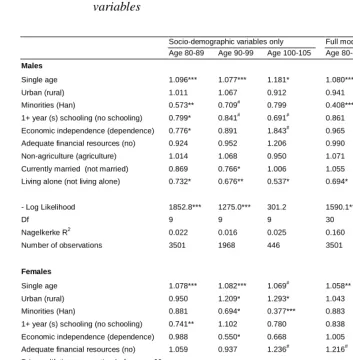
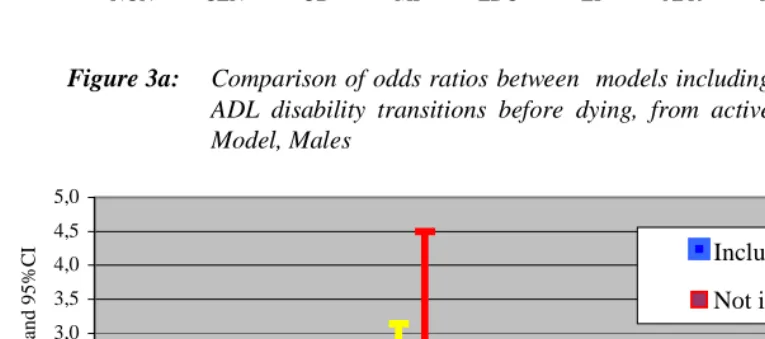
3.4 Difference between the estimates including and not including the ADL changes before dying
Results in Figure 3a to Figure 3d indicate that the magnitude of the differences of the estimates of the effects of sociodemographic factors on ADL disability dynamics between models including and not including ADL dynamics before dying is not negligible, although the patterns of effects are close (Note 10). The results suggest that the effect of age on disability onset is higher in the models not including ADL dynamic changes of the deceased persons before dying as compared with models including ADL dynamic changes before dying. The effect of age on disability recovery in the conventional approach without information of ADL changes before dying is lower than that in models including ADL transition before dying (Note 11). The conventional approach overestimated the age effect on disability dynamics. This is because the difference in ADL dynamics across ages for survivors is larger than that for the deceased persons. Our multivariate analyses based on the full model show that the odds ratios of having an onset of disability across three age groups with age 80-89 as the reference group are 1.74 (p<0.000) for age 90-99 and 2.90 (p<0.000) for age 100-105 among male survivors, and 1.06 (p>0.1) for age 90-99 and 1.03 (p>0.1) for age 100-105 among the deceased male oldest-old. Correspondingly, the odds ratios of recovering across these three age groups with age 80-89 as the reference group are 0.55 (p<0.000) and 0.36 (p<0.000) for male survivors and 1.12 (p>0.1) and 0.94 (p>0.1) for the deceased males (Note 12). Similar patterns of age differential effects between survivors and deceased persons among females are also found.
0,0 0,5 1,0 1,5 2,0 2,5 3,0 3,5 4,0 4,5 5,0
NON CEN UB MI EDU EI AFR NA MA LA
O
dd r
at
io
s and 95%
C
I
Including
Not including
0,0 0,5 1,0 1,5 2,0 2,5 3,0 3,5 4,0 4,5 5,0
NON CEN UB MI EDU EI AFR NA MA LA
O
dd r
at
io
s and 95%C
I Including
Not including
8.5
Figure 3a: Comparison of odds ratios between models including and not including
ADL disability transitions before dying, from active to disabled, Full Model, Males
Figure 3b: Comparison of odds ratios between models including and not including
0,0 0,5 1,0 1,5 2,0 2,5 3,0 3,5 4,0 4,5 5,0
NON CEN UB MI EDU EI AFR HW NA MA LA
O
dd r
at
io
s and 95%
C
I Including
Not including
0,0 0,5 1,0 1,5 2,0 2,5 3,0 3,5 4,0 4,5 5,0
NON CEN UB MI EDU EI AFR HW NA MA LA
O
dd r
at
io
s nd 95%C
I Including
Not including
Figure 3c: Comparison of odds ratios between models including and not including
ADL disability transitions before dying, from active to disabled, Full Model, Females
Figure 3d: Comparison of odds ratios between models including and not
including ADL disability transitions before dying, from disabled to active, Full Model, Females
4. Discussion
This study is innovative in its development of a measurement and model that include change of functional status before dying and incorporate basic sociodemographic factors under a more comprehensively multivariate framework. Our innovation has important potential implications both theoretically and practically. Our results based on the CLHLS data point out that the general patterns of sociodemographic effects on disability dynamics in the conventional method, which excludes the information of ADL changes before dying, is similar to those in our model including ADL changes before dying. The conventional method, however, overestimates the influences of age, gender, ethnicity, and living alone on disability transitions whereas it somewhat underestimates the effects of SES. This is mainly because of the difference in patterns of disability dynamics between survivors and the deceased persons. The level of mortality also plays a critical role. If the mortality rate is very low, it will offset the difference between these two methods even though the difference in ADL dynamics between survivors and the deceased persons is substantial. On the other hand, if mortality rate is relatively high, the difference could be large, indicating that including ADL transition before death is much more meaningful in aging studies, especially in the studies of the oldest-old, given that they have relatively high mortality rates. It is worthwhile to note that small discrepancies in effects (e.g., odds ratios) of sociodemographic factors on ADL dynamics between these two methods could lead to significant biases in the estimation of disabled life expectancy, as reported by Zeng et al. (2004). Although overestimation and underestimation of sociodemographic factors on ADL dynamics caused by the conventional method revealed in the present study might not have general applicability and far from conclusive, our finding indicates that it would be helpful to better understand the correlations between sociodemographic factors and the dynamics of disability if ADL dynamic information between survey intervals among both surviving and deceased interviewees was collected.
is that mortality rates were higher in China, which may make the Chinese oldest-old more robust compared with their counterparts in the Western nations. Actually, as pointed by one recent study (Hardy and Gill 2004), the recovery from disability might be considerably more common than what previous studies have documented. They find that among the respondents aged 70 and older the majority ever got recovered and more than half maintained independently for more than six months within 12 months from their initial disability. Thus, we believe that the slightly higher recovery rate from disability in this study compared with most of previous study may represent a spot or a part of a sector scattered on the full spectrum of dynamics of the disability among the elderly. The outcome in the present study suggests that the oldest-old are a frail group of people on average, on one hand. On the other hand, a sizeable number of the oldest-old, once disabled, would get recovery from disability. Such figures provide evidence to support the idea that recovering is almost as common as the onset of disability (Clark, Stump, and Hui 1998), and disability among older persons and even oldest-old persons is a highly dynamicprocess and is not an irreversible but often recurrent event (Gill and Kurland 2003).
Our results show that age is strongly linked to disability dynamics. Increasing age increases the chances of moving from active to disabled status, and decreases the chance that the disabled individuals will recover to active status. This reaffirms most others’ reports (e.g., Crimmins et al. 1996; Hayward et al. 1998; Laditka and Wolf 1998; Rogers et al. 1992). One of the most striking findings in the relation between age and disability dynamics is that for males after age 90 and for females after age 100, an additional year of age will not deteriorate the chance to recover. Although we didn’t focus on the leveling off of disability in the present study and it deserves further research, our result provides some evidence that the disability trajectory is decelerating at very old ages. This also provides supportive evidence to the argument that older age, per se, may not impede recovery but, rather, may act as a proxy for other unmeasured factors, which in turn decrease the capacity of disabled persons to recover (Gill et al. 1997: 760).
the assessment interval. Hebert et al. (1999) also reported that the interval between surveys could affect the gender difference in functional decline or improvement. This gender pattern needs further investigation.
The rural and urban difference is less salient in developed countries than in developing countries. Hence, few studies are available to date to examine the urban/rural residential relations with disability. The majority of these studies focus mainly on cross-sectional analysis and the results are not consistent (e.g., Barberger-Gateau et al. 1992; Mainous and Kohrs 1995; Gupta and Sankar 2003). For example, Mainous and Kohers (1995) find that rural elders have a higher disability prevalence rate, and this finding is confirmed by Gupta and Sankar (2003). On the other hand, some studies find that there is no significant association between urban/rural residence and disability (Barberger-Gateau et al. 1992). In our study, urban oldest-old exhibited a higher probability to have the onset of disability and lower probability to recover than their rural counterparts. (No significant residential difference in the onset of disability was found among male oldest-old.) The potential explanations for such urban-rural patterns in China are (1) the harder life and higher mortality at younger ages in rural areas results in rural oldest-old being more selected than urban oldest-old; (2) less availability of facilities to assist oldest-old persons in their daily life in rural areas may force them to perform daily life and thus they are enabled to maintain functioning; (3) the frequency of daily activities performed by urban oldest-old is less than that of rural oldest-old due to housing structure differences; (4) rural people reside in a more healthful physical environment than do those in urban areas (Zeng et al. 2001). The first two explanations may also help us to understand the fact that the elderly in some developing countries are more active than the elderly in developed countries (Chen and Jone 1989; Lamb 1999).
among males are weaker with the increasing age, while the patterns for females are the opposite. This is a new finding but it deserves further research. Some previous research has attributed race/ethnic differences in disability to the low SES of minorities (e.g., Boult et al. 1994). But it is not clear whether the ethnic difference between Chinese Han and minorities is due mainly to mortality selection or other unobserved heterogeneities. More elucidation on this topic could provide a better understanding of ethnic differences in disability dynamics.
Most previous studies in western societies, which dealt with the entire elderly population aged 65+ and did not have a large sub-sample size for the oldest-old as we have, have found that education has a protective effect on disability in old ages (Crimmins et al. 1996; Land et al. 1994; Rogers et al. 1992). Our study, which focuses on the oldest-old in China with a large sample size, has found that education is not strongly associated with the dynamics of disability among Chinese oldest-old. This is partially in line with findings in Taiwan (Zimmer et al. 1998; Lee and Chuang 2003) and Japan (Liu et al. 1995). All three studies have found that education could decrease the likelihood of the onset of ADL disability but has no significant protective effect on recovery. We agree with Zimmer and colleagues (1998:271-273) that the effect of education on transitions of ADL disability involves a complicated framework including cultural background given that Mainland China has a similar cultural background as Taiwan. The dissimilarity of the effect of education on the onset of ADL disability between the present study and those in Taiwan and Japan might also be because of differences in the age range of subjects and the length of the observation interval. Like most western studies, all three studies in Taiwan and Japan dealt with the entire elderly population aged 65+ and didn’t focus on the oldest old. The observation intervals of these three studies are three-year (Liu et al. 1995), four-year (Zimmer et al. 1998), and seven-year (Lee and Chuang 2003). The mechanism of the relationship between education and function at oldest-old ages in China deserves further investigation.
It is noteworthy that those female oldest-old who were housewives in their lifetime experienced a higher risk of the onset of disability and a lower likelihood of regaining functioning as compared with farmers. This may be because farmers usually start to work during childhood and often continue to work well beyond the age of 65 and such labor activities serve as physical exercise, which may make them more active than housewives. On the other hand, the proportion of housewives who do exercises is very low, which makes them have a lower functioning as compared with farmers. Another possible explanation is that the majority (2/3) of previous farmers still reside in rural areas, and the rural environment has also made them relatively abler in daily life activities, as we discussed earlier in explaining the urban/rural residential differentials.
It is commonly stated that marriage demonstrates a beneficial effect on functional capacity (e.g., House, Landis, and Umberson 1988). Marriage provides individuals with a sense of meaning and importance that promotes health (Rogers et al., 1992). Although marriage provides health benefits for both husbands and wives, marriage confers a greater health benefit upon husbands than upon wives because wives often monitor their husband’s health, but husbands usually do not provide the same service to their wives (Goldman et al. 1995; Umberson 1992; Rogers et al. 1992). This beneficial effect of marriage is not fully replicated in this study. We find that marriage doesn’t have a significantly protective effect on disability dynamic transitions, indicating that the protective effect of marriage on disability dynamics is limited, or weak in the oldest-old ages in the two-year interval (Note 13). We offer the following explanations for this finding. First, mortality selection makes those not married and frail individuals drop out before they reach oldest-old ages; In other words, the currently not married oldest-old are possibly at least as robust in ADL functioning as the married oldest old. Second, we didn’t examine the quality of marriage, remarriage, the length of marriage, and recent changes in marital status on disability dynamics in the present study. These factors probably affect the results. Third, the observation interval may not be enough for us to detect such effects at the oldest-old ages. Fourth, at oldest-old ages, factors other than marital status may have a stronger influence on disability, such as chronic disease conditions or genetic factors. Further research on the marital effect on disability is warranted.
among male oldest-old. There are two-way causalities: living alone leads to good functioning, or vice versa. Hebert et al. (1999) interpreted that living alone could act as a proxy for good health at very old ages rather than as a risk factor. Although this could partially explain our result, we argue that in the Chinese cultural context, living alone might also lead to good functioning. This is because most of those oldest-old who live alone don’t have children or have low proximity with children. They have to live alone, which forces them to do daily tasks by themselves and maintain their functioning well.
Unlike most of other studies, our study focuses on the oldest-old who need much more care than others, but about whom we know very little. The data set includes a large simple size, and is the first, largest longitudinal survey for the oldest-old in developing countries. Although there are a considerable number of studies focusing on functional ability among nonagenarians and centenarians (e.g., Andersen-Ranberg et al. 1999; Nybo et al. 2001), the sociodemographic effects on dynamic changes in disability have still not been fully examined. The large sample size among octogenarians, nonagenarians, and centenarians enables us to examine the effects of sociodemographic factors on the onset of or recovery from disability separately in this study under the control of various confounding effects. The results of this study provide new knowledge about the general patterns of disability dynamics of the oldest-old in developing countries, and make comparison with those in developed countries possible. Our finding contributes to a better understanding of some of the social and demographic factors associated with transitions between disabled and active statuses. Our analysis has illustrated which sociodemographic factors are the most important ones in reducing transitions to disability, and in increasing the rate of recovery.
One limitation of the present study is that information on ADL status before dying for deceased persons between the two waves is obtained from proxy, which may involve some bias, although previous studies reveal that the use of proxy responses from family members is appropriate in quality of dying research (George 2002). And we collected only one episode of data about ADL dynamics before dying, which may also suffer some limitations. How to get the more accurate information of ADL dynamics over a survey interval without increasing the frequency of surveying is still a challenge for epidemological study. Another limitation of the present study is that information was not available on whether participants sought or received special treatments after the onset of their disability. Therefore, we could not evaluate (or adjust for) the effect of these rehabilitative efforts on the likelihood of ADL recovery.
evaluations result in different answers (Hebert et al. 1999), but also the analytical strategies will produce different pictures, as well. One of our purposes is to draw attention to the underestimation of disability in the existing literature. Although we have included ADL dynamics information before dying, the answer is far beyond satisfied given that we lack full information concerning ADL transitions between assessments. There is still a long way to go to capture the whole picture of ADL dynamics. Given the current projections that the number of Chinese oldest-old could be reach more than 100 million by 2050 (UN 2002; Zeng and George 2000), further research on the mechanisms of ADL disability and recovery in the oldest-old population is clearly warranted.
5. Acknowledgements
We thank statisticians Dr. May M. Boggess and Dr. Brian P. Poi at STATA Corporation, both of whom provided helpful suggestions in building the statistical models used in this research. We are grateful for the invaluable and constructive comments provided by two anonymous reviewers of Demographic Research.
Notes
1. The majority of existing studies follow this approach, which we call the “conventional method” in this paper.
2. According to previous research (e.g., Pope and Tarlov 1991; Verbrugge and Jette 1994; Jette 1999) and WHO (1980), the main pathway in the disablement process is as follows: presence of disease leads to impairments, which in turn lead to functioning limitations, which then lead to disability (difficulty in doing ADL). Therefore, the onset of a disease is normally a necessary precursor of disability (except in the case of trauma).
3. If a person receives assistance in at least one item, that person was defined as having difficulty in ADLs. Although some studies have mentioned that continence may exist without physical limitations and it is therefore no longer included in ADL disability estimates (Jagger et al. 2001: 404; Guralnik et al. 1993), we still include it in our analysis.
4. It is difficult to distinguish practically between an onset of disability in the time period before death and a disability emerging in the dying process in some cases since there is a good chance that, at some point in the dying process, a person might lose the ability to perform some tasks of ADL, e.g., bathing. In our CLHLS survey, we instructed the interviewers to inquire about the deceased subjects’ general ADL status during few weeks before dying, rather than the status at the moment of death.
5. Reliability coefficient is define as follows:
r
K
r
K
)
1
(
1
)
(
−
+
=
α
, where,r
=)
1
(
1
2 1 2 sum K i iS
S
K
K
å
=−
−
, andK
is the total number of items;2 i
S
denotes thevariances for the
k
th item;S
sum2 denotes the variance for the scale (i.e., sum of all items). (See, http://www.spss.com/tech/stat/Algorithms/11.5/reliability.pdf.)6. Normally, such data is called an unequally spaced or unbalanced data set in longitudinal studies (e.g., Willett 1988).
8. We have also tried logistic regression and the population–averaged logit model, along with correcting the intra-subject correlation. The latter is based on the generalized estimation equation (GEE), an extension of the theory of the generalized linear model (GLM). The results of the random-effect logit model presented in this paper are identical to those of the logistic regression model, and the results based on the population-average logit model are almost the same as those of logistic and random-effect logit model.
9. The disability prevalence rate and incidence rates are relatively lower in China as compared with those in US. This is possibly due to mortality selection. As documented by several previous studies, the physical functioning of the elders in some Asian developing countries are much better than that of those in developed countries due to mortality selection, which forces those persons who were not robust to drop out (e.g., Lamb 1999); therefore, Chinese oldest-old might have better ADL functioning than their American counterparts.
10. Figure 3a to Figure 3d are based on the full model with males and females separated. The results in the full model with males and females combined are very close to those listed in Figure 3a to Figure 3d, and hence, they are not presented in this paper but are available upon request.
11. Comparisons are made among age-combined models to avoid problems of small sample sizes of some covariates.
12. Table 2 also provides a brief result about the different patterns of ADL dynamics across age groups between survivors and the deceased persons in terms of the proportion of making ADL transitions.
References
Allison, P. (2002). Missing data. Thousand Oaks, California: Sage Publications.
Andersen-Ranbverg, K., Christensen, K, Jeune, B. et al. (1999). Declining physical abilities with age: a cross-sectional study of older twins and centenarians in Denmark. Age and Ageing, 28, 371-377.
Arber, S., and Cooper, H. (1999). Gender differences in health in later life: the new paradox? Social Science and Medicine, 48, 61-76.
Boult, C., Kane, R.L., Louis, T.A., Boult, L., and McCaffrey, D. (1994). Chronic conditions that lead to functional limitation in the elderly. Journal of Gerontology: Medical Science, 49(1), M28-M36.
Barberger-Gateau, P., Chaslerie, A., Darigues, J-F. et al. (1992). Health measures correlates in a French elderly community population: The PAQUID study. Journal of Gerontology: Social Sciences, 47(2), 588-595.
Chen, A.J., and Jones, G. (1989). Aging in ASEAN: Its socioeconomic consequences. Singapore: Institute of Southeast Asian Studies.
Crimmins, E.M., Hayward, M.D., and Saito, Y. (1994). Changing mortality and morbidity rates and the health status and life expectancy of the older population. Demography, 31 (1),159-175.
Crimmins, E.M., Hayward, M.D., and Saito, Y. (1996). Differentials in active life expectancy in the older population of the United States. Journal of Gerontology: Social Sciences, 51B(3), S111-S120.
Crimmins, E.M, and Saito, Y. (1993). Getting better and getting worse: transitions in functional status among older Americans. Journal of Aging and Health, 5, 3-36.
Clark, D.O., Stump, T.E., and Hui, S.L. (1998). Predictors of morbidity and basic ADL difficult among adults aged 70 years and older. Journal of Aging and Health, 10(4), 422-440,
Cornoni-Huntley, J.C., Foley, D.J., White, L.R. et al. (1992). Epidemiology of disability in the oldest old. In R.M. Suzman, D.P. Willis, and K.G. Manton (eds.). The oldest old. Oxford University Press. New York. Pp251-267.
Fillenbaum, G.G. (1988). Multidimensional functional assessment of older adults: the Duke older Americans resources and services procedures. Hillsdale, NJ: Erlbaum Associates.
Femia, E. E., Zarit, S.H., and Johansson, B. (1997). Predicting change in activities of daily living: A longitudinal study of the oldest old in Sweden. Journal of Gerontology: Psychological Sciences, 52B, P294-P302.
Ferrucci, L., Guralnik, J.M., Simonsick, E., et al. (1996) Progressive versus catastrophic disability: A longitudinal view of the disablement process. Journal of Gerontology: Med Sciences, 51A(3), M123-M130.
Folstein, M.F., Folstein, S.E., and McHugh, P.R. (1975). “Mini-Mental State”: A practical method for grading the cognitive state of the patients for clinician. Journal of Psychological Research, 12,189-198.
Fuchs, Z., Blumstein, T., Novikov, I. et al. (1998). Morbidity, comorbidity, and their association with disability among community-dwelling oldest old in Israel. Journal of Gerontology: Medical Sciences, 53A, M447-M455.
George, L.K. (2002). Research design in end of life research: State of the science. The Gerontologist, 42, 86-98.
Geroldi, C., Frisoni, G.B., Rozzini, R., and Trabucchi, M. (1996). Disability and principal lifetime occupation in the elderly. International Journal of Aging and Human Development, 43,317-324.
Gill, T. M., Hardy, S.E., and Williams, C. (2002). Underestimation of disability in community-living older persons. Journal of the American Geriatrics Society, 50, 1492-1497.
Gill, T.M., and Kurland, B. (2003). The burden and patterns of disability in activities of daily living among community-living older persons. Journal of Gerontology: Biology Sciences and Medical Sciences, 58(1), M70 -M 75.
Gill, T.M., Robison, J.T., and Tinetti, M.E. (1997). Predictors of recovery in activities of daily living among disabled older persons living in the community. Journal of General Internal Medicine, 12, 757-762.
Ginn, J., and Arber, S. (1991). Gender, class and income inequities in later life. British Journal of Sociology, 42, 369-396.
Gregg, E.W., Mangione, C.M, and Cauley, G.A. (2002). Diabetes and incidence of functional disability among older women. Debates Care, 25(1), 61-67.
Grundy, E. (2001). Living arrangements and the health of older persons in developed countries. UN Population Bulletin, 42/43 (special issue), 311-329.
Gu, D., and Zeng, Y. (2004). Data assessment of the Chinese Longitudinal Healthy Longevity Survey. In Y. Zeng, Z. Xiao, and C. Zhang (Eds.). Determinants of healthy longevity of the oldest-old in China, Chapter one. Peking University Press: Beijing.
Gupta, I., Sankar, D. (2002). Health of the elderly in India: A multivariate analysis. Journal of Health and Population in Developing Countries, No. 6. http://www.jhpdc.unc.edu/ 2003_papersv /eldgupabs.pdf
Guralnik, J.M., and Ferrucci, L. (2002). Underestimation of disability occurrence in epidemiological studies of older people: Is research on disability still alive? Journal of the American Geriatrics Society, 50, 1599-1601.
Guralnik, J.M., Ferrucci, L., Simonsick, E.M., et al. (1995). Lower-extremity function in persons over the age of 70 years as a predictor of subsequent disability. New England Journal of Medicine, 12, 556-561.
Guralnik, J.M., LaCroix, A.Z., Abbott, R.D., et al. (1993). Maintaining mobility in late life. I: Demographic characteristics and chronic conditions. American Journal of Epidemiology, 137, 845-857.
Guralnik, J.M., Leveille, S.G., Hirsch, R., et al. (1997). The impact of disability in older women. Journal of American Medical Women’s Association, 52(3), 113–20.
Hanley, R.J., Alecxih, L.M., Wiener, J.M., and Kenell, D.L. (1990). Predicting elderly nursing home admissions. Research on Aging and Health, 12, 199-228.
Hardy, S., and Gill, T. M. (2004). Recovery from disability among community-dwelling older persons. Journal of American Medical Association, 291 (13), 1596-1602.
Harris, T., Kovar, M.G., Suzman, R., Kleinman, J. and Feldman, J.J. (1989). Longitudinal study of physical ability in the oldest old. American Journal of Public Health, 71(11), 1211-1216.
Hebert, .R, Brayne, C., Spiegelhalter, D. (1999). Factors associated with functional decline and improvement in a very elderly community- dwelling population. American Journal of Epidemiology, 150, 501-510.
Horiuchi, S., and Wilmoth, J.R. (1998). Deceleration in the age pattern of mortality at older ages. Demography, 35(4), 391-412.
House, J.S., Landis, K.R., and Umberson, D. (1988). Social relationships and health. Science, 241, 540-545.
Hubert, H.B., Bloch, D.A., Oehlert, J., and Fries, J.F. (2002). Lifestyle habits and compression of morbidity. Journal of Gerontology: Medical Sciences, 57A(6), M347-M351.
Idler, E. L., and Kasl, S. V.(1997). Religion among disabled and nondisabled elderly persons, II: Attendance at religious services as a predictor of the course of disability. Journal of Gerontology: Social Sciences, 52B, S306-S316.
Jagger, C., Arthur, A.J., Spiers, N.A., and Clarke, M. (2001). Patters of onset of disability in activities of daily living with age. Journal of the American Geriatrics Society, 49, 404-409.
Jette, A.M. (1999). Disentangling the Process of Disablement (Editorial). Social Science and Medicine, 48,471-472.
Johnson, N. (2000). The racial crossover in comorbidity, disability, and mortality. Demography, 37(3), 267-283.
Katz, S., Ford, A.B., Moskowitz, R.W., Jackson, B.A., and Jaffe, M.W. (1963). Studies of illness in the aged-The index of ADL: A standardized measure of biological and psychosocial function. Journal of the American Medical Association, 185 (12), 914-919.
Katz, S., Branch, L.G., Branson, M.H., Papsidero, J.A., Beck, J.C., and Greer, D.S. (1983). Active life expectance. New England Journal of Medicine, 309,1218-1223.
Koenig, H.G. (1995). Religion and health in later life”. In M.A. Kimble, S.H. McFadden, J.W. Ellor, and J.J. Seeber (eds.). Aging spirituality and religion: A handbook. Minneapolis, MN: Fortress Press.
Laditka, S. B., and Wolf, D.A. (1998). New method for analyzing active life expectancy. Journal of Aging and Health, 10(2),214-241.
Lamb, V. L. (1997). Gender differences in correlates of disablement among the elderly in Egypt. Social Science and Medicine, 45(1),127-136.
Lamb, V. L. (1999). Active life expectancy of the elderly in selected Asian countries. Nihon University, Population Research Institute Research Paper Series No.69.
Land, K.C., Guralnik, J.M., and Blazer, D.G. (1994). Estimating increment-decrement life tables with multiple covariates from panel data: The case of active life expectancy. Demography, 31(2), 297-319.
Lee, Y.J., and Chuang, Y.L. (2003). Children’s education, intergenerational support, and elderly parents’ health in Taiwan. Development and Society, 32(1), 1-26.
Liang, K.Y., and Zeger, S.L. (1986). Longitudinal data analysis using generalized linear models. Biometrila, 73, 13-22.
Liu, X., Liang, J., Muramatsu, N., and Sugisawa, H. (1995). Transitions in functional status and active life expectancy among older people in Japan. Journal of Gerontology: Social Sciences, 50B (6), S383-S394.
Macintyre, S., Hunt, K., Sweeting, H. (1996). Gender differences in health: are things really as simple as they seem? Social Science and Medicine, 42, 617-624.
Maddox, G.L., and Clark, D.O. (1992). Trajectories of functional impairment in late life. Journal of Health and Social Behavior. 3,114-125.
Magaziner, J., Bassett, S.S., Hebel, J.R., and Gruber-Baldini, A. (1996). Use of proxies to measure health and functional status in epidemiologic studies of community-dwelling women aged 65 years and older. American Journal of Epidemiology,12, 283-292.
Mainous, A.G., and Kohrs, F.P. (1995). A comparison of health status between rural and urban adults. Journal of Community Health, 20, 23-31.
Manton, K.G. (1988). A longitudinal study of functional change and mortality in the United States, Journal of Gerontology: Social Science, 43, S153-S161.
Manton, K.G., and Land, K. C. (2000). Active life expectancy estimates for the U.S. elderly population: a multidimensional continuous-mixture model of functional change applied to completed cohorts, 1982-1996. Demography, 37(3), 253-265.
Manton, K.G., Stallard, E., and Corder, L. (1995). Changes in morbidity and chronic disability in the US elderly population: Evidence from the 1982, 1984, and 1989 National Long-Term Care Surveys. Journal of Gerontology: Social Sciences, 50B, S194-S204.
Melzer, D., Izmirlian, G., Leveille, S.G, and Guralnik, J.M. (2001). Educational differences in the prevalence of mobility disability in old age: The dynamics of incidence, mortality, and recovery. Journal of Gerontology: Social Sciences, 56B(5), S294-S301.
Mendes de Leon, C.F., Beckeet, L.A., Fillenbaum, G.G. et al. (1997). Black-white differences in risk of becoming disabled and recovering from disability in old age: A longitudinal analysis of two EPESE populations. American Journal of Epidemiology, 145, 488-497.
Mendes de Leon, C.F., Glass, T.A., Beckett, L.A. et al. (1999). Social networks and disability transitions across eight intervals of yearly data in the New Haven EPESE. Journal of Gerontology: Social Sciences, 54B(3), S162-S172.
Murphy, M, Glaser, K., and Grundy, E. (1997). Marital status and long-term illness in Great Britain. Journal of Marriage and the Family, 59, 156-164.
Nunnally, J.C. (1994). Psychological theory. 3rd ed. New York: McGrawhill.
Nybo, H., Gaist, D., Jeune, B. et al. (2001). Functional status and self-reported health in 2262 nonagenarians: The Danish 1905 Cohort Study. Journal of the American Geriatrics Society, 49, 601-609.
Penning, M. J., and Strain, L. A. (1994). Gender differences in disability, assistance and subjective well-being in later life. Journal of Gerontology: Social Sciences, 49B, S202-S208.
Pope, A., and Tarlov, A. (Eds.). (1991). Disability in America: Toward a national agenda for prevention. National Academy Press: Washington, DC.
Rogers, R.G., Rogers, A., and Belanger, A. (1992). Disability-free life among the elderly in the United States: sociodemographic correlates of functional health. Journal of Aging and Health 4(1), 19-42.
Schoenbaum, M., and Waidman, T. (1997). Race, socioeconomic status and health: Accounting for race differences in health. Journal of Gerontology: Social Sciences, 52B, 61-73.
Seeman, T.E., Bruce, M.L., and McAvay, G.J. (1996). Social network characteristics and onset of ADL disability: MacArthur Studies of Successful Aging. Journal of Gerontology: Social Scences, 51B, S191-S200.
Seeman, T.E., Charpentier, P.A., Berkman, L. F. et al. (1994). Predicting changes in physical performance in a high-functioning elderly cohort: MacArthur Studies of Successful Aging. Journal of Gerontology: Medical Sciences, 49(3), M97-M108.
Smith, J.B., and Kington, R. (1997). Demographic and economic correlates of health in old age. Demography, 34, 159-170.
Soldo, B.J., Hurd, M.D., Rodgers, W., Wallance, R.B. (1997). Asset and health dynamics among the oldest old: An overview of the AHEAD study. The Journals of Gerontology Series B, 52B,Speciall Issue, 1-20.
STATA (2003). STATA version 8. STATA Corporation.
Statistical Bureau of China (1993). The 4th National Census in 1990. China Statistics Press. Beijing.
Steinbach, U. (1992). Social network, institutionalization, and mortality among elderly people in the United States. Journal of Gerontology: Social Sciences, 47, S183-S190.
Stewart, A. L., Hays, R.D., and Ware, J.E. Jr. (1992). Methods of constructing health measures. In A.L. Stewart , and L.E. Ware Jr. (eds.). Measuring functioning and well-being. Durham, NC: Duke University Press.
Suzman, R.M., Willis, D.P., and Manton, K.G. (1992). The oldest old. New York: Oxford University Press.
Thatcher, A. R., Kannisto, V., and Vaupel, J.W. (1998). The force of mortality at ages 80 to 120 . Odense University Press: Odense, Denmark.
Umberson, D. (1992). Gender, marital status and the social control of health behavior. Social Science and Medicine, 34, 907-917.
Van Groenou, M.I.B., Deeg, D.J.H., and Penninx, B.W.J.H. (2001). Income differentials in functional disability in old age: Relative risks of onset, recovery, decline, attrition and mortality. Aging Clinical and Experimental research, 15(2), 174-183.
Verbrugge, L.M. & Jette, A.M. (1994). The Disablement Process. Social Science and Medicine, 38, 1, 1-14.
Vaupel, J. W., Carey, J. R., Christensen, K. et al. (1998). Biodemographic trajectories of longevity. Science, 280, 855-860.
Weinberger, M., Samsa, G.P., Schmader, K. et al. (1992). Comparing proxy and patients’ perceptions of patients’ functional status: results from an outpatient geriatric clinic. Journal of American Geriatric Society, 40, 585-588.
Wiener, J.M., Hanley, R.J., Clark, R., and Van Nostrand, J.F. (1990). Measuring the activities of daily living: Comparisons across national surveys. Journal of Gerontology: Social Sciences, 45(6), S229-S237.
Willett, J. (1988). Questions and answers in the measurement of change. Review of Research in Education, 15, 345-422.
Wolinsky, F., Stump, T.E., Callahan, C.M., and Johnson, R.J. (1996). Consistency and change in functional status among older adults over time. Journal of Aging and Health, 8(2), 155-182.
World Health Organization. (1980). International classification of impairments, disabilities and handicaps: a manual of classification relating to the consequences of disease. Geneva: World Health Organization.
Zeng, Y., and George, L. (2000). Family dynamics of 63 million (in 1990) to more than 330 million (in 2050) elders in China. Demographic Research, Vol. 2. No. 5. //www.demograpghic-research.org/volumes//vol2/5.
Zeng, Y., Gu, D., and Land, K.C. (2004). A new method for correcting the underestimation of disabled life expectancy and an application to the Chinese oldest old. Demography, 2, 335-361.
Zeng, Y., and Vaupel, J.W. (2004). Association of late childbearing with healthy longevity among oldest old in China. Population Studies (forthcoming).