in the population sciences published by the Max Planck Institute for Demographic Research Konrad-Zuse Str. 1, D-18057 Rostock · GERMANY www.demographic-research.org
DEMOGRAPHIC RESEARCH
VOLUME 13, ARTICLE 18, PAGES 455-484
PUBLISHED 17 NOVEMBER 2005
http://www.demographic-research.org/Volumes/Vol13/18/ DOI: 10.4054/DemRes.2005.13.18
Research Article
Forecasting sex differences in mortality
in high income nations:
The contribution of smoking
Fred Pampel
This article is part of Demographic Research Special Collection 4, “Human Mortality over Age, Time, Sex, and
Place: The 1st HMD Symposium”.
1 Introduction 456 2 Estimating smoking-attributed mortality 457
2.1 Harm of smoking 457
2.2 Indirect estimates 458
2.3 Nations and measures 460
3 Trends and national differences 461
3.1 Trends 461
3.2 National differences 463
4 Forecasting logged smoking and non-smoking mortality ratios 465
4.1 Smoking mortality 465
4.2 Other mortality 467
5 Forecasting logged total mortality ratios 470 5.1 Combining smoking and non-smoking forecasts 470
5.2 National differences 473
6 Discussion 477
7 Acknowledgements 479
References 480
Forecasting sex differences in mortality in high income nations:
The contribution of smoking
Fred Pampel 1
Abstract
To address the question of whether sex differences in mortality will in the future rise, fall, or stay the same, this study uses relative smoking prevalence among males and females to forecast future changes in relative smoking-attributed mortality. Data on 21 high income nations from 1975 to 2000 and a lag between smoking prevalence and mortality allow forecasts up to 2020. Averaged across nations, the results for logged male/female ratios in smoking mortality reveal equalization of the sex differential. However, continued divergence in non-smoking mortality rates would counter convergence in smoking mortality rates and lead to future increases in the female advantage overall, particularly in nations at late stages of the cigarette epidemic (such as the United States and the United Kingdom).
This article is part of Demographic Research Special Collection 4,
“Human Mortality over Age, Time, Sex, and Place: The 1st HMD Symposium”. Please see Volume 13, Publications 13-10 through 13-20.
1. Introduction
The analysis of national differences in the relative mortality rates of men and women for smoking-attributed deaths and other deaths suggests that the small declines in the sex differential in mortality observed recently in high income nations stem from two counterbalancing trends: Smoking-attributed deaths rose among women relative to men, while other deaths rose among men relative to women (Pampel 2002). From 1975 to 1995, the separate cause-specific trends produced little change overall in the total sex differential. In addition, differences across nations in the rise of female smoking-attributed deaths and the decline of the sex differential in smoking mortality rates is associated more closely with patterns of cigarette diffusion than gender equality (Pampel 2003). Nations at advanced stages of cigarette diffusion, where women have had a longer time to catch-up with the earlier adoption of men, showed convergence in female and male smoking-attributed mortality, whereas nations at the early stages, where women have not adopted smoking in large numbers, showed divergence in female and male smoking-attributed mortality.
This argument about the source of national differences views cigarette use and smoking mortality as a type of epidemic or diffusion process that rises slowly at first, accelerates to a peak, begins to abate, and falls to levels below the peak (Ferrence 1989; Lopez, Collishaw, and Piha 1994). The pattern of change occurs among both men and women, but, because men adopt cigarettes in large numbers earlier than women, the male changes precede the female changes by a decade or two (Department of Health and Human Services (DHHS) 2001:135; Lopez 1995; Nathanson 1995; Pampel 2001). With men affected by the epidemic first, the sex differential initially grows. Later, as smoking mortality among men peaks and begins rising among women, the differential stops growing. Still later, as smoking mortality declines among men, it grows among women (just as it had earlier among men). Therefore, the differential begins to narrow. The lag in the process for women means, in short, that the more advanced the stage of the epidemic (i.e., the earlier the diffusion process begins and the farther it proceeds), the closer the smoking mortality rates of men and women.
This paper extends previous findings and further evaluates the cigarette diffusion argument in four ways.
First, it updates mortality figures to 2000. Section 1 describes the indirect estimation methods used to decompose mortality rates of males and females into smoking and non-smoking rates, the nations and years in the sample, the logged male/female mortality ratios used to measure the sex differential, and the other measures used in the models.
smoking and non-smoking mortality on a measure of cigarette diffusion to show how the stage of the smoking epidemic affects national differences in the logged ratios.
Third, it uses regression models to forecast changes in the logged ratios of smoking mortality. Section 3 presents forecasts that rely on the relationship between relative smoking mortality rates and smoking prevalence for females and males several decades earlier. The lag in the effect of smoking prevalence on mortality combined with knowledge of recent changes in relative smoking prevalence allow forecasts of relative smoking mortality rates in decades to come.
Fourth, it uses the forecasts of logged ratios in smoking mortality and presumed changes in logged mortality ratios from non-smoking causes to predict logged mortality ratios from all causes. Section 4 combines separate forecasts by cause to predict the expected change in the logged ratios for each nation and to demonstrate how the approach compares to simple projections.
Such efforts remain preliminary but perhaps offer one means to help answer a puzzling question: Will women’s advantage in mortality rise, stay unchanged, or fall over the next several decades?
2. Estimating smoking-attributed mortality
2.1 Harm of smoking
A full accounting of the harm of tobacco must include deaths from causes other than lung cancer, and an accurate estimate of the role of smoking for the sex differential in mortality should include male and female deaths from causes other than lung cancer. In one study of mortality in Denmark, Finland, Norway, Sweden, and the Netherlands, for example, Valkonen and van Poppel (1997) found that 40 percent of the total sex difference in life expectancy in 1970-1974 came from smoking. Because of the decline in smoking-attributed mortality among men relative to women, the contribution dropped in 1985-1989 to about 30 percent of the total difference. Such results confirm the importance to the sex differential in mortality of smoking-related deaths from causes other than lung cancer.
2.2 Indirect estimates
To calculate smoking-attributed mortality rates by age and sex, Peto et al. (1992, 1994) employ indirect estimation techniques. The indirect estimates differ from other approaches to calculating smoking-attributed mortality (DHHS 1989; Brønnum-Hansen and Juel 2000; Valkonen and van Poppel 1997) in a crucial way: Without direct measures of the prevalence of smoking for an extensive sample of nations, Peto et al. use excess lung cancer rates in a population to infer the cumulative exposure to cigarette smoking, and ultimately the proportion of deaths from other diseases due to smoking. Based on the method, they report deaths for 1) males and females, 2) ages 0-34, 35-69, and 70 and over, 3) smoking-attributed causes, other causes, and all causes, and 4) the years 1975, 1985, 1990, and 1995. Updated figures for 2000 come from the Tobacco Control Country Profiles (World Health Organization 2004)2.
The appendix describes the estimation procedure and debate over its validity in more detail, but several strengths of the method deserve emphasis. First, because lung cancer rates fall to low levels in the absence of smoking, the difference between the observed lung cancer rate and the lung cancer rate expected for a non-smoking population serves as an indicator of the cumulative exposure to smoking that can be obtained without reliable and consistent measures of cigarette use. Such an approach may better reflect the extent of cigarette use than survey questions about smoking habits. Self-reported cigarette use, although generally accurate at the time of a survey (DHHS 2001:151-152), may not capture key details about an individual’s lifetime exposure – age of initiation, periods of cessation, cigarettes per day, tar levels of cigarettes, and degree of inhalation. It also fails to capture the harm from passive
2 For some nations that reported data for 1997, 1998, or 1999, the 2000 figures are obtained by extrapolating to 2000 the trends from 1995 to the
smoking. Lung cancer mortality, in contrast, responds to each of these dose-based factors and does not involve the same kind of error as self-reported cigarette use.
Second, the use of excess lung cancer mortality to estimate smoking-attributed mortality allows for meaningful forecasts. The Centers for Disease Control (2004) use current smoking prevalence as a component of estimates of smoking-attributed mortality in the United States, although the harm from cigarette use typically builds for several decades before causing death. In contrast, excess lung cancer mortality reflects smoking prevalence over previous decades and better captures the lag in the harm of smoking. Given that past smoking determines (albeit imperfectly) current excess lung cancer mortality and smoking-attributed mortality3 then current smoking can be used to forecast future smoking mortality. Use of current smoking prevalence to estimate current smoking-attributed mortality does not have this advantage.
Third, the estimates of smoking-attributed mortality appear most accurate at 35-69, ages with special significance for premature smoking mortality. For ages 0-34, the estimates assume that no deaths occur from tobacco, which likely understates the harm to children and young people from early smoking onset and the smoking of parents. Such harm nonetheless remains small relative to that at older ages. For ages 70 and over, problems in isolating specific causes of death make the indirect estimates of smoking-attributed mortality less reliable than at younger ages. Moreover, because those who die of smoking causes after age 70 would likely soon die from non-smoking causes, smoking mortality at these ages contributes little to reducing life expectancy. Yet, the estimates at ages 35-69 prove more useful: They are more reliable, better reflect premature mortality from smoking, and contribute more to lowering life expectancy than estimates at younger and older ages.4
Fourth, any estimation procedure faces daunting problems in correctly determining the number or rate of smoking-attributed deaths and the Peto et al. method has been criticized on several grounds. The method also faces difficulties common to all mortality research, such as dealing with the existence of differences across nations and over time in coding causes of death. However, the absolute level or rate of smoking deaths has little importance for study of the sex differential, which is based on smoking and non-smoking deaths of women relative to men. If the percentage error in the indirect estimates is similar for men and women, it will cancel out in measures of the differential. Even should the error differ for men and women and bias comparisons across nations and time, the extent of the problem will be considerably smaller than that for estimates of the absolute levels of smoking-attributed deaths.
3 Because cessation of smoking can bring rapid benefits for heart disease, declining rates of cigarette use can have short-term benefits for
mortality. Still, long-term harm of smoking at younger ages for mortality at older age make lags for cigarette use appropriate.
4 Although reported in three age groups, the estimates are based on data for five-year age groups and thus standardize for age structure differences
2.3 Nations and measures
I select for analysis the 21 high income, capitalist nations with populations over one million. These nations include the United States, Canada, Japan, Australia, New Zealand, and those of Western Europe (Finland, Sweden, Norway, Denmark, the United Kingdom, Ireland, Germany, the Netherlands, Belgium, France, Austria, Switzerland, Spain, Portugal, Italy, and Greece). The high income nations comprise an appropriate sample because, unlike developing nations, they have recently experienced both the widening and the narrowing of the sex differential, once exhibited high tobacco use, and, with lower mortality overall, have experienced substantial harm of tobacco for premature mortality.
Logged ratios of male to female mortality serve as measures of the sex differentials in mortality. With male rates in the numerator and female rates in the denominator, high scores indicate excess male mortality and a female advantage. A common measure of the sex differential divides one rate by the other without the log transformation. However, changing the denominator changes the implicit standard of comparison, can alter the scale of the ratio values, and makes results dependent on an arbitrary choice. This becomes a special problem when the denominator approaches zero (such as the smoking-attributed mortality rate for women where female cigarette use has only recently begun) and the ratio becomes exceedingly large. Taking the log of the ratio, in contrast, eliminates the influence of choosing one denominator over the other; the log of the ratio of female rates to male rates gives the inverse of the log of the ratio of male rates to female rates. It also moderates extreme values due to near zero denominators and can be interpreted as the difference in the logged rates of female and male mortality.5
In what follows, then, the logged total mortality ratio, logged smoking mortality ratio, and logged non-smoking mortality ratio refer to relative male and female rates of, respectively, mortality overall, smoking-attributed mortality, and other mortality.
Three other measures are used in the analyses. First, a measure of the stage of cigarette diffusion relies on historical figures on cigarette consumption from Forey et al. (2002). Focusing on a nation’s movement through the process of cigarette diffusion, the measure identifies the timing of the start of the epidemic. The earlier the cigarette diffusion process begins, the later or more advanced the current stage; conversely, the later the process begins, the earlier or less advanced the current stage. Specifically, a measure of the decades since cigarette consumption reached 50 percent of its eventual
5 For example, a few nations in the early years have no female smoking-attributed deaths and a small constant (.01) is added to avoid dividing by
peak distinguishes nations that long ago began the epidemic and have reached a more advanced stage of the diffusion process from nations that began more recently and have advanced less far in the cigarette diffusion process.6
Second, measures of the percentages of adult men and women who smoke are available every five years from 1950 to 1995 for most nations (Forey et al. 2002).7 As determinants of smoking mortality, the percentage prevalence measures among men and women have limitations. They do not distinguish the intensity or history of cigarette use in a population, can be biased by use of different types of survey questions and samples, and sometimes show unexpected and large fluctuations. Despite these limitations, however, the validity and reliability of the logged ratio of male prevalence to female prevalence is demonstrated in the analyses by the strong relationship it has with the logged ratio of smoking mortality.
Third, overall cigarette consumption (without regard to sex differences) helps determine the importance of smoking mortality to total mortality. Based on figures from Forey et al. (2002), I measure the packages of 20 cigarettes smoked per person per year from 1950 to 1995 for each nation.
3. Trends and national differences
3.1 Trends
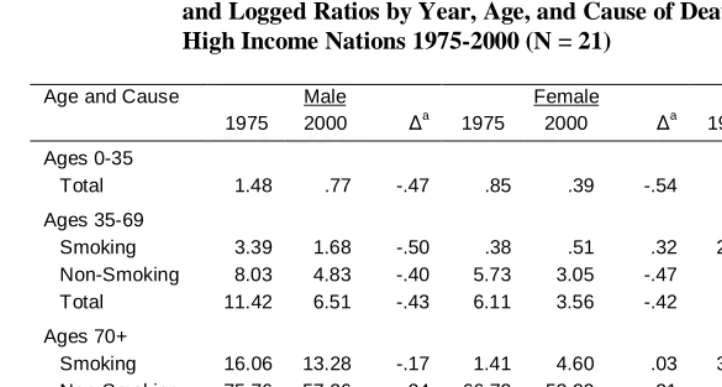
The first step in the analysis examines the trends in male mortality rates, female mortality rates, and the logged ratio of male to female mortality rates by age and cause of death. The age groups include 0-34, 35-69, 70+, and all ages. The figures for all ages come from a weighted average of the values for the three age groups, with the weights equal to the mean population size averaged across all nations and years.8 The causes of death include smoking-attributed, non-smoking attributed, and all causes or total. Table 1 lists the means averaged across all 21 nations for 1975 and 2000, and the proportional increase from 1975 to 2000.
The mean male and female mortality rates decline for all ages and all causes with a few exceptions. The exceptions involve rising smoking mortality rates among women ages 35 and over. In contributing to total mortality, these increases in female smoking mortality moderate the decline in mortality from other causes. In combination with the
6 Even nations at earlier stages of cigarette diffusion such as Spain and Portugal experienced a peak in cigarette use by the 1990s – although one at
lower levels than nations at later stages.
7 To obtain a complete time series for some nations that did not begin reporting the figures until after 1950, I estimated values for earlier years on
the basis of trends in later years.
decline in male smoking mortality, the rise in female smoking mortality will equalize the sex differential.
Table 1: Mean Mortality Rates per 1,000 for Males and Females, and Logged Ratios by Year, Age, and Cause of Death, High Income Nations 1975-2000 (N = 21)
Age and Cause Male Female Logged Ratio
1975 2000 ∆a 1975 2000 ∆a 1975 2000 ∆a
Ages 0-35
Total 1.48 .77 -.47 .85 .39 -.54 .56 .69 .24
Ages 35-69
Smoking 3.39 1.68 -.50 .38 .51 .32 2.93 1.48 -.50
Non-Smoking 8.03 4.83 -.40 5.73 3.05 -.47 .33 .46 .37
Total 11.42 6.51 -.43 6.11 3.56 -.42 .62 .60 -.03
Ages 70+
Smoking 16.06 13.28 -.17 1.41 4.60 .03 3.66 1.62 -.56
Non-Smoking 75.76 57.26 -.24 66.72 52.39 -.21 .13 .09 -.29
Total 91.82 70.54 -.23 68.13 51.96 -.16 .30 .22 -.27
All Ages
Smoking 2.84 1.89 -.33 .29 .63 .01 1.52 .75 -.51
Non-Smoking 10.90 7.56 -.31 8.83 6.20 -.30 .43 .54 .27
Total 13.74 9.45 -.31 9.11 6.83 -.25 .56 .61 .09
a
Proportional change from 1975 to 2000
Focusing on trends in the logged ratios, the key elements of the pattern of change appear in the means at ages 35-69: Male excess mortality or the female advantage rises significantly for the logged ratio of non-smoking mortality rates, falls significantly for the logged ratio of the smoking mortality rates, and, given the opposite trends for the components, changes little for the logged ratio of total mortality.9 The logged ratio for smoking deaths falls by 50 percent and for non-smoking deaths rises by 37 percent. The two trends nearly counterbalance one another, but with non-smoking deaths comprising a higher proportion of the total, the logged ratio for all mortality falls slightly – by 3 percent.
9 Note that the mean logged ratios reported in the last columns of the table do not equal calculations based on the means reported in the previous
The source of this change stems from the increase in smoking mortality rates among females and a decrease among males. To illustrate, 29.2 percent of men and 5.8 percent of women died from smoking-related causes in 1975, while the percentage fell to 25.6 percent for men and rose to 13.6 percent for women in 2000. Hence, the logged smoking mortality ratio falls steeply over the 25-year span. For non-smoking mortality, rates fall faster for women than men and produce an increase in the logged non-smoking mortality ratio.
Much as it does for the middle age group, the logged non-smoking mortality ratio or female advantage for the ages 0-35 rises by 24 percent (smoking deaths equal zero in all years). However, the pattern differs at the oldest ages, where both the logged non-smoking mortality ratio and the logged non-smoking mortality ratio decline. For all ages combined, the trends largely reflect those at the younger ages. The logged smoking mortality ratio falls (i.e., women’s relative mortality worsens), the logged non-smoking mortality ratio rises (i.e., women’s relative mortality improves), and the logged total mortality ratio changes little.
3.2 National differences
These patterns of change differ strikingly across nations. If rates of smoking and total mortality of women relative to men depend on the stage of cigarette diffusion, the simple measure of the decades since the halfway point to the peak may identify crucial heterogeneity across nations. The regression results to follow thus demonstrate two points. First, nations at more advanced stages, where smoking of women has had time to catch up with smoking of men, experience greater equality in male and female smoking mortality rates. Second, and perhaps less obviously, nations at more advanced stages of diffusion experience a weaker upward trend in the female advantage overall because of the greater equality in male and female smoking mortality rates.
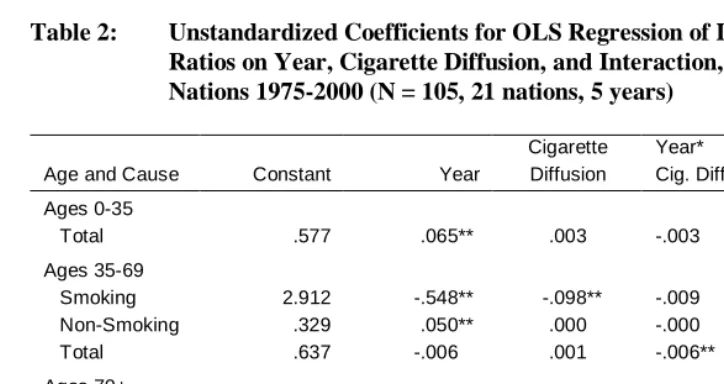
Table 2 lists coefficients for regressions of the logged ratios on year, the cigarette diffusion measure, and the product of year times cigarette diffusion10 The regression uses the cigarette diffusion measure after centering it to have a mean of zero, and year equals zero for 1975. The constant therefore equals the predicted logged ratio in 1975 at the mean of cigarette diffusion, the effect of year equals the yearly change in the predicted logged ratio at the mean of cigarette diffusion, the effect of cigarette diffusion equals the change in the predicted logged ratio for a decade change in diffusion (in 1975 when year equals zero), and the product term shows how the yearly change differs
10 As alternatives to ordinary least squares, other regression estimates that adjust for the nested structure of the pooled cross-section and
by level of cigarette diffusion. Consistent with arguments about cigarette diffusion, a negative product term would indicate that a later stage of diffusion moderates the upward trend in the logged ratios.
For the logged non-smoking mortality ratio, cigarette diffusion and its interaction have (as would be expected) no effects for any of the three age groups. Consistent with the changes in means presented in Table 1, the year term in the regression is positive for the two younger age groups but insignificant at the older ages. For the logged smoking mortality ratio, the negative year coefficients reflect the downward trend, and those nations at later stages of diffusion have lower logged smoking mortality ratios on average than those nations at earlier stages. The cigarette diffusion measure thus equalizes male and female death rates.
Table 2: Unstandardized Coefficients for OLS Regression of Logged Mortality Ratios on Year, Cigarette Diffusion, and Interaction, High Income Nations 1975-2000 (N = 105, 21 nations, 5 years)
Age and Cause Constant Year
Cigarette Diffusion
Year*
Cig. Diff. R2
Ages 0-35
Total .577 .065** .003 -.003 .200
Ages 35-69
Smoking 2.912 -.548** -.098** -.009 .426
Non-Smoking .329 .050** .000 -.000 .145
Total .637 -.006 .001 -.006** .238
Ages 70+
Smoking 3.523 -.782** -.089* -.023 .334
Non-Smoking .136 -.010 .002 -.000 .056
Total .320 -.028** .005** -.003** .226
All Ages
Smoking 1.507 -.294** -.048** -.006 .416
Non-Smoking .436 .052** .002 -.002 .250
Total .578 .028** .002 -.004** .195
More interestingly, the interaction terms indicate that the time trend becomes more negative for nations at more advanced stages of diffusion. This effect shows in the significant negative coefficients for year by cigarette diffusion on the logged total mortality ratio for both the older age groups and for all ages combined. This implies that the differential narrows for nations at advanced stages and widens for nations at early stages. For example, among nations at the early stages such as Spain or Greece, the effect of year for ages 35-69 equals .053 and reflects a worsening trend in smoking mortality among men relative to women. In contrast, among nations at the late stages such as the United Kingdom or the United States, the effect of year equals -.127 and reflects a worsening trend in smoking mortality among women relative to men. The trend in the logged mortality rates for all causes, in short, reverses with diffusion.
4. Forecasting logged smoking and non-smoking mortality ratios
4.1 Smoking mortality
Something besides national differences in the timing of cigarette diffusion and a year term – merely proxies for unmeasured causes – is needed to account for variation in the logged smoking mortality ratios. A measure of male smoking prevalence relative to female prevalence 25 years earlier should serve this purpose. Since the harm of tobacco builds over decades of use, smoking prevalence many years earlier should more strongly affect smoking mortality than current prevalence and will allow for forecasts of smoking mortality into the future. The logged ratio of male smoking prevalence to female smoking prevalence lagged 25 years thus has a correlation with the logged smoking mortality ratio at ages 35-69 of .740, which is larger than the contemporaneous correlation of .561 or any of the correlations for shorter lags. Because the measure does not capture differences in intensity, initiation age, and recent cessation of smoking or differences in susceptibility to various smoking-related causes of death, the coefficient effect falls well below one. Still, the strong relationship for the 25-year lag suggests the usefulness of using smoking prevalence to project future patterns of relative smoking mortality.
ratio11. For ages 35-69, the standardized coefficients equal .740 and .823 in the two equations. For ages 70+, the standardized coefficients equal .564 and .765. When including nation dummy variables, the variance explained reaches .875 for the middle ages and .786 for the older ages. The equations for all ages combined average these effects and likewise show the strong influence of smoking prevalence on the logged smoking mortality ratio.
Table 3: Coefficients for OLS Regression Models of the Logged Smoking and Non-Smoking Mortality Ratios, by Age, High Income Nations 1975-2000 (N = 105, 21 nations, 5 years)
Ages 0-34 Ages 35-69 Ages 70+ All Ages
Coeff- Fixed Effects Fixed Effects Fixed Effects Fixed Effects
icients No Yes No Yes No Yes No Yes
Smoking Prevalence Lagged on the Logged Smoking Mortality Ratio
b -- -- 1.693** 1.882** 1.752** 2.380** .849** .984**
se -- -- .152 .244 .253 .434 .083 .133
beta -- -- .740 .823 .564 .765 .711 .823
R2 -- -- .548 .875 .318 .786 .505 .864
∆a
-- -- -.336 -.373 -.307 -.416 -.330 -.382
Year on the Logged Non-Smoking Mortality Ratio
b .065** .065** .050** .050** -.010 -.010* .052** .052**
se .014 .012 .012 .005 .008 .005 .009 .006
beta .420 .420 .379 .379 -.113 -.113 .488 .488
R2 .176 .500 .144 .866 .013 .762 .238 .756
Alternate Predicted Proportional Change in Logged Non-Smoking Mortality Ratio
∆b
.176 .176 .221 .221 -.171 -.171 .185 .185
∆c
.088 .088 .111 .111 -.086 -.086 .092 .092
∆d
.000 .000 .000 .000 .000 .000 .000 .000
∆e
-.088 -.088 -.111 -.111 .086 .086 -.092 -.092
* p < .05 ** p < .01
∆ Predicted proportional change from 2000 to 2020
a
Based on smoking prevalence; b based on assumed linear rate of increase (or decrease at ages 70+); c based on assumed falling rate of increase (or decrease at ages 70+); d based on assumed no change; e based on assumed falling rate of decrease (or
increase at ages 70+)
11 The models assume that the effect of smoking prevalence on smoking mortality is the same for all nations. Efforts to allow the effects of
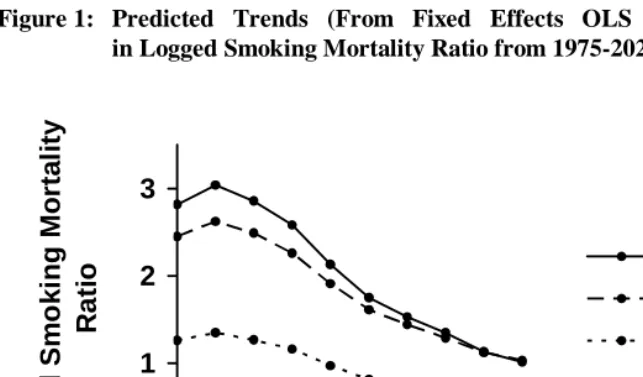
Calculating the predicted proportional change in the logged smoking mortality ratio from 2000 to 2020 demonstrates equalization of male and female smoking mortality rates. With the logged prevalence ratio lagged 25 years and available up to 1995, the model can forecast expected changes in the logged ratio to 2020. As listed below the equations in Table 3, the models predict declines in the logged smoking mortality ratio ranging from 30.7 to 41.6 percent. Figure 1 graphs the logged smoking mortality ratios for ages 35 and over as predicted by the fixed effects models and averaged across all nations. Following the trend in lagged smoking prevalence, each curve declines over the period from 2000 to 2020. Compared to past trends, however, the future trends reveal a slowing rate of decline.
Figure 1: Predicted Trends (From Fixed Effects OLS Regression Models) in Logged Smoking Mortality Ratio from 1975-2020, by Age
0
1
2
3
1975
1990
2005
2020
Year
Lo
gg
e
d
S
m
o
k
in
g
M
o
rt
a
lit
y
Ra
ti
o
Ages 70+
Ages 35-69
All Ages
4.2 Other mortality
determine and forecast the logged non-smoking mortality ratio for each age group. At ages below 70, year increases the dependent variable, while year has only a small negative effect at ages over 70. Based on the linear year terms and assuming that past trends continue into the future, the predicted logged non-smoking mortality ratio rises by 17.6 percent at ages 0-34, by 22.1 percent at ages 35-69, and by 18.5 percent over all ages, while the predicted ratio declines by 17.1 percent at ages 70 and over.
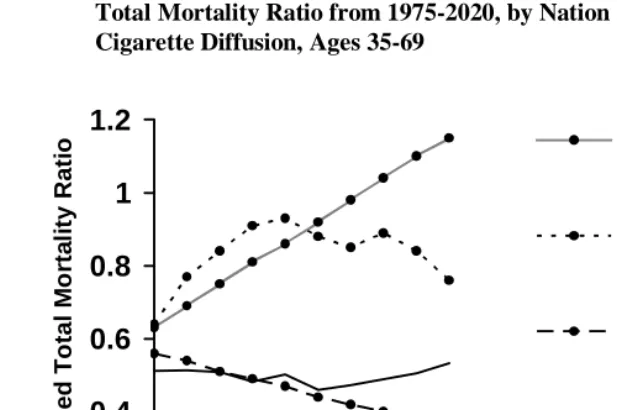
The future trends may, however, differ from those of the recent past. Indeed, the most recent year of observed data, 2000, reflects a slowing of the upward trend for ages 0-34 and a decrease in the flat trend for ages 70 and over.12 Figure 2, which graphs the observed trends for the four age groups, illustrates these changes from 1995 to 2000. It is too early to know if the most recent changes reflect a long-term pattern, short-term fluctuation, or methodological oddity.13 However, no slowdown appears in the linear upward trend for ages 35-69.
To model possible changes in past trends, I specify three alternate trajectories in the logged non-smoking mortality ratio for the years after 2000. Compared to the largely linear increase from 1975-2000 at ages below 70, the trends from 2000 to 2020 may 1) continue to increase, but at a slower rate than in the past, 2) stop growing altogether and remain constant, or 3) start to decrease at a slower rate than the previous increase. Examining the alternative trajectories can help determine how variation from the linear forecast influences total mortality. For ages 70 and over, the weak downward trend from 1975 to 2000 may from 2000 to 2020 1) continue to decrease but at a slower rate than in the past, 2) stop decreasing altogether and remain constant, or 3) start to increase at a slower rate than the previous decrease. Transforming the year term to reflect the three alternative trajectories and using each in a regression model produces predicted values for the logged non-smoking mortality ratio for the next 20 years. 14
The changes in the logged non-smoking mortality ratio implied by the alternatives vary widely. The last panel in Table 3 lists the proportional change from 2000 to 2020. Whereas the continuation of the linear trends implies changes in the female advantage of 22.1 percent at ages 35-64, the alternatives imply percentage change ranging from 11.1 to -11.1. Whereas the continuation of the linear trends implies changes in the female advantage of -17.1 percent at ages 70 and over, the alternatives imply
12 Regression tests indicate that the flattening of the trend in 2000 at younger and older ages is not large enough to produce a significant deviation
from linearity. However, even a small and statistically insignificant change can prove important in years to come and could define a future trajectory that differs from the past.
13 Two possible methodological sources might account for the change. One, the 2000 figures come from a different source than the figures from
1975-1995. Although the 2000 figures use the same estimation method as earlier, some inconsistencies might have emerged. Two, the 1995 figures are actually based on projections and may exaggerate the extent of change occurring between 1995 and 2000.
14 With the linear year term based on the actual years of 2005, 2010, 2015, and 2020, the year term reflecting a non-linear decreasing rate of
percentage change ranging from -8.6 to 8.6. Figure 3 illustrates how the alternatives vary from the linear trend for ages 35-69.
Figure 2: Observed Trends in Logged Non-Smoking Mortality Ratio from 1975-2000, by Age
0 0.25 0.5 0.75
1975 1980 1985 1990 1995 2000
Year Log ge d N on-S m ok ing Mor ta li ty R a ti o Ages 70+ Ages 35-69 Ages 0-34 All Ages
Figure 3: Alternate Predicted Trends in Logged Non-Smoking Mortality Ratio from 1975-2020, Ages 35-69
0.3 0.4 0.5 0.6
1975 1990 2005 2020
5. Forecasting logged total mortality ratios
5.1 Combining smoking and non-smoking forecasts
The predicted logged smoking and logged non-smoking mortality ratios provide a means to forecast the logged ratios for all causes. However, the forecast involves more than summation of the two components. Although the smoking and non-smoking mortality rates sum to the total mortality rates, the component logged ratios do not sum in any simple way to produce the total logged ratio. Instead, the observed logged total mortality ratio from 1975-2000 can be regressed on the predicted logged smoking and non-smoking ratios. Then, the predicted values of the independent variables from 2005-2020 plus the coefficients for the 1975-2000 model can generate predicted logged total mortality ratios for 2005-2020.15
However, the relative influence of the logged smoking and non-smoking ratios likely changes over time with patterns of cigarette use. A regression that averages past values of the dependent and independent variables may have little validity in the future. Therefore, the model adds one other variable – cigarette consumption per person lagged 25 years. This measure does not distinguish male from female smoking. Rather, it reflects the relative importance of smoking overall to mortality and thereby the size of the logged smoking coefficient relative to the logged non-smoking coefficient. When allowed to interact with the logged smoking mortality ratio, cigarette consumption (25 years earlier) modifies the contribution of the logged smoking mortality ratio to the logged total mortality ratio.16 For example, when lagged consumption is low, the effect of the logged smoking mortality ratio should be small, and when lagged consumption is high, the effect of the logged smoking mortality ratio should increase. In short, if cigarette consumption facilitates the effect of the logged smoking mortality ratio, a product term should have a positive coefficient.
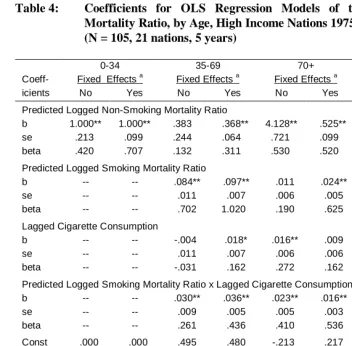
Table 4 presents the models of the logged total mortality ratio. Based on earlier results, one model uses predicted values for the logged smoking and non-smoking ratios obtained without dummy nation variables and another model uses predicted values for
15 An alternative approach to forecasting takes advantage of the fact that the weighted sum of the unlogged smoking and non-smoking ratios
equals the unlogged total mortality ratio when the weights equal the proportion of female smoking deaths and the proportion of female non-smoking deaths. The approach 1) takes the anti-log of the logged non-smoking and non-non-smoking mortality ratios predicted for the years 2005-2020, 2) forecasts the proportion female smoking deaths using cigarette consumption lagged, 3) computes the predicted unlogged total mortality ratio from the summation formula, and 4) calculates the log of the outcome to obtain predicted logged total mortality ratios. This procedure has the advantage of using an exact formula to obtain the predicted logged mortality ratios rather than an estimated regression equation. However, comparison of the two approaches shows that the regression approach does better to reproduce observed logged mortality ratios from the predicted smoking and non-smoking mortality ratios for the years up to and through 2000. Because the exact formula directly reflects fluctuation and error in the predicted smoking and non-smoking mortality ratios, it deviates substantially in some cases from the observed values. The regression approach smoothes these fluctuations and on average gives predicted values closer to the observed values. In substantive terms, the results using the alternative approach are similar to those reported here but also likely not as accurate.
16 With the component variables centered, the coefficient for the logged smoking mortality ratio alone equals its effect at the mean of cigarette
the logged smoking and non-smoking ratios obtained with dummy nation variables. Note that the predicted logged non-smoking mortality ratio is based on the continuation of the linear trend. For ages 0-34, the models include only the predicted logged non-smoking mortality ratio – a variable identical to the logged total mortality ratio because smoking deaths are zero. For ages 35-69, the predicted logged non-smoking mortality ratio raises the logged total mortality ratio, while for ages 70 and over it lowers the logged total mortality ratio.
The results confirm the expectation that the predicted logged ratio for smoking mortality has the strongest effect when lagged cigarette consumption reaches high levels. The predicted logged ratio on average raises the logged total mortality ratio, but in addition, the product terms have significant positive coefficients. Based on the fixed effects model for ages 35-69, the average effect of the predicted logged smoking mortality ratio of .097 increases by about a third (.036) for each additional package of 20 cigarettes smoked per person per year in a nation or time period.
The implications of the model show most clearly in the predicted trajectory of the logged total mortality ratio (listed in the bottom panel of Table 4). Based on the assumed continuation of the linear trend in the logged non-smoking mortality ratio, the logged total mortality ratio rises by 17.6 percent at ages 0-34. At ages 35-69, the change varies depending on the use of fixed effects and ranges from a 4.7 increase to a 0.6 decrease. The modest changes reflect near balance between the upward trend in the logged non-smoking mortality ratio and the downward trend in the logged smoking mortality ratio. At the older ages, the decline in both the predicted logged smoking and non-smoking ratios from 2000 to 2020 contribute to declines of 32.9 or 8.3 percent in the logged total mortality ratio.
Averaged across all ages and nations in the sample, the assumption of a linear continuation in the logged non-smoking ratios combined with the changes in the logged smoking ratios leads to a key forecast: The logged ratios for mortality averaged across all 21 nations over the period from 2000 to 2020 will grow. The specific percentages implied by the models equal 13.7 and 8.1 percent. The rising ratio at the youngest ages overcomes the declining ratio due to smoking at older ages to produce the continued upward trend overall.
Table 4: Coefficients for OLS Regression Models of the Logged Total Mortality Ratio, by Age, High Income Nations 1975-2000
(N = 105, 21 nations, 5 years)
0-34 35-69 70+ All Ages
Coeff- Fixed Effects a Fixed Effects a Fixed Effects a Fixed Effects a
icients No Yes No Yes No Yes No Yes
Predicted Logged Non-Smoking Mortality Ratio
b 1.000** 1.000** .383 .368** 4.128** .525** .802** .697**
se .213 .099 .244 .064 .721 .099 .203 .074
beta .420 .707 .132 .311 .530 .520 .374 .580
Predicted Logged Smoking Mortality Ratio
b -- -- .084** .097** .011 .024** .087** .100**
se -- -- .011 .007 .006 .005 .019 .012
beta -- -- .702 1.020 .190 .625 .474 .711
Lagged Cigarette Consumption
b -- -- -.004 .018* .016** .009 .040 .059**
se -- -- .011 .007 .006 .006 .021 .011
beta -- -- -.031 .162 .272 .162 .465 .692
Predicted Logged Smoking Mortality Ratio x Lagged Cigarette Consumption
b -- -- .030** .036** .023** .016** .043** .050**
se -- -- .009 .005 .005 .003 .016 .009
beta -- -- .261 .436 .410 .536 .580 .593
Const .000 .000 .495 .480 -.213 .217 .314 .356
R2 .176 .500 .444 .720 .324 .285 .291 .630
Predicted Proportional Change from 2000 to 2020
∆b
.176 .176 .047 -.006 -.329 -.083 .137 .081
∆c
.088 .088 .015 -.036 -.169 -.065 .071 .024
∆d
.000 .000 -.017 -.066 -.009 -.046 .006 -.032
∆e
-.088 -.088 -.048 -.096 .152 -.028 -.060 -.089
* p < .05 ** p < .01
a Based on predicted values from OLS regression of logged smoking and non-smoking ratios from models without and with fixed
effects in Table 4
b
Based on assumed linear rate of increase (or decrease at ages 70+) in the logged ratio of nonsmoking mortality; c based on assumed falling rate of increase (or decrease at ages 70+); d based on assumed no change; e based on assumed falling rate of decrease (or increase at ages 70+)
absent the influence of smoking, continuation of the linear trend in the logged non-smoking mortality ratio for all ages implies an increase of 18.5 percent (see Table 3). However, adjusting for the trend in the logged smoking mortality ratio lowers the implied increase in the logged total mortality ratio to 13.7 and 8.1 (Table 4).
5.2 National differences
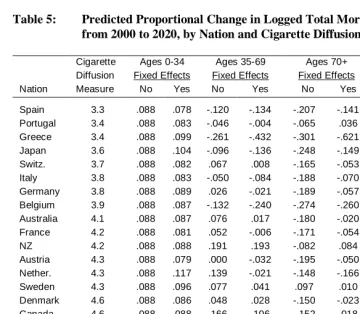
The results based on averages across 21 nations hide variation in the forecasts. Indeed, if the stage of cigarette diffusion proves critical for past trends, then nations at different stages should exhibit different future trajectories. To examine such heterogeneity, Table 5 lists the predicted proportional change in the logged total mortality ratio for each nation in the sample. The predictions assume the logged non-smoking mortality ratio at ages under 70 will continue to increase but at a slower rate than in the past, and at ages over 70 will continue to decrease but at a slower rate than in the past. The table orders the countries by the measure of cigarette diffusion stage (i.e., the decades since reaching the halfway point to the peak of cigarette consumption). The predicted proportional changes by age come from both the basic and fixed effects models.
For ages 0-34, smoking deaths equal zero, and the predicted trends merely reflect the continuation of positive growth, albeit at a slower rate, of the logged non-smoking mortality ratio in past decades. The assumption of leveling off in past trends implies an average increase of 8.8 percent across all nations. With adjustment for nation-specific differences, the assumed trend implies increases that range from 7.4 percent for Finland to 11.7 percent for the Netherlands. By themselves, the patterns offer little in the way of insight and have little relationship to the stage of diffusion but may contribute importantly to the predicted proportional change across all ages.
mortality and a growing female advantage. As a summary of these patterns, the correlations of the predicted proportional change with the diffusion measure equal .682 and .590 and indicate greater growth or smaller declines in the female advantage for nations at more advanced stages of diffusion.17
Table 5: Predicted Proportional Change in Logged Total Mortality Ratio from 2000 to 2020, by Nation and Cigarette Diffusion Measure a
Cigarette Ages 0-34 Ages 35-69 Ages 70+ All Ages
Diffusion Fixed Effects Fixed Effects Fixed Effects Fixed Effects
Nation Measure No Yes No Yes No Yes No Yes
Spain 3.3 .088 .078 -.120 -.134 -.207 -.141 -.018 -.045
Portugal 3.4 .088 .083 -.046 -.004 -.065 .036 .026 .053
Greece 3.4 .088 .099 -.261 -.432 -.301 -.621 -.116 -.230
Japan 3.6 .088 .104 -.096 -.136 -.248 -.149 -.022 -.051
Switz. 3.7 .088 .082 .067 .008 -.165 -.053 .093 .038
Italy 3.8 .088 .083 -.050 -.084 -.188 -.070 .025 .005
Germany 3.8 .088 .089 .026 -.021 -.189 -.057 .069 .028
Belgium 3.9 .088 .087 -.132 -.240 -.274 -.260 -.014 -.094
Australia 4.1 .088 .087 .076 .017 -.180 -.020 .112 .057
France 4.2 .088 .081 .052 -.006 -.171 -.054 .079 .026
NZ 4.2 .088 .088 .191 .193 -.082 .084 .187 .152
Austria 4.3 .088 .079 .000 -.032 -.195 -.050 .054 .026
Nether. 4.3 .088 .117 .139 -.021 -.148 -.166 .144 .008
Sweden 4.3 .088 .096 .077 .041 .097 .010 .106 .073
Denmark 4.6 .088 .086 .048 .028 -.150 -.023 .081 .058
Canada 4.6 .088 .088 .166 .106 -.152 .018 .171 .101
Finland 4.8 .088 .074 -.006 -.092 -.127 -.034 .071 .000
Ireland 4.9 .088 .100 .142 .084 -.128 .054 .150 .103
Norway 5.4 .088 .084 .008 -.008 -.154 -.038 .060 .039
US 5.4 .088 .086 .164 .121 -.138 .053 .164 .110
UK 6.1 .088 .100 .236 .161 -.077 .081 .204 .140
r with
Diffusion 1.000 .000 .104 .682 .590 .499 .507 .686 .596
a Based on assumed falling rate of increase (or decrease at ages 70+)
Stated differently, these results reveal that the past changes in logged mortality ratios are correlated negatively with the predicted future changes across nations (r = -.62). Those nations at the later stages of the cigarette epidemic and having recently experienced the largest decline in the logged ratio or female advantage likely will in turn experience the largest predicted rise in the near future; those nations at the earlier stages of the cigarette epidemic and having recently experienced the largest increase in the logged ratio or female advantage likely will in turn experience the largest predicted decline in the near future.
For ages 70 and over, both the predicted logged smoking and non-smoking ratios typically lead to a declining female advantage, and the predicted proportional change for most nations in Table 5 is negative. However, the degree of change again correlates with cigarette diffusion (r = .499 and .507). The decline in the female advantage is greater for nations at the earlier stage of diffusion that have recently experienced rising rates of female smoking prevalence than for nations at the later stages of diffusion that now have similar rates of male and female smoking prevalence. The main difference between the older ages and younger ages stems from the logged non-smoking mortality ratio, which has fallen at the older ages rather than increased.
For all ages combined, the growing female advantage at younger ages outweighs the declining female advantage at older ages to produce largely positive values for the predicted proportional changes. Based on the models, all but four nations – Spain, Greece, Japan, and Belgium – can expect the female advantage in mortality to continue rising. The continued rise again proves larger for nations at later stages of cigarette diffusion than earlier stages. The United Kingdom and the United States, for example, would appear to experience substantial increases in the female advantage, reaching values ranging from 11.0 to 20.4 percent. These nations have already experienced the consequences of rising female smoking for the sex differential. With smoking prevalence having reached near equality, non-smoking mortality contributes more to the sex differential, and, based on past trends, would contribute to a growing differential overall.
To illustrate these national differences, Figure 4 graphs the predicted logged total mortality ratio for two nations – Spain (early stage) and the United Kingdom (late stage) – at different stages of cigarette diffusion. With the female advantage declining in future decades in Spain and rising in future decades in the United Kingdom, the directions of change contrast starkly. Perhaps more importantly, projections based on the simple continuation of past trends within each nation – without attending to smoking-attributed mortality and smoking trends – fail to capture the likely reversal of the differential in the future.
the models assume that in the future the logged non-smoking mortality ratio remains unchanged from current levels or reverses course to decline, the projections reveal larger negative changes in the logged total mortality ratio for nations at earlier stages of diffusion and smaller growth for nations at later stages of diffusion. However, the relative position of the nations changes little. The influence of the logged smoking mortality ratio and the recent trends in smoking prevalence will produce national differences in the future logged ratios that continue to vary with cigarette diffusion.
Figure 4: Predicted Trends (Fixed Effects OLS Regression Model) in Logged Total Mortality Ratio from 1975-2020, by Nation and Stage of Cigarette Diffusion, Ages 35-69
0.2
0.4
0.6
0.8
1
1.2
1975
1990
2005
2020
Year
Lo
gg
e
d
T
o
ta
l M
o
rt
a
li
ty
R
a
ti
o Spain - Simple
Projection
Spain
-Smoking Based Model
UK - Simple Projection
6. Discussion
After widening for nearly 100 years, sex differences in mortality have over the last decade or two begun to narrow in many high income Western nations (Trovato and Lalu 1996, 1998; Waldron 1993, 2000). The results presented here for measure of logged mortality ratios (see also Pampel 2002) demonstrate that the reversal has a specific cause – the growing use of cigarettes by women. Whereas the female advantage shown in the logged ratios for smoking-attributed deaths has declined, it has continued to grow for non-smoking deaths (although perhaps not at the same pace today as earlier).
Since current smoking deaths stem from smoking prevalence in previous decades, future relative rates of smoking-attributed mortality can be forecast from recent changes in cigarette use by men and women. Such forecasts demonstrate that the equalization of smoking-attributed mortality will continue at least until 2020 (the latest forecast date given available data and the lag between smoking and smoking death). However, compared to the past, the rate of decline of the logged ratios in smoking mortality appears to slow in the future. As cigarette use among women and men move toward parity, smoking-attributed mortality will contribute less to the sex differential for all causes. Many nations have already reached this point, and, absent a major shift in norms and preferences, cigarette use will do little to affect the trajectory of the sex differential overall. If smoking behavior of women relative to men remains near equality, then the contribution of smoking-attributed mortality of women relative to men will change little.
Given the declining contribution of smoking mortality to the relative mortality rates overall, the contribution of trends in non-smoking mortality becomes critical. Having risen steadily over the past two to three decades, the sex differential in non-smoking mortality will likely continue to rise in the near future, perhaps at a slower rate. If so, the sex differential for all causes will, on average, also rise. This prediction depends on the assumed continuation of increases in the female advantage in causes of death unrelated to smoking, and past patterns obviously do not guarantee the same in the future. If instead, the past growth in the female advantage in non-smoking mortality is assumed to immediately cease or even reverse direction, it would lead to different predictions: The total sex differential would show no growth or decline.
sex differential. As a result, deaths from suicide, homicide, accidental injury, cancer, COPD, stroke, and heart disease that have little direct relationship to smoking do not indicate convergence between men and women. On the other hand, reductions in the use of tobacco by men may reflect a broader and growing concern with good health that may soon bring rewards in other areas of health. Such trends may narrow the gap in non-smoking mortality between men and women.
Whatever the future trend on average, nations will likely continue to demonstrate considerable diversity in the patterns of change in relative male and female rates of smoking and non-smoking mortality. The diversity in smoking mortality relates closely to the stage of cigarette diffusion. A simple measure of the historical timing of the spread of cigarette use relates closely enough to sex differences in smoking prevalence to help account for differences across nations in observed sex differences in smoking mortality. Given this relationship, the forecasts reveal that nations at earlier stages of the epidemic will experience the most harm to female mortality from smoking, and that nations at later stages will have already experienced most of the harm. With smoking contributing more to the sex differential in mortality overall in nations at earlier stages, it will in the future slow the growth in the female advantage that occurred in the past. With smoking contributing less to the sex differential in mortality overall in nations at later stages of diffusion, it can be expected to grow more than it has in the past. In rough terms, nations of northern Europe and the former English colonies that experienced the smoking epidemic first will likely have the largest increase in the sex differential. Nations in southern Europe that experienced the smoking epidemic last will have the smallest increase or even a short-term decrease.
These findings may depend on the particular measure of sex differences used in the analysis. The reliance on smoking and non-smoking mortality rates with a floor of zero and considerable skew at the other end of the distribution warrants the use of relative measures. Logged mortality ratios focus on relative mortality rates of men and women, reduce the skew in the measures, and are invariant to choice of numerator and denominator. However, focusing on absolute differences in life expectancies might change the results. Future research needs to investigate this possibility and translate mortality rates into life table functions.
of smoking behavior, were they available, would do more to increase confidence in the models and findings. Another obvious weakness of the analysis comes from the need to simply project alternative trajectories in the sex differential in non-smoking mortality without any theoretically grounded determinants. Still, use of these measures to forecast future mortality improves on forecasts based only on recent trends and offers new insights into future patterns of change.
7. Acknowledgements
References
Brønnum, H. & Juel, K. (2000) “Estimating Mortality Due to Cigarette Smoking: Two Methods, Same Result.” Epidemiology 11:422-426.
Centers for Disease Control (2004) “Smoking-Attributable Mortality, Morbidity, and Economic Costs (SAMMEC).” URL: http://www.cdc.gov/tobacco/sammec, accessed August 29, 2004.
Department of Health and Human Services (DHHS) (1989) Reducing the Health
Consequences of Smoking: 25 Years of Progress. A Report of the Surgeon General. Rockville MD: U.S. Department of Health and Human Services.
Department of Health and Human Services (DHHS) (2001) Women and Smoking. A
Report of the Surgeon General. Rockville MD: U.S. Department of Health and
Human Services.
Doll, R., Peto, R., Wheatley, K., & Sutherland, I. (1994) “Mortality in Relation to Smoking: 40 Years’ Observation on Male British Doctors.” British Medical
Journal 309:901-911.
Ferrence, Roberta G. (1989) Deadly Fashion: The Rise and Fall of Cigarette Smoking in North America. New York: Garland Publishing.
Forey, Barbara, Hamling, Jan, Lee, Peter, & Wald, Nicholas (eds.) (2002) International
Smoking Statistics. Second Edition. Oxford: Oxford University Press.
Lopez, A.D. (1995) “The Lung Cancer Epidemic in Developed Countries.” Pp. 111-143 in Alan D. Lopez, Graziella Caselli, and Tapani Valkonen (eds.), Adult Mortality
in Developed Countries: From Description to Explanation. Oxford: Clarendon.
Lopez, A.D., Collishaw, N.E., & Piha, T. (1994) “A Descriptive Model of the Cigarette Epidemic in Developed Countries.” Tobacco Control 3:242-247.
Malarcher, A.M., Schulman, J., Epstein, L.A., Thun, M.J., Mowery, P., Pierce, B., Escobedo, L., & Giovino, G.A. (2000) “Methodological Issues in Estimating Smoking-Attributable Mortality in the United States.” American Journal of
Epidemiology 152:573-584.
Nathanson, C.A. (1995) “Mortality and the Position of Women in Developed Countries.” Pp. 135-157 in Alan D. Lopez, Graziella Caselli, and Tapani Valkonen (eds.), Adult Mortality in Developed Countries: From Description to
Pampel, F.C. (2001) “Cigarette Diffusion and Sex Differences in Smoking.” Journal of
Health and Social Behavior 43:388-404.
Pampel, F.C. (2002) “Cigarette Use and the Narrowing Sex Differential in Mortality.”
Population and Development Review 28:77-104.
Pampel, F.C. (2003) “Declining Differences in Lung Cancer Mortality in High Income Nations.” Demography 41:45-66.
Peto, Richard, Lopez, Alan D., Boreham, Jillian, Thun, Michael, & Heath, Clark Jr. (1992) “Mortality From Tobacco in Developed Countries: Indirect Estimation From National Vital Statistics.” Lancet 339:1268-1278.
Peto, Richard, Lopez, Alan D., Boreham, Jillian, Thun, Michael, & Heath, Clark Jr. (1994) Mortality from Smoking in Developed Countries 1950-2000: Indirect
Estimates from National Vital Statistics. Oxford: Oxford University Press.
Sterling, T.D., Rosenbaum, W.L., & Weinkam, J.J. (1993) “Risk Attribution and Tobacco-Related Deaths.” American Journal of Epidemiology 138:128-139. Thun, M.J., Apicella, L., & Henley, S.J. (2000) “Smoking vs. Other Risk Factors as the
Cause of Smoking-Attributable Deaths: Confounding in the Courtroom.” JAMA 284:706-712.
Thun, M.J., Day-Lally, C.A., Calle, E.E., Flanders, W.D., & Heath, C.W. Jr. (1995) “Excess Mortality among Cigarette Smokers: Changes in a 20-Year Interval.”
American Journal of Public Health 85:1223-1230.
Trovato, F., & Lalu, N.M. (1996) “Narrowing Sex Differentials in Life Expectancy in the Industrialized World: Early 1970’s to Early 1990’s.” Social Biology 43:20-37.
Trovato, F., & Lalu, N.M. (1998) “Contributions of Cause-Specific Mortality to Changing Sex Differentials in Life Expectancy: Seven Nations Case Study.”
Social Biology 45:1-20.
Valkonen, T., & van Poppel, F. (1997) “The Contribution of Smoking to Sex Differences in Life Expectancy: Four Nordic Countries and the Netherlands, 1970-1989.” European Journal of Public Health 7:302-310.
Waldron, I. (1993) “Recent Trends in Sex Mortality Ratios for Adults in Developed Countries.” Social Science and Medicine 36:451-462.
150-181 in Ellen Annandale and Kate Hunt (eds.), Gender Inequalities in Health. Buckingham UK: Open University.
World Health Organization (1996 and various years) World Health Statistics Annual. Geneva: World Health Organization. URL: http://www.who.int/whosis/, accessed August 29, 2004.
Appendix
To summarize the more specific details of the indirect standardization approach to computing smoking-attributed deaths, Sterling, Rosenbaum, and Weinkam (1993) list four steps. First, the method computes excess lung cancer deaths for each age group (from 35-39 to 75-79) and sex (males and females) as the difference between actual lung cancer deaths and lung cancer deaths expected from the rates among a non-smoking population.18 Although deaths from tobacco also occur before age 35, the small number makes reliable estimation difficult.
Second, the method estimates the proportion of current smokers in each age and sex group by assuming that the observed lung cancer mortality rate results from a mixture of such deaths among never smokers and current smokers. The assumption implies that the total lung cancer death rate for any age and sex group equals the weighted sum of the rates of current smokers and never smokers, with the weights equal to the proportion of smokers and non-smokers. The lung cancer death rates for current smokers and never smokers obtained from step one make it possible to solve for the unknown proportion of smokers.
Third, the method calculates excess risk by cause of death (other than lung cancer) for each age and sex group from two pieces of information: the proportion current smokers obtained in step two, and the relative risk of current versus never smokers for each cause of death. The categories for cause of death include upper aero-digestive cancer, other cancer, COPD, other respiratory diseases, vascular diseases, and other medical diseases. The relative risks come from the American Cancer Society’s prospective Cancer Prevention Study II of one million Americans ages 30 and older from 1982-1992. The large sample allows reliable estimation of the mortality of current smokers and never smokers by age, sex, and cause of death. The excess risk then equals the proportion smokers times the relative risk (minus one) for each cause. However, some of the excess risk associated with smoking stems from confounding with other risk factors such as drinking, poverty, poor diet, hazardous occupations, and lack of exercise. To compensate for the problem of confounding, Peto et al. halve these estimates of excess risk for causes other than lung cancer.19
Fourth, based on total deaths and the proportion of deaths attributed to smoking by the excess risk and proportion smokers, the method calculates the actual number of
18 Peto et al. (1994:A.50) state: “Because lung cancer rates are particularly unreliable in extreme old age, the proportions of each disease category
attributed to smoking will simply be taken to be the same at 80+ as at 75-79.”
19 The method does not halve the number of smoking-attributed deaths, but halves the excess risk for causes other than lung cancer. Peto et al.
smoking-attributed deaths for each cause, age group, and sex. Total deaths by age, sex, and cause come from the World Health Organization (1996). Summing over the causes provides total numbers of smoking-attributed and other deaths, and population figures allow calculation of rates.
Debate exists over the accuracy of the indirect estimates, with critics arguing that they overstate deaths due to tobacco in two ways (Sterling, Rosenbaum, and Weinkam 1993). One, the relative risks of cause-specific deaths for smokers and non-smokers come from the Cancer Prevention Study II, a nonrandom sample of the U.S. population. Over-representing affluent and highly educated volunteers, the study tends to understate deaths among never smokers. Two, the method does not directly adjust with statistical controls for confounding by other harmful statuses and behaviors associated with both smoking and death, and therefore overstates the harm of cigarette use.20
To counter concerns about the possible overstatement of smoking-attributed mortality, Peto et al. halve their initial estimates of excess smoking risk for causes other than lung cancer. Although in some ways arbitrary and made intentionally large to conservatively estimate smoking-attributed mortality, the adjustment gives nearly the same number of smoking deaths as the U.S. Surgeon General (DHHS 1989) does when combining national mortality rates in the U.S. with additional data on the prevalence of smoking (Peto et al. 1992). Other tests of validity similarly support the indirect method. Brønnum-Hansen and Juel (2000) find with Danish data that the indirect method gives results nearly identical to a method that uses retrospective information on smoking.21 Valkonen and van Poppel (1997:308) find with data on the Nordic nations and the Netherlands that the Peto et al. method shows “a relatively close correspondence . . . [with results] obtained in prospective national studies.” Others suggest that the method may in fact understate rather than, as argued by critics, overstate tobacco-attributed mortality. The use of CPS-II overstates smoking-attributed mortality by 19 percent, and confounding factors overstate smoking-attributed mortality by 2.5 percent (Malarcher et al. 2000; Thun, Apicella, and Henley 2000). Given these findings, the 50 percent adjustment in excess risk made by Peto et al. errs on the side of caution in identifying the harm of smoking.
20 Another criticism suggests that the estimates of the relative risks of current smokers compared to never smokers ignore former smokers and
differences among current smokers in the intensity of cigarette use. Although the method simplifies procedures by dividing the population into current and never smokers, the use of excess lung cancer deaths to estimate smoking prevalence also accounts for deaths among former smokers (Valkonen and van Poppel (1997:308). By using lung cancer rates to reflect the smoking history of a group in terms of prevalence, duration, and intensity, the procedure allows for comparisons of nations that differ in the proportion of smokers and former smokers, and the mix of heavy, moderate, and light smokers among current and former users. Although not measured directly, the exposure to cigarette use of all types shows in the indirect estimates.
21 Specifically, their estimate of the proportion of deaths from selected causes in 1993 that are attributable to cigarette smoking equals 33 percent