in the population sciences published by the Max Planck Institute for Demographic Research Konrad-Zuse Str. 1, D-18057 Rostock · GERMANY www.demographic-research.org
DEMOGRAPHIC RESEARCH
VOLUME 15, ARTICLE 11, PAGES 329-346
PUBLISHED 02 NOVEMBER 2006
http://www.demographic-research.org/Volumes/Vol15/11/ DOI: 10.4054/DemRes.2006.15.11
Research Materials
An evaluation of the one percent clustered
sample of the 1990 census of China
William Lavely
William M. Mason
© 2006 Lavely & Mason
This open-access work is published under the terms of the Creative Commons Attribution NonCommercial License 2.0 Germany, which permits use, reproduction & distribution in any medium for non-commercial purposes, provided the original author(s) and source are given credit.
2 Clustering 331
3 Duplicates 331
4 Geographic coverage 332
5 National comparisons of sample and census 335
6 County-level comparisons of sample and census 340
7 Discussion 342
8 Acknowledgements 342
References 343
An evaluation of the one percent clustered sample
of the 1990 census of China
William Lavely 1 William M. Mason 2
Abstract
We describe and evaluate a one percent clustered sample of the 1990 Census of China, the largest publicly-available micro sample of any Chinese census, using direct inspection as well as comparisons with published data drawn from the complete enumeration. In the absence of official documentation, we elucidate the basis of the clustering; detect duplicate cases; report corrected totals; and make comparisons between the sample data and tabulations based on the complete enumeration at the province and county levels. Although the sample contains several anomalies, we conclude that it is broadly serviceable.
1. Introduction
Two micro-samples of the 1990 Chinese Census have circulated in China and abroad. The first, in order of creation, is a one percent sample of rural administrative villages (xingzheng cun) and urban neighborhoods known as street committees (jiedao
weiyuanhui).3 The second is a one percent sample of households. We refer to the former, the subject of this article, as the “one percent clustered sample,” and to the latter as the “one percent household sample.” These data sets are not public use micro samples (PUMS) in the sense understood by users of, for example, U.S. Census data. No official printed documentation has been released that is specific to either sample, and, in particular, there is no documentation or evaluation of the method and procedures used to draw the samples.
Recently the China Population Information and Research Center has made the one percent clustered sample available through the Texas A&M China Archive.4 The one percent clustered sample is thus the only publicly-available micro sample of the 1990 census; indeed, it is largest readily available micro sample of any Chinese census.5 We obtained the clustered sample and corresponding mortality data separately, from unofficial sources. Other researchers have obtained the clustered sample independently and have made use of it (e.g., Fan and Huang 1998; Li and Zhu 2000; Huang 2001). Our clustered sample is identical to the one purveyed by Texas A&M, except that the latter does not contain mortality data.
This paper evaluates the one percent clustered sample, using direct inspection as well as a series of comparisons with published data drawn from the complete enumeration. We first discuss the nature of the clustering, and report what we know about the sampling of clusters. We then note the existence of duplicate cases, and report corrected totals when duplicates are dropped. Subsequent sections describe geographic coverage of the one percent clustered sample, compare sample to published 100 percent tabulations for basic descriptors, and report selected comparisons between sample and 100 percent enumeration data at the county level.
3 An administrative village consists of one or several adjacent natural villages, and is the lowest level rural
civil unit. In 1990, a neighborhood (street committee) was the corresponding urban civil unit.
4
As of August 1, 2006, the data could be downloaded from The China Archive web site http://chinaarchive.tamu.edu/portal/site/chinaarchive/.
5
2. Clustering
Lacking any documentation on the method used in sampling, our description of the clustered sample relies on inference and a bit of hearsay. We have been told that the clustered sample was drawn as a way to provide a timely preview of census results, before final tabulations based on the complete enumeration could be prepared. We suspect, but cannot verify, that the sample is a systematic selection of all of the living persons in every hundredth administrative village (or urban neighborhood) within each province, and of all deaths in the sampled places that occurred in the 18 months leading up to the official July 1, 1990 date of the census.6 Like the 1990 Census itself (except for national totals published in selected documents, e.g., State Council Population Census Office (1993)), the clustered sample contains civilians only.
Administrative villages and urban neighborhoods lend themselves as sampling units because they also serve as census districts, and census returns are sent up the line bundled by village or neighborhood. Sampling and data entry presumably took place in provincial offices. These circumstances may explain some anomalous aspects of the sample.
3. Duplicates
Duplicate cases are one such anomaly. Duplicates appeared in approximately half the provinces, and in all cases entire sample villages were duplicated. We considered the possibility that the duplicates were inserted intentionally, perhaps as a weighting scheme. But because the sample is far more faithful to the 100 percent tabulations (State Council Population Census Office 1993) when the duplicates are omitted, it appears more likely that the duplicates resulted from errors in data processing. In their discussion of the one percent clustered sample Li and Zhu (2000:228) also conclude that the duplicates are due to processing errors. We have removed the duplicates from all computations reported in this paper. Users should note that the Texas A&M data set also contains the duplicates.
Without duplicate records the sample consists of 8,514 administrative villages or urban neighborhoods containing 11,475,104 enumerated persons, which averages to 1,348 persons per sample unit. In addition there are 99,196 records of persons who died in the 18 months prior to the census.
6
4. Geographic coverage
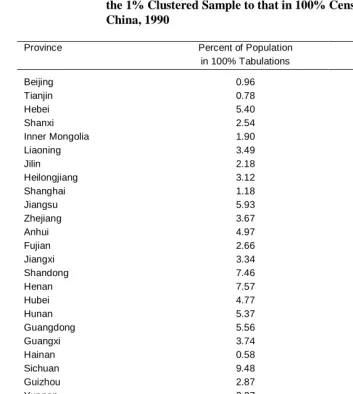
The clustered sample contains data in all 30 provinces and regions covered by the 1990 census. We consider first the extent to which the clustered sample reproduces the distribution of population across provinces and the municipalities with provincial status in 1990 (Beijing, Tianjin, and Shanghai). Table 1 shows the percentage distribution of population by province in the complete census, and the ratio of the sample to complete census percentage in each province. A ratio greater than one indicates that a province is oversampled. A ratio less than one indicates that a province is undersampled. The ratio varies from a low of .82 in Ningxia to a high of 1.29 in Tianjin Municipality, two provincial level units with small populations. Because the sample units are clusters, the sampling variability tends to be greater than would be expected for a simple random sample of individuals, and the extreme ratios occur in provinces with very small proportions of the population. The ratio in larger provinces generally varies between .95 and 1.05.
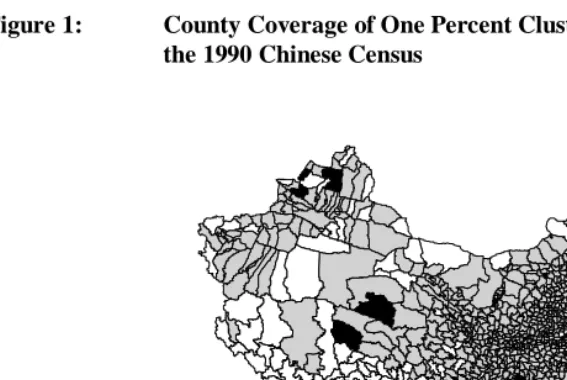
There is also broad geographic coverage within provinces. Approximately 91 percent of China’s 2,845 county-level units contain at least one sample administrative village or urban neighborhood. Among the 2,600 county-level units with coverage, there is an average of 3.2 sample units per county. Sample coverage is shown in the accompanying map of China’s counties (Figure 1). Counties containing at least one village unit in the sample are shown in gray or black, while counties with no coverage are in white. Coverage is quite regular in China Proper and the northeast, as contrasted with the sparser coverage in the Inner Asian regions of Inner Mongolia, Xinjiang, and Tibet, and parts of Gansu and Qinghai provinces. As may be seen in Table 1, none of these provinces is under-sampled. The sparseness of populations in these areas appears to explain the lack of coverage. Tibet, however, is an exception.
Table 1: Comparison of the Provincial Distribution of Population in the 1% Clustered Sample to that in 100% Census Tabulations, China, 1990
Province Percent of Population
in 100% Tabulations
Ratio of Sample to Census
Beijing 0.96 1.03
Tianjin 0.78 1.29
Hebei 5.40 0.96
Shanxi 2.54 1.03
Inner Mongolia 1.90 1.02
Liaoning 3.49 1.00
Jilin 2.18 1.07
Heilongjiang 3.12 1.00
Shanghai 1.18 1.14
Jiangsu 5.93 0.99
Zhejiang 3.67 0.99
Anhui 4.97 0.95
Fujian 2.66 1.11
Jiangxi 3.34 1.04
Shandong 7.46 0.97
Henan 7.57 0.96
Hubei 4.77 1.03
Hunan 5.37 1.02
Guangdong 5.56 0.98
Guangxi 3.74 1.03
Hainan 0.58 1.09
Sichuan 9.48 0.96
Guizhou 2.87 0.95
Yunnan 3.27 0.99
Tibet 0.19 1.09
Shaanxi 2.91 1.01
Gansu 1.98 1.06
Qinghai 0.39 1.27
Ningxia 0.41 0.82
Xinjiang 1.34 0.98
Total 100.01% 1.015
Office 1992). For example, the 100 percent tabulation for Tibet shows that 76.3 percent of the rural population age 15 and above is illiterate. In the one percent sample, the corresponding figure is 77.4 percent. There is also a close correspondence with the rural age distribution, the distribution of rural women by their number of live births, and on other characteristics. The Tibetan sample may thus be useful for some purposes. One other sample anomaly remains to be noted. The sample of dead persons includes four sample units that are in addition to the 8,514 sample units containing live persons. The four units, all in Guangzhou City, Guangdong Province, were apparently erroneously substituted for the death cases in four other Guangzhou sample units. These cases, 123 records in all, are included in the following comparisons.7
Figure 1: County Coverage of One Percent Clustered Sample of the 1990 Chinese Census
No sample coverage Sample coverage No sample deaths
7 The four dead-only units, all neighborhoods in the Liwan and Yuexiu Districts of Guangzhou Shi (GB
5. National comparisons of sample and census
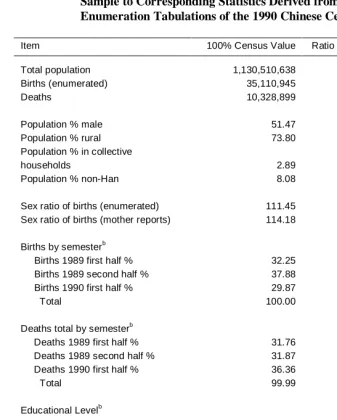
A series of comparisons at the national level (Tables 2-3 and Figures 2-3) reveals a reasonable concordance between the sample and the underlying complete census data as derived from published tabulations (State Council Population Census Office 1993). When the total of persons in the sample is multiplied by the reciprocal of the sampling fraction (i.e., 100) and divided by the census total, the resultant ratio is 1.02. The one percent clustered sample thus overstates the census population by two percent (see Table 2). Births are similarly overstated, while for the death sample (after alternative adjustments to account for excluded counties, discussed in the next section) the ratio of adjusted sample to the 100% is .992 to .998.
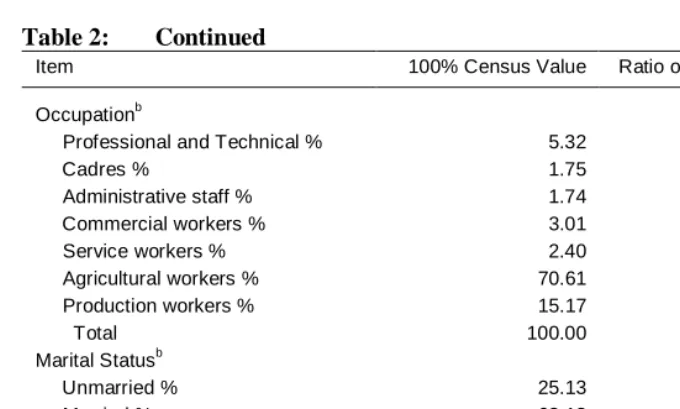
Having established a fair concordance between census and sample for total population, births, and deaths, we now consider the concordance of distributions of populations across various categories listed in Table 2. Most measures, such as percent male, percent rural, the sex ratio at birth, and deaths by semester, are within two percent of the census value. The distributions of population by occupation and by marital status are similarly close. There are two exceptions. The sample over-states the percent ever attending a university by 10 percent, perhaps as a consequence of the over-sample of the provincial level cities Shanghai and Tianjin that can be observed in Table 1. There is also an over-sampling of births in 1990 relative to 1989, for which we have no explanation.
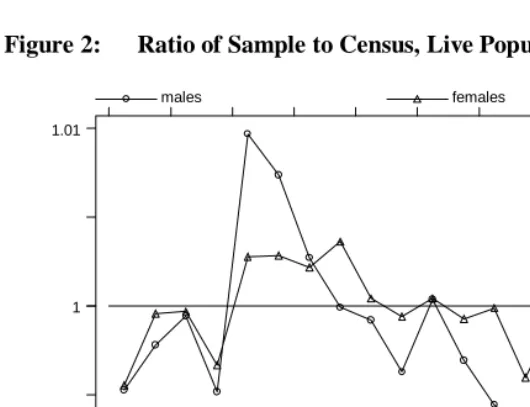
Figure 2 presents a sample to census comparison of the sex-specific age distributions of those alive at the time of enumeration. The sample distribution of females by age is quite close to that for the census, varying within .5 percent at every age below 80. The male sample distribution is less regular. It contains an excess of males at ages 20-29, and a deficit of males age 60-75. Even so, these deviations are within one percent of the census value. The greater variability of males may be due to the greater concentration of males in sparse collective households and related institutional concentrations.
Table 2: Comparison of National Statistics Derived from the 1% Clustered Sample to Corresponding Statistics Derived from Complete Enumeration Tabulations of the 1990 Chinese Census
Item 100% Census Value Ratio of Sample to Census
Total population 1,130,510,638 1.02
Births (enumerated) 35,110,945 1.01
Deaths 10,328,899 .992 to .998a
Population % male 51.47 1.00
Population % rural 73.80 0.99
Population % in collective
households 2.89 1.02
Population % non-Han 8.08 1.00
Sex ratio of births (enumerated) 111.45 1.00
Sex ratio of births (mother reports) 114.18 1.00
Births by semesterb
Births 1989 first half % 32.25 0.98
Births 1989 second half % 37.88 0.98
Births 1990 first half % 29.87 1.04
Total 100.00
Deaths total by semesterb
Deaths 1989 first half % 31.76 0.99
Deaths 1989 second half % 31.87 0.99
Deaths 1990 first half % 36.36 1.02
Total 99.99
Educational Levelb
University % 0.62 1.10
Technical college % 0.97 1.04
Vocational high school % 1.74 0.97
Upper middle school % 7.30 1.01
Lower middle school % 26.50 1.00
Primary school % 42.27 1.00
Illiterate or semi-literate % 20.61 1.00
Total 100.01
Table 2: Continued
Item 100% Census Value Ratio of Sample to Census
Occupationb
Professional and Technical % 5.32 1.02
Cadres % 1.75 1.02
Administrative staff % 1.74 0.98
Commercial workers % 3.01 1.01
Service workers % 2.40 1.02
Agricultural workers % 70.61 0.99
Production workers % 15.17 1.02
Total 100.00
Marital Statusb
Unmarried % 25.13 1.00
Married % 68.18 1.00
Widowed % 6.10 1.00
Divorced % 0.59 1.00
Total 100.00
Sources: Population Census Office of China (1993) and one percent clustered sample.
a Sample deaths are adjusted for lack of death coverage in certain counties under different assumptions; see text and note 9 for an
explanation.
Figure 2: Ratio of Sample to Census, Live Population, China, 1990.
Years of Age
males females
0 10 20 30 40 50 60 70 80 90
.99 1 1.01
Sources: Population Census Office of China (1993) and one percent clustered sample.
Figure 3: Ratio of Sample to Census, Dead Population, China, 1990
Age at Death
dead males dead females
0 10 20 30 40 50 60 70 80 90
.9 1 1.1
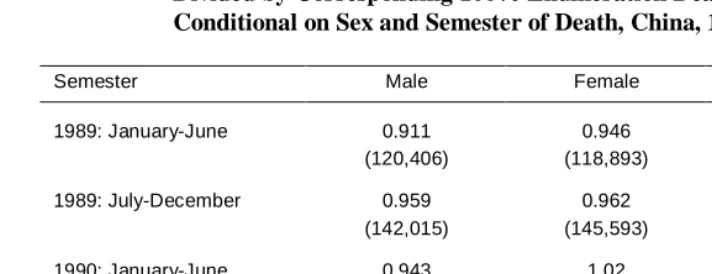
Because infant mortality is of particular interest, in Table 3 we further compare deaths at age 0 conditional on sex and semester of birth with the corresponding figures from published census tabulations. Official sources do not document the calculation of infant mortality rates with detail sufficient to sustain independent replication. For this reason our analysis is restricted to comparison of sample frequencies of infant death with those derived from the 100 percent enumeration tables (State Council Population Census Office 1993). The interior cells of Table 3 display ratios of sample infant deaths to complete enumeration infant deaths conditional on sex and semester of birth. The row and column margins contain ratios separately for sex and semester. Because of gaps in death coverage at all ages at the county level, which are discussed in the next section, the ratio of sample infant deaths to complete census infant deaths is less than one (.960), which suggests that the clustered sample undercounts infant deaths. However, upon adjusting for county coverage gaps in death reporting under the assumption that infant deaths were missed with probability identical to that for deaths to older individuals, the ratio of sample infant deaths to complete census infant deaths is found to be in the range of .991 to .999. This result suggests that infant deaths are not specifically undersampled in the one percent clustered sample. The sex-semester specific ratios in Table 3 should thus be considered to be downwardly biased owing to the absence of adjustment for nonreporting of deaths in particular counties. Of greater concern is the apparent undersampling of male relative to female infant deaths in every semester, as well as the inconsistency over semesters in the relative undersampling.8 We have no explanation for this variability, but note that at a minimum it complicates the conclusions that can be drawn from individual level analyses of infant mortality.
8
Table 3: One Percent Cluster Sample Deaths at Age 0 (Multiplied by 100) Divided by Corresponding 100% Enumeration Deaths,
Conditional on Sex and Semester of Death, China, 1990a
Semester Male Female Total
1989: January-June 0.911 0.946 0.928
(120,406) (118,893) (239,299)
1989: July-December 0.959 0.962 0.961
(142,015) (145,593) (287,608)
1990: January-June 0.943 1.02 0.981
(177,418) (185,177) (362,595)
Total 0.941 0.980 0.960
(439,839) (449,663) (889,502)
Sources: Population Census Office of China (1993) and one percent clustered sample.
Note: Numbers in parentheses are death counts from 100 percent enumeration
aSample values are unadjusted for lack of death coverage in certain counties; see text for discussion.
6. County-level comparisons of sample and census
For total population at the county level, if the sample data are unbiased, a regression of sample population counts on total enumeration population counts should return a coefficient that is approximately .01. For this calculation we found a slope of .0095 (N=2,600). Fitting a cubic polynomial spline to the data revealed modest departures from linearity. If a handful of counties is excluded, the regression coefficient becomes .01. Thus, with respect to total population, the clustered one percent sample appears to be nearly unbiased at the county level.
county-level units for which there are no deaths. The county-county-level sample sizes in these prefectures range from a minimum of 1,600 to a maximum of 15,441. Given the contiguity of the counties, and their correspondence to the areas of prefectural administrations, it is probable that the lack of mortality data in the 43 counties is due to some aspect of procedure and not sampling variability. In our judgment, these five prefectures should be excluded from any analysis of mortality.
The remaining 54 zero-death county-level units are geographically scattered, although many pertain to urban units in Heilongjiang and Anhui. They are far less populous on average than the 43 described above, together containing only 8,166,649 persons. It is at least theoretically possible that some or all of the sampled villages in these 54 county-level units recorded no deaths in the 18 months prior to the census. We addressed this question statistically, using total population as well as total death counts available in 1990 county census volumes. The structure of the inferential problem is to determine whether zero sampled deaths in each of the 54 counties is plausible or implausible, given a known death count and total population, and a sample population total, for each county. In our explorations, we concluded that zero sample deaths were implausible in all but nine of the counties. Other analysts might well use different methods and reach slightly different conclusions. For this reason, we present lower and upper bounds on the number of excluded counties. Specifically, at a minimum the 43 zero-death counties in five prefectures previously discussed should be excluded for the purposes of mortality analysis. At a maximum 97 zero-death counties should be excluded.
When zero-death counties are excluded, the complete-census death counts need to be reduced correspondingly, in order to make valid comparisons of sample-estimated deaths to complete-census deaths at the national level. The ratio of sample-to-census deaths in Table 2 provides this upper and lower bound for comparison. The lower bound is based on excluding 43 zero-death counties; the upper bound is based on excluding 97 zero-death counties.9 The 97 zero-death counties are portrayed in the map (Figure 1) with black shading; in the complete census, these counties contributed 3.79 percent of deaths. The 97 zero-death counties are listed in Appendix 1.10
If death sampling is unbiased at the county level, then a regression of sampled deaths at the county level on complete census deaths at the county level should have a slope that is approximately 0.01. Omitting the 43 counties in five zero-death prefectures, we find a slope of .0096 (N=2,276); omitting all 97 zero-death counties, we
9 The first sample to census ratio of deaths in Table 2 excludes only deaths from the 43 zero-death counties of
the five prefectures, while the latter excludes deaths from all 97 zero-death counties. Counties in the five prefectures account for 3.177% of census deaths, while all 97 counties account for 3.794% of census deaths. 10
find a slope of .0095 (N=2,222).11 Thus, it appears, apart from the zero-death problem at the county level, that the one percent clustered sample is approximately unbiased for total deaths at the county level.
7. Discussion
The one percent clustered sample appears to be a true one percent sample of the 1990 census. It reproduces the geographic distribution of population and major population components quite well. Although the clustering of the sample reduces precision, it permits contextual analyses based on multilevel methods of statistical analysis.
There are anomalies. The sample for Tibet lacks urban units and appears to use a different sampling procedure. The national distribution of deaths by age for males is irregular, and male infant mortality is somewhat under-sampled relative to the census. These deficiencies must be assessed for their relevance to specific analytic purposes. For example, there is mounting evidence (e.g., Ministry of Health 1999) that the 1990 census underreported infant mortality by a margin far wider than the gap between sample and census infant mortality. Against this kind of uncertainty, the sample can be useful. The results of the sample/enumeration comparisons we have presented suggest that the one percent clustered sample will be serviceable for many purposes.
8. Acknowledgements
We gratefully acknowledge the valuable advice of Griffith Feeney and G. William Skinner, the research assistance of Yingying Zhou, and the support of the Henry Luce Foundation.
11
References
Fan, C. Cindy and Youqin Huang. 1998. “Waves of Rural Brides: Female Marriage Migration in China.” Annals of the Association of American Geographers 88(2): 227-251.
Huang, Youqin. 2001. “Gender, Hukou, and the Occupational Attainment of Female Migrants in China (1985-1990).” Environment and Planning A, 33:257-279.
Li Shuzhuo and Zhu Chuzhu. 2000. Research and Community Practice on Gender
Difference in Child Survival in China. Beijing: China Population Publishing
House.
Ministry of Health, Peoples Republic of China. 1999. Zhongguo weisheng tongji tiyao 1999 (Chinese Health Statistical Digest 1999). Beijing: Health Press.
State Council Population Census Office, and Department of Population Statistics, State Statistical Bureau, People’s Republic of China. 1993. Tabulation on the 1990
Population Census of the People’s Republic of China. Beijing: China Statistical
Publishing House. Four volumes.
State Statistical Bureau. 1994. “Data Structure of the 1990 Population Census of China.” [Unpublished codebook.]
Tibet Autonomous Region Population Census Office. 1992. Tabulation on the 1990
Population Census of Tibet Autonomous Region. Lhasa: Tibet People’s
Appendix 1:
Zero Death Counties Selected for Exclusion from Mortality Analysis in the One Percent Clustered Sample, China, 1990
GB Code Province Name
150103 Inner Mongolia Huhehaote: Huimin qu
150122 Inner Mongolia Tuoketuo xian
150402 Inner Mongolia Chifeng: Hongshan qu
210802 Liaoning Yingkou: Zhanqian qu
210803 Liaoning Yingkou: Xishi qu
210811 Liaoning Yingkou: Laobian qu
230402 Heilongjiang Hegang: Xiangyang qu
230403 Heilongjiang Hegang: Gongnong qu
230702 Heilongjiang Yichun: Yichun qu
230705 Heilongjiang Yichun: Xilin qu
230811 Heilongjiang Jiamusi: Jiaoqu
230826 Heilongjiang Huachuan xian
230834 Heilongjiang Youyi xian
230881 Heilongjiang Tongjiang shi
232603 Heilongjiang Wudalianchi shi
320703 Jiangsu Lianyungang: Lianyun qu
320704 Jiangsu Lianyungang: Yuntai qu
320705 Jiangsu Lianyungang: Xinpu qu
330921 Zhejiang Daishan xian
340302 Anhui Bengbu: Dong qu
340304 Anhui Bengbu: Xi qu
340404 Anhui Huainan: Xiejiaji qu
340503 Anhui Ma`anshan: Huashan qu
340702 Anhui Tongling: Tonggongshan qu
340803 Anhui Anqing: Daguan qu
341002 Anhui Huangshan shi CC: Tunxi qu
341003 Anhui Huangshan: Huangshan qu
Appendix 1: Continued
GB Code Province Name
341004 Anhui Huangshan: Huizhou qu
341023 Anhui Yi xian
342101 Anhui Fuyang shi
342530 Anhui Jingde xian
350203 Fujian Xiamen: Siming qu
360302 Jiangxi Pingxiang: Chengguan qu
360311 Jiangxi Pingxiang: Shangli qu
362124 Jiangxi Dayu xian
362129 Jiangxi Dingnan xian
410411 Henan Pingdingshan: Jiaoqu
412321 Henan Yucheng xian
412322 Henan Shangqiu xian
412323 Henan Minquan xian
412324 Henan Ningling xian
412325 Henan Sui xian
412326 Henan Xiayi xian
412327 Henan Zhecheng xian
412328 Henan Yongcheng xian
412701 Henan Zhoukou shi
412721 Henan Fugou xian
412722 Henan Xihua xian
412723 Henan Shangshui xian
412724 Henan Taikang xian
412725 Henan Luyi xian
412726 Henan Dancheng xian
412727 Henan Huaiyang xian
412728 Henan Shenqiu xian
412729 Henan Xiangcheng xian
412801 Henan Zhumadian shi
412821 Henan Queshan xian
Appendix 1: Continued
GB Code Province Name
412822 Henan Biyang xian
412823 Henan Suiping xian
412824 Henan Xiping xian
412825 Henan Shangcai xian
412826 Henan Ru`nan xian
412827 Henan Pingyu xian
412828 Henan Xincai xian
412829 Henan Zhengyang xian
450502 Guangxi Beihai: Haicheng qu
512201 Sichuan Wanxian shi
512221 Sichuan Wan xian
512222 Sichuan Kai xian
512223 Sichuan Zhong xian
512224 Sichuan Liangping xian
512225 Sichuan Yunyang xian
512226 Sichuan Fengjie xian
512227 Sichuan Wushan xian
512228 Sichuan Wuxi xian
512229 Sichuan Chengkou xian
512301 Sichuan Fuling shi
512322 Sichuan Dianjiang xian
512323 Sichuan Nanchuan xian
512324 Sichuan Fengdu xian
512326 Sichuan Wulong xian
513227 Sichuan Xiaojin xian
533121 Yunnan Luxi xian
610303 Shaanxi Baoji: Jintai qu
620105 Gansu Lanzhou: Anning qu
640121 Ningxia Yongning xian
654225 Xinjiang Yumin xian