37
B. Kianpour et al. / Journal of Chemical and Petroleum Engineering, 50 (2), Feb. 2017 / 37-45
Evaluating the Effect of Graphite Source
and Operating Conditions on the Synthesis
of Graphene Oxide
Bahareh Kianpour1, Akram Ebrahimi1, Zeinab Salehi2* and Shohreh Fatemi3
1. M.Sc. Student, Dept. of Chemical Eng., University of Tehran, Tehran, Iran. 2. Assistant Professor, Dept. of Chemical Eng., University of Tehran, Tehran, Iran.
3. Professor, Dept. of Chemical Eng., University of Tehran, Tehran, Iran.
(Received 25 February 2016, Accepted 4 September 2016)
Abstract
In this research graphene oxide was synthesized by two methods. These methods were achieved by changing the improved Hummers’
and modified Hummers’ methods. Structure of graphene oxide was characterized by scanning electron microscopy (SEM) images, X-ray diffraction (XRD) patterns, Raman spectroscopy and Fourier trans
-form infrared (FTIR) spectra. According to SEM image, the thickness
of graphene oxide sheets prepared by improved Hummers’ method is about 66 nm. In improved Hummers’ method excluding NaNO3 from reacting gel and performing reaction in a 9:1 volume ratio of concen-trated H2SO4/H3PO4 mixture improved the oxidation process by
elimi-nation of toxic gases, finally the prepared GO contains well-oxidized carbon materials. XRD results implied more oxidation for synthesized GO by improved Hummers’ based method. Importance of graphite source was shown in synthesis of pure GO. Two sources of graphite supplied by Daejung and Fluka Companies were used to synthesis GO in improved Hummers’ method. According to SEM images and XRD patterns, the graphite source prepared by Fluka Co. was more efficient towards production of pure GO than other graphite source. The results
also indicated that temperature and mixing condition are two
impor-tant factors for synthesis of GO.
Keywords
Graphite source; Graphene oxide; Operating condition; Synthesis.
Introduction1 * Corresponding Author.
E-mail: [email protected] (Z. Salehy) 1. Introduction
G
raphite is a crystalline form of carbon. In each layer of graphite, the carbon atoms are arranged in a honeycomb lattice with the interval of 0.142 nm, and the distance betweenplanes is 0.335 nm [1]. Bonding between layers is
via weak van der Waals bonds, which allows layers
of graphite to be easily separated, or to slide over
each other. After graphite layer separation, each
layer is named graphene, a two-dimensional struc-ture, with single layer of sp2-hybridized carbon
atoms in a honeycomb crystal lattice. Graphene is
38 B. Kianpour et al. / Journal of Chemical and Petroleum Engineering, 50 (2), Feb. 2017 / 37-45
In 2004, for the first time, graphene was in
-troduced to scientific community [2, 3]. Due to its
unique structure and geometry, graphene
possess-es remarkable physicochemical propertipossess-es, includ -ing a high Young’s modulus, high fracture strength, and excellent electrical and thermal conductivity,
fast mobility of charge carriers, large specific sur -face area and biocompatibility [4]. These
prop-erties enable graphene to be used in many fields
such as quantum physics, nano-electronics, energy research, catalysts and engineering of nanocom-posites and biomaterials [5, 6].
Graphene is highly hydrophobic and this prop
-erty limits its applications in many fields such as biological science and nanomedicine. Despite, GO
shows excellent hydrophilicity because of large amount of oxygen containing functional groups (i.e., carboxyl, hydroxyl, epoxy, carbonyl), and is
relatively, easily dispersed in water [7-9]. Gra -phene oxide aggregates in physiological buffers in the presence of salts. Therefore, to achieve desired
GO, it is needed to perform surface modification
[10]. The most common method is the use of strong
oxidizing agents to have graphene oxide (GO) as
the hydrophilic carbon material. Interlayer spac-ing for graphite increases from 0.335 nm to more than 0.625 nm after oxidation of graphene disrupt-ing the lattice [11, 12]. Usdisrupt-ing an oxidizdisrupt-ing agent, sheets of graphite are separated easily because
of weak van der Waals bonds and carbon atoms bind with O and H, to form graphene oxide (GO).
Although the exact structure of GO is unclear,
but the basal planes of the graphene oxide sheets contain mostly epoxide and hydroxyl groups, also carbonyl and carboxyl groups are in the structure,
mostly decorated at the edges [13]. The first one who demonstrated the synthesis of GO was Bro -die [14]. The synthesis was achieved by adding a portion of potassium chlorate to graphite in
fum-ing nitric acid [14]. Staudenmaier [15] improved
this protocol, using concentrated sulfuric acid and fuming nitric acid and adding the chlorate to mul-tiple aliquots. This change in the procedure
result-ed production of highly oxidizresult-ed GO in a vessel of single reaction significantly more practical.
Hummers and Offeman [16] reported a proce-dure that most commonly used today. They
oxi-dized graphite in sulfuric acid by adding KMnO4
and NaNO3 as oxidizing agents. These procedures
commonly produce toxic gases like NO2 or N2O4 because of using the fuming nitric acid or sodium
nitrate. Marcano and co-workers, reported an im
-proved synthesis of GO. They used the mixture
of H2SO4/H3PO4 in a 9:1 volume ratio, and
elimi-nated using of NaNO3 and increased the amount
of KMnO4 [12] By removing sodium nitrate and
fuming nitric acid during these procedures,
pro-duction of toxic gases like NO2 and N2O4 was in-hibited, also in this procedure the yield of GO was
increased. Based on the 3 g of graphite, Hummers method yields the production of 4.2 g graphene ox-ide while the yield by improved method was 5.8 g
graphene oxide. This oxidation procedure (KMnO4
and a 9:1 mixture of concentrated H2SO4/H3PO4),
called the “improved method” which could be used
to prepare improved GO (IGO), containing fewer defects in the basal plane comparing with GO pre -pared by the Hummers’ method [12]. By electrical reduction of graphene oxide, the formed reduced
graphene oxide (rGO) is similar to graphene but
contains some oxygen and other heterogeneous
atoms [17]. GO and rGO have great applications in
nano composite materials [18, 19], polymer com-posite materials [18], energy storage [19], bio-medical applications [20-22], catalysis [23], and as a surfactant [24].
Cote and co-workers exposed that GO sheets
are amphiphilic with hydrophobic and hydrophilic domains that distributed in the edge to center of
GO sheets [25]. Therefore GO can attach to inter -faces, playing role of surfactant. Understanding
this new property of GO can help to identify the solution properties of GO which can originate new
material assembly and processing method such as
for manufacturing thin film with controllable mi
-cro-structures and segregation GO sheets of differ
-ent sizes. Further, GO can be used as a surfactant
sheet to emulsify organic solvent with water and disperse insoluble materials such as graphite and carbon nanotubes in water, that opens up chances for developing functional hybrid materials of
gra-phene and other π-conjugated systems [25].
This study focuses on comparison between two synthesis procedures of graphene oxide, consid-ering oxidation degree, purity of the synthesized product and evaluation of the two graphite
sourc-es (Daejung and Fluka CO.). As well, the effects of
temperature and mixing in oxidation process have been investigated.
2. Structural Features
Aside from the oxidative mechanisms, the chemi
-cal structure of GO has been the subject of con -siderable debate over the years, even to this day no clear model has been suggested. Considerable efforts have been done successfully to understand
39
B. Kianpour et al. / Journal of Chemical and Petroleum Engineering, 50 (2), Feb. 2017 / 37-45
Ruess, Scholz and Boehm, Nakajima and Matsuo studied on the structure of GO [11]. The lattice-based model was rejected by most of the recent
models, and a non-stoichiometric, amorphous al-ternative have been investigated more. The most
well-known model is the one prepared by He and co-workers. (Fig. 1) used solid state nuclear mag
-netic resonance (NMR) spectroscopy to character -ize the material and structural features [[11, 26].
In addition to other ketone groups, carboxylic acid
groups were present in very low quantities at the periphery of the graphitic sheets [11].
3. Experimental Details
3.1. Materials and reagents
Two graphite sources as powders (Fluka, purity 99.99% and Daejung), sulfuric acid (Merck, 98 wt. %), orthophosphoric acid (Merck, 85 wt. %), potassium permanganate (Merck 99.99%), Hy
-drogen peroxide (Mojallali, 37 wt. %), and sodium nitrate (Merck 99.99%) were prepared and used
without any further treatment.
3.2. Synthesis procedure 3.2.1. First method
This synthesis method was achieved by
chang-ing the improved Hummers’ method. A mixture
of 9:1 concentrated acids, H2SO4/H3PO4 (40.5:4.5 ml) was added to graphite powder (1.0 g). KMnO4
(6.5 g) was gradually added during one hour, at the controlled temperature below 20°C. The reaction mixture was then heated up to 37±2°C and mixed using a mechanical agitator (home made agitator)
for two days. Then the mixture was sonicated (Dig
-ital ultrasonic cleaner, CD 4820, 170 W) for 30 min,
in order to exfoliate graphite oxide to graphene oxide. Thereafter, the reaction mixture was cooled
down to room temperature. Diluted H2O2, a 4:1
(v/v) mixture of de-ionized water/H2O2, was
add-ed drop wise to the graphene oxide in an ice bath in order to remove heat generated from reaction.
Addition of H2O2 was applied to convert remained
3
reduction of graphene oxide, the formed reduced graphene oxide (rGO) is similar to graphene but contains some oxygen and other heterogeneous atoms [17]. GO and rGO have great applications in nano composite materials [18, 19], polymer composite materials [18], energy storage [19], biomedical applications [20-22], catalysis [23], and as a surfactant [24].
Cote and co-workers exposed that GO sheets are amphiphilic with hydrophobic and hydrophilic domains that distributed in the edge to center of GO sheets [25]. Therefore GO can attach to interfaces, playing role of surfactant. Understanding this new property of GO can help to identify the solution properties of GO which can originate new material assembly and processing method such as for manufacturing thin film with controllable
micro-structures and segregation GO sheets of different sizes. Further, GO can be used as a surfactant sheet to emulsify organic solvent with water and disperse insoluble materials such as graphite and carbon nanotubes in water, that opens up chances for developing functional hybrid materials
of graphene and other π-conjugated systems [25].
This study focuses on comparison between two synthesis procedures of graphene oxide, considering oxidation degree, purity of the synthesized product and evaluation of the two graphite sources (Daejung and Fluka CO.). As well, the effects of temperature and mixing in oxidation process have been investigated.
2. Structural features
Aside from the oxidative mechanisms, the chemical structure of GO has been the subject of considerable debate over the years, even to this day no clear model has been suggested. Considerable efforts have been done successfully to understand the structural features of GO. Hofmann and Holst, Ruess, Scholz and Boehm, Nakajima and Matsuo studied on the structure of GO [11]. The lattice-based model was rejected
by most of the recent models, and a non-stoichiometric, amorphous alternative have been investigated more. The most well-known model is the one prepared by He and co-workers. (Fig. 1) used solid state nuclear magnetic resonance (NMR) spectroscopy to characterize the material and structural features [[11, 26]. In addition to other
ketone groups, carboxylic acid groups were present in very low quantities at the periphery of the graphitic sheets [11].
Fig. 1. The proposed structural model of GO [11]
3. Experimental Details 3.1. Materials and reagents
Two graphite sources as powders (Fluka, purity 99.99% and Daejung), sulfuric acid (Merck, 98 wt. %), orthophosphoric acid (Merck, 85 wt. %), potassium permanganate (Merck 99.99%), Hydrogen peroxide (Mojallali, 37 wt. %), and sodium nitrate (Merck 99.99%) were prepared and used without any further treatment.
3.2. Synthesis procedure 3.2.1. First method
This synthesis method was achieved by
changing the improved Hummers’ method.
A mixture of 9:1 concentrated acids, H2SO4/H3PO4 (40.5:4.5 ml) was added to
graphite powder (1.0 g). KMnO4 (6.5 g)
was gradually added during one hour, at the controlled temperature below 20 °C. The reaction mixture was then heated up to 37±2 °C and mixed using a mechanical agitator (home made agitator) for two days. Then the mixture was sonicated (Digital ultrasonic cleaner, CD 4820, 170 W) for 30 min, in order to exfoliate graphite oxide to graphene oxide. Thereafter, the reaction mixture was cooled down to room temperature. Diluted H2O2, a 4:1 (v/v)
Figure 1. The proposed structural model of GO [11].
MnO2 to Mn+2. The best way for treating GO is to
add diluted H2O2 drop wise while controlling the
temperature below 20°C, otherwise there will be greenish yellow solution that is due to reduction of
produced GO and existence of both rGO (reduced GO) and GO in final product. Then the mixture was
centrifuged (7000 rpm) and washed repeatedly with de-ionized water and ethanol (96% v) until the supernatant becomes neutralized to prevent any inorganic ion sedimentation. The obtained solid was vacuum-dried for one day at 50 oC to
ob-tain GO-A.
3.2.2. Second method
Second method was achieved by changing the modified Hummers’ method. For this method, con -centrated H2SO4 (45 mL) was added to a mixture of
graphite powder (1.0 g) and NaNO3 (0.5 g). Same as previous procedure, KMnO4 (6.0 g) was added
slowly in portions controlling temperature below
20°C. Afterward, the mixture was heated up to
37±2°C, and mixed using mechanical agitator for two days. Then the mixture was cooled down to
room temperature and sonicated (170 W). Similar
to previous method, diluted H2O2, a 4:1 (v/v)
mix-ture of deionized water/H2O2, was added drop wise to the graphene oxide in an ice bath. At this time, the
color of the mixture changed to bright yellow. Then the mixture was centrifuged and washed repeat-edly with de ionized water and ethanol similar to the previous procedure. The obtained product was
vacuum-dried for one day at 50°C to obtain GO-B.
3.3. Characterization
X-ray powder diffraction (XRD) patterns were ob
-tained by D8 ADVANCE X-Ray (Bruker AXS) dif
-fractometer (Cu Kα radiation). Fourier transform infrared (FTIR) spectra were carried out using Per
-kin-Elmer spectrometer in frequency range of
800-4000 cm-1. Scanning electron microscope (SEM) images were recorded with Hitachi-S4160 micro
-scope operating at 30 kV. Sample morphologies
were investigated by transmission electron
micros-copy (TEM) images with Philips-cm30 apparatus and acceleration voltage of 150 kV. Raman spec
-troscopy was performed on a Renishaw Raman mi -croscope, with an excitation wavelength at 785 nm.
4. Results and Discussions
4.1. Stages of synthesis
40 B. Kianpour et al. / Journal of Chemical and Petroleum Engineering, 50 (2), Feb. 2017 / 37-45
groups in He’s model, assuming O:H ratio as two, and C:O ratio as one. The stoichiometry for reac-tion, considering full oxidareac-tion, can be considered as below:
3C + 1.5KMnO4 + 0.75H2SO4 → 3COH0.5 +
1.5MnO2 + 0.75K2SO4 (1)
Considering the obtained stoichiometry, 6.5 gram potassium permanganate is necessary to fully oxidize 1 gram of graphite powder. H2SO4
diffuses between layers of graphite to generate
graphite intercalate compound (GIC). In this step,
the layers of graphite are relatively separated and
KMnO4 as oxidizing agent easily diffuses between layers and oxidizes graphite [27]. Structure of IGO is a more regular structure; it may be due to us
-ing phosphoric acid and formation of five-mem -bered cyclic phosphate groups that is formed be-tween phosphoric acid and two vicinal diols on the
graphite basal plane [12, 28]. After completion of reaction, GO is synthesized and MnO2 is produced
during synthesis. Treating with H2O2 is an impor-tant step to remove MnO2 and formation of soluble Mn2+, preventing any inorganic ion sedimentation:
MnO2 + H2O2 + 2H+ → Mn2+ + 2H2O + O2 (2)
Mn2+ can be removed by washing with water or
alcohol in the final step.
4.2. Evaluation of graphite source influence First method was applied for synthesis of GO with
the same operating conditions but two graphite
sources supplied from two companies (Daejung G-D and Fluka G-F). XRD patterns and SEM images
show that the source of graphite is an important
factor to produce pure GO.
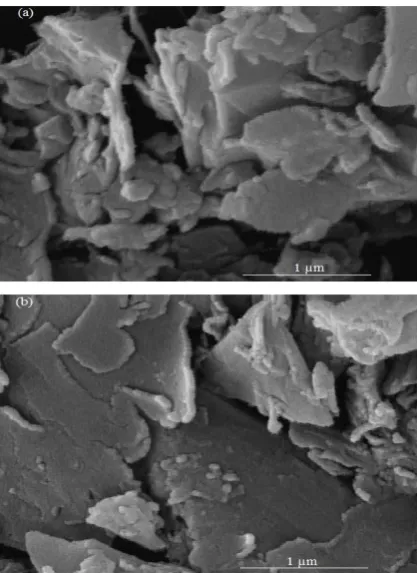
SEM images of G-D and synthesized GO from this source, GO-D, are shown in Fig. 2a and b, respective -ly. Comparison of Fig. 2a and 2b reveals that small changes have occurred on the initial graphite source and it means that the graphite is not completely oxidized and the layers are not well separated.
During the synthesis with this source and after
treating with H2O2, some of the suspended graph-ite material was observed in the final solution. However, the black particles were removed by
1000 rpm centrifugation.
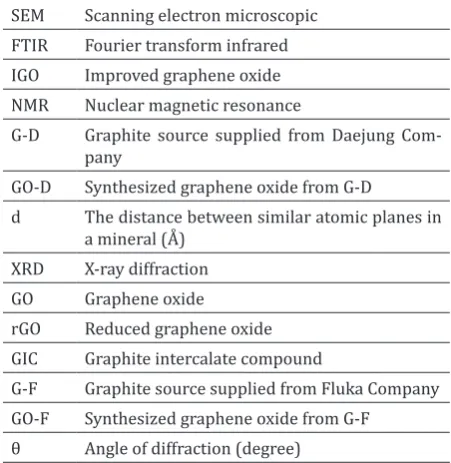
SEM images of Fluka graphite source, G-F and synthesized graphene oxide from this source
(GO-F) are shown in Fig. 3a and b.
Fig. 3b illustrates that the GO layers are laid on each other. According to this image, thickness of sheets is about 66 nm. During GO synthesis, after
treating with H2O2 there were no black particles left in the final solution. Enhanced oxidation of G-F and production of GO-F nano-sheets are obviously
concluded from Fig. 3b against Fig. 2b.
The XRD analysis were applied on sources and
products and they are observed in Fig 4a and b.
XRD patterns of G-D and GO-D are presented in Fig. 4a. In this pattern, a typical peak around 2θ=26°, is
observed due to the graphite phase structure. The
specific peak of GO can be observed at 2θ=10.32° and d-spacing about 8.56 A�.As seen in Fig. 4a, pres -ence of graphite impurity is observed in the
prod-uct of GO-D, as well some other impurities can be observed around 2θ=20° and 2θ=36°. The original G-D graphite has also some impurities and it is ap
-peared in the pattern of GO-D.
Fig. 4b presents XRD patterns of G-F and GO-F. XRD pattern of GO-F shows a peak on 2θ=10.5° with d-spacing about 8.6 A�, and the peak of graphite
is completely eliminated. Therefore it can be
con-cluded that a qualified product of GO can be syn -thesized from an appropriate source of graphite.
4.3. Comparison of two GO synthesis methods
Graphite powder was oxidized to graphene oxides
Figure 2. SEM images, a) Graphite source from Daejung (G-D), b) Synthesized GO from graphite source of Daejung (GO-D).
5
Mn2+ can be removed by washing with water or alcohol in the final step.
4.2. Evaluation of graphite source influence
First method was applied for synthesis of GO with the same operating conditions but two graphite sources supplied from two companies (Daejung G-D and Fluka G-F). XRD patterns and SEM images show that the source of graphite is an important factor to produce pure GO.
SEM images of G-D and synthesized GO from this source, GO-D, are shown in Fig. 2a and b, respectively. Comparison of Fig. 2a and 2b reveals that small changes have occurred on the initial graphite source and it means that the graphite is not completely oxidized and the layers are not well separated.
During the synthesis with this source and after treating with H2O2, some of the
suspended graphite material was observed in the final solution. However, the black particles were removed by 1000 rpm centrifugation.
SEM images of Fluka graphite source, G-F and synthesized graphene oxide from this source (GO-F) are shown in Fig. 3a and b.
Fig. 2. SEM images, a) Graphite source from Daejung (G-D), b) Synthesized GO from graphite
source of Daejung (GO-D)
Fig. 3b illustrates that the GO layers are laid on each other. According to this image, thickness of sheets is about 66 nm. During GO synthesis, after treating with H2O2 there
were no black particles left in the final solution. Enhanced oxidation of G-F and production of GO-F nano-sheets are obviously concluded from Fig. 3b against Fig. 2b.
The XRD analysis were applied on sources and products and they are observed in Fig 4a and b. XRD patterns of G-D and GO-D are presented in Fig. 4a. In this pattern, a typical peak around 2θ=26°, is observed due to the graphite phase structure. The specific peak of GO can be observed at 2θ=10.32° and d-spacing about 8.56 Å.As seen in Fig. 4a, presence of graphite impurity is observed in the product of GO-D, as well some other impurities can be observed around 2θ=20° and 2θ=36°. The original G-D graphite has also some impurities and it is appeared in the pattern of GO-D.
5
Mn2+ can be removed by washing with
water or alcohol in the final step.
4.2. Evaluation of graphite source influence
First method was applied for synthesis of GO with the same operating conditions but two graphite sources supplied from two companies (Daejung G-D and Fluka G-F). XRD patterns and SEM images show that the source of graphite is an important factor to produce pure GO.
SEM images of G-D and synthesized GO from this source, GO-D, are shown in Fig. 2a and b, respectively. Comparison of Fig. 2a and 2b reveals that small changes have occurred on the initial graphite source and it means that the graphite is not completely oxidized and the layers are not well separated.
During the synthesis with this source and after treating with H2O2, some of the
suspended graphite material was observed in the final solution. However, the black particles were removed by 1000 rpm centrifugation.
SEM images of Fluka graphite source, G-F and synthesized graphene oxide from this source (GO-F) are shown in Fig. 3a and b.
Fig. 2. SEM images, a) Graphite source from Daejung (G-D), b) Synthesized GO from graphite
source of Daejung (GO-D)
Fig. 3b illustrates that the GO layers are laid on each other. According to this image, thickness of sheets is about 66 nm. During GO synthesis, after treating with H2O2 there
were no black particles left in the final solution. Enhanced oxidation of G-F and production of GO-F nano-sheets are obviously concluded from Fig. 3b against Fig. 2b.
41
B. Kianpour et al. / Journal of Chemical and Petroleum Engineering, 50 (2), Feb. 2017 / 37-45
5
Mn2+ can be removed by washing with
water or alcohol in the final step.
4.2. Evaluation of graphite source influence
First method was applied for synthesis of GO with the same operating conditions but two graphite sources supplied from two companies (Daejung G-D and Fluka G-F). XRD patterns and SEM images show that the source of graphite is an important factor to produce pure GO.
SEM images of G-D and synthesized GO from this source, GO-D, are shown in Fig. 2a and b, respectively. Comparison of Fig. 2a and 2b reveals that small changes have occurred on the initial graphite source and it means that the graphite is not completely oxidized and the layers are not well separated.
During the synthesis with this source and after treating with H2O2, some of the
suspended graphite material was observed in the final solution. However, the black particles were removed by 1000 rpm centrifugation.
SEM images of Fluka graphite source, G-F and synthesized graphene oxide from this source (GO-F) are shown in Fig. 3a and b.
Fig. 2. SEM images, a) Graphite source from Daejung (G-D), b) Synthesized GO from graphite
source of Daejung (GO-D)
Fig. 3b illustrates that the GO layers are laid on each other. According to this image, thickness of sheets is about 66 nm. During GO synthesis, after treating with H2O2 there
were no black particles left in the final solution. Enhanced oxidation of G-F and production of GO-F nano-sheets are obviously concluded from Fig. 3b against Fig. 2b.
The XRD analysis were applied on sources and products and they are observed in Fig 4a and b. XRD patterns of G-D and GO-D are presented in Fig. 4a. In this pattern, a typical peak around 2θ=26°, is observed due to the graphite phase structure. The specific peak of GO can be observed at 2θ=10.32° and d-spacing about 8.56 Å.As seen in Fig. 4a, presence of graphite impurity is observed in the product of GO-D, as well some other impurities can be observed around 2θ=20° and 2θ=36°. The original G-D graphite has also some impurities and it is appeared in the pattern of GO-D.
6 Fig. 3. SEM images, a) Graphite source of Fluka
(G-F), b) Synthesized GO from graphite source of Fluka (GO-F)
Fig. 4b presents XRD patterns of G-F and GO-F. XRD pattern of GO-F shows a peak on 2θ=10.5° with d-spacing about 8.6 Å, and the peak of graphite is completely eliminated. Therefore it can be concluded that a qualified product of GO can be synthesized from an appropriate source of graphite.
4.3. Comparison of two GO synthesis methods
Graphite powder was oxidized to graphene oxides using the two mentioned methods. XRD analysis was performed to figure out the resulting materials. The XRD spectra of GO-A and GO-B are shown in Fig. 5. For GO, the interlayer spacing (d) of the product is proportional to the degree of oxidation [12, 16]. As shown in Fig. 5, there are two diffraction peaks for GO-B at 2θ=11.7° (d=7.5 Å) and 2θ=25.5° (d=3.4 Å). The weaker peak with d=3.4 Å corresponds to the normal graphite spacing. This peak reveals that graphite was remained in final product.
Fig. 4. X-ray diffractogram, a) G-D and GO-D, b) G-F and GO-F.
The stronger peak with d=7.5 Å corresponds to the typical diffraction peak of GO. On the other hand, there are just a diffraction peak for GO-A at 2θ=10.5° (d=8.6 Å) that corresponds to the typical diffraction peak of GO (Fig. 5).
Fig. 5. X-ray diffractogram of GO-A and GO-B
Compared with GO-B, the interlayer spacing of GO-A is larger, implying more extensive oxidation [29]. As well, diffraction peak of GO-A is shifted to left in comparison to GO-B, because of more
0 20 40 60 80 100 120
5 10 15 20 25 30 35 40
Intens
ity
2θ(deg.)
Graphene Oxide
Daejung Graphite (a)
0 20 40 60 80 100 120
5 10 15 20 25 30 35 40
Intens
ity
2θ(deg.)
Graphene Oxide
Fluka Graphite (b)
Figure 3. SEM images, a) Graphite source of Fluka (G-F), b) Synthesized GO from graphite source of Fluka (GO-F).
using the two mentioned methods. XRD analysis was performed to figure out the resulting materi
-als. The XRD spectra of GO-A and GO-B are shown in Fig. 5. For GO, the interlayer spacing (d) of the
product is proportional to the degree of oxidation
[12, 16]. As shown in Fig. 5, there are two diffrac
-tion peaks for GO-B at 2θ=11.7° (d=7.5 A�) and 2θ=25.5° (d=3.4 A�). The weaker peak with d=3.4 A�
corresponds to the normal graphite spacing. This
peak reveals that graphite was remained in final
product.
The stronger peak with d=7.5 A� corresponds to the typical diffraction peak of GO. On the other hand, there are just a diffraction peak for GO-A at 2θ=10.5° (d=8.6 A�) that corresponds to the typical diffraction peak of GO (Fig. 5).
Compared with GO-B, the interlayer spacing of GO-A is larger, implying more extensive oxidation [29]. As well, diffraction peak of GO-A is shifted to left in comparison to GO-B, because of more oxida -tion that it is obvious in Fig 5.
4.4. Structural characterization of GO-A
XRD analysis and SEM images clarified effective
6 Fig. 3. SEM images, a) Graphite source of Fluka
(G-F), b) Synthesized GO from graphite source of Fluka (GO-F)
Fig. 4b presents XRD patterns of G-F and GO-F. XRD pattern of GO-F shows a peak
on 2θ=10.5° with d-spacing about 8.6 Å, and the peak of graphite is completely eliminated. Therefore it can be concluded that a qualified product of GO can be synthesized from an appropriate source of graphite.
4.3. Comparison of two GO synthesis methods
Graphite powder was oxidized to graphene oxides using the two mentioned methods. XRD analysis was performed to figure out the resulting materials. The XRD spectra of GO-A and GO-B are shown in Fig. 5. For GO, the interlayer spacing (d) of the product is proportional to the degree of oxidation [12, 16]. As shown in Fig. 5, there are two diffraction peaks for GO-B at
2θ=11.7° (d=7.5 Å) and 2θ=25.5° (d=3.4
Å). The weaker peak with d=3.4 Å corresponds to the normal graphite spacing. This peak reveals that graphite was remained in final product.
Fig. 4. X-ray diffractogram, a) G-D and GO-D, b) G-F and GO-F.
The stronger peak with d=7.5 Å corresponds to the typical diffraction peak of GO. On the other hand, there are just a diffraction peak for GO-A at 2θ=10.5°
(d=8.6 Å) that corresponds to the typical diffraction peak of GO (Fig. 5).
Fig. 5. X-ray diffractogram of GO-A and GO-B
Compared with GO-B, the interlayer spacing of GO-A is larger, implying more extensive oxidation [29]. As well, diffraction peak of GO-A is shifted to left in comparison to GO-B, because of more
0 20 40 60 80 100 120
5 10 15 20 25 30 35 40
Intens
ity
2θ(deg.)
Graphene Oxide
Daejung Graphite (a)
0 20 40 60 80 100 120
5 10 15 20 25 30 35 40
Intens
ity
2θ(deg.)
Graphene Oxide
Fluka Graphite (b)
Figure 4. X-ray diffractogram, a) G-D and GO-D, b) G-F and GO-F.
graphite source, synthesis protocol and operating
conditions. Synthesized GO-A using Fluka graphite
source and operating conditions was characterized
with complementary analysis such as Raman spec
-troscopy, FTIR, and TEM. Raman spectroscopy is
widely used to characterize the structural and elec-tronic properties of carbon-based materials. The
Raman spectrum of GO-A is shown in Fig. 6. The main features in the Raman spectra of graphitic carbon-based materials are the G and D peaks and their overtones [30]. The G peak at 1581 cm-1, and the D peak at 1335 cm-1 are recorded (Fig. 6). The G peak corresponds to the bond stretching of sp2 carbon pairs in both rings and chains. The D peak
represents the breathing mode of aromatic rings
arising due to the defect in the sample. The D peak
intensity is therefore often used as a measure tool for the degree of disorder [31, 32]. Higher disorder
in graphite leads to a broad D-band of higher rela
-tive intensity compound to that of the G-band [33]. The ID/IG is a measure of disorder. As a result, ID/
IG>1 shows a great disorder in aromatic structure
42 B. Kianpour et al. / Journal of Chemical and Petroleum Engineering, 50 (2), Feb. 2017 / 37-45
FTIR spectrum has been recorded in the wave
number range of 800-4000 cm-1, to further
inves-tigation of graphene oxide chemical structure (Fig.
7). The broad peak at 3425 cm-1 and the sharp peak at 1629 cm-1 are attributed to the stretching
and bending vibration of OH groups of water
mol-6 Fig. 3. SEM images, a) Graphite source of Fluka
(G-F), b) Synthesized GO from graphite source of Fluka (GO-F)
Fig. 4b presents XRD patterns of G-F and GO-F. XRD pattern of GO-F shows a peak on 2θ=10.5° with d-spacing about 8.6 Å, and the peak of graphite is completely eliminated. Therefore it can be concluded that a qualified product of GO can be synthesized from an appropriate source of graphite.
4.3. Comparison of two GO synthesis methods
Graphite powder was oxidized to graphene oxides using the two mentioned methods. XRD analysis was performed to figure out the resulting materials. The XRD spectra of GO-A and GO-B are shown in Fig. 5. For GO, the interlayer spacing (d) of the product is proportional to the degree of oxidation [12, 16]. As shown in Fig. 5, there are two diffraction peaks for GO-B at 2θ=11.7° (d=7.5 Å) and 2θ=25.5° (d=3.4 Å). The weaker peak with d=3.4 Å corresponds to the normal graphite spacing. This peak reveals that graphite was remained in final product.
Fig. 4. X-ray diffractogram, a) G-D and GO-D, b) G-F and GO-F.
The stronger peak with d=7.5 Å corresponds to the typical diffraction peak of GO. On the other hand, there are just a diffraction peak for GO-A at 2θ=10.5° (d=8.6 Å) that corresponds to the typical diffraction peak of GO (Fig. 5).
Fig. 5. X-ray diffractogram of GO-A and GO-B
Compared with GO-B, the interlayer spacing of GO-A is larger, implying more extensive oxidation [29]. As well, diffraction peak of GO-A is shifted to left in comparison to GO-B, because of more
0 20 40 60 80 100 120
5 10 15 20 25 30 35 40
Intens
ity
2θ(deg.)
Graphene Oxide
Daejung Graphite (a)
0 20 40 60 80 100 120
5 10 15 20 25 30 35 40
Intens
ity
2θ(deg.)
Graphene Oxide
Fluka Graphite (b)
Figure 5. X-ray diffractogram of GO-A and GO-B.
ecules adsorbed on graphene oxide. The
absorp-tion peak at 1092 cm-1 can be attributed to epoxy groups of GO (Fig. 7).
The absorption peaks at 1732 cm-1 and 1397
cm-1 are attributed to stretching vibration of C=O and C‒OH deformation of carboxylic acid and car -bonyl groups presented at the edges of graphene oxide (Fig. 7). Therefore, oxygen functional groups
of graphene oxide investigated by FTIR spectrum,
showed that graphene oxide has strong
hydro-philic property [30, 34]. TEM image of the GO-A is shown in Fig. 8. Sheets of graphene oxide are
clearly shown in this image.
4.5. Effect of temperature
To study the effect of temperature, GO was pre
-pared using first method at room temperature. At the instant of adding KMnO4 in solution, the
color was converted to green, because of one step
reduction of permanganate (MnO4-) to manganite (MnO4-2) on the surface of graphite. The process
of reduction in presence of oxidant was carried
out. After four days, the color of the mixture was changed to brown because of formation of MnO2.
Hence, increasing the reaction temperature is use-ful for rising rate of reaction. The effect of high
temperature is also significant towards GO synthe -sis, heating up the mixture causes reduction of gra-phene oxide. Therefore, temperature of the media
should be adjusted at a specific level. In this work,
the temperature was set at 37±2°C.
Addition of H2O2 was required to reduce MnO2 to colorless Mn+2, whereas during addition of H
2O2
the temperature of solution was increased and the color was changed to greenish yellow, which means that the reverse reaction (reduction of
gra-phene oxide) is taking place and some of MnO2 is converted to MnO4-2. Thus, temperature must be
controlled bellow 20°C.
4.6. Effect of mixing
To study the effect of mixing, GO-A was prepared using magnetic stirrer (Heidolph, D-91126 schwa -bach). By adding potassium permanganate after a while, viscosity of the reaction mixture began to
increase. So that, magnet stirrer was not able to mix the whole mixture uniformly. After three days, color of the mixture was changed to brown. Af -ter graphite oxidation process, H2O2 solution was added to the mixture. At this time, the color of the
mixture was changed to greenish yellow. This in-dicates that un-oxidized graphite and oxidant was remained in reaction media because of inappropri-ate and non-uniform mixing. It can be concluded that uniform mixing with appropriate round per 7
oxidation that it is obvious in Fig 5.
4.4. Structural characterization of GO-A
XRD analysis and SEM images clarified effective graphite source, synthesis protocol and operating conditions. Synthesized GO-A using Fluka graphite source and operating conditionswas characterized with complementary analysis such as Raman spectroscopy, FTIR, and TEM. Raman spectroscopy is widely used to characterize the structural and electronic properties of
carbon-based materials. The Raman
spectrum of GO-A is shown in Fig. 6. The main features in the Raman spectra of graphitic carbon-based materials are the G and D peaks and their overtones [30]. The G peak at 1581 cm-1, and the D peak at
1335 cm-1 are recorded (Fig. 6). The G peak corresponds to the bond stretching of sp2
carbon pairs in both rings and chains. The D peak represents the breathing mode of aromatic rings arising due to the defect in the sample. The D peak intensity is therefore often used as a measure tool for the degree of disorder [31, 32]. Higher disorder in graphite leads to a broad D-band of higher relative intensity compound to that of the G-band [33]. The ID/IG is a
measure of disorder. As a result, ID/IG>1
shows a great disorder in aromatic structure because of attachment of functional groups on the carbon [29].
Fig. 6. Raman spectra of GO-A
FTIR spectrum has been recorded in the
wave number range of 800-4000 cm-1, to further investigation of graphene oxide
chemical structure (Fig. 7). The broad peak at 3425 cm-1 and the sharp peak at 1629 cm
-1 are attributed to the stretching and
bending vibration of OH groups of water molecules adsorbed on graphene oxide. The absorption peak at 1092 cm-1 can be
attributed to epoxy groups of GO (Fig. 7).
Fig. 7. FTIR spectra of GO-A
The absorption peaks at 1732 cm-1 and 1397 cm-1 are attributed to stretching
vibration of C=O and C‒OH deformation of
carboxylic acid and carbonyl groups presented at the edges of graphene oxide (Fig. 7). Therefore, oxygen functional groups of graphene oxide investigated by FTIR spectrum, showed that graphene oxide has strong hydrophilic property [30, 34]. TEM image of the GO-A is shown in Fig. 8. Sheets of graphene oxide are clearly shown in this image.
Fig. 8. TEM image of GO-A
4.5. Effect of temperature 550 850 1150 1450 1750 2050 2350
R am an i nten si ty
Wave number (cm-1)
1335
1581
ID/IG= 1.37
800 1200 1600 2000 2400 2800 3200 3600 4000 Inten si ty
Wave number (cm-1)
1092
1629
3425
1397 1732
Figure 6. Raman spectra of GO-A.
7
oxidation that it is obvious in Fig 5.
4.4. Structural characterization of GO-A
XRD analysis and SEM images clarified effective graphite source, synthesis protocol and operating conditions. Synthesized GO-A using Fluka graphite source and operating conditionswas characterized with complementary analysis such as Raman spectroscopy, FTIR, and TEM. Raman spectroscopy is widely used to characterize the structural and electronic properties of
carbon-based materials. The Raman
spectrum of GO-A is shown in Fig. 6. The main features in the Raman spectra of graphitic carbon-based materials are the G and D peaks and their overtones [30]. The G peak at 1581 cm-1, and the D peak at
1335 cm-1 are recorded (Fig. 6). The G peak corresponds to the bond stretching of sp2
carbon pairs in both rings and chains. The D peak represents the breathing mode of aromatic rings arising due to the defect in the sample. The D peak intensity is therefore often used as a measure tool for the degree of disorder [31, 32]. Higher disorder in graphite leads to a broad D-band of higher relative intensity compound to that of the G-band [33]. The ID/IG is a
measure of disorder. As a result, ID/IG>1
shows a great disorder in aromatic structure because of attachment of functional groups on the carbon [29].
Fig. 6. Raman spectra of GO-A
FTIR spectrum has been recorded in the
wave number range of 800-4000 cm-1, to further investigation of graphene oxide
chemical structure (Fig. 7). The broad peak at 3425 cm-1 and the sharp peak at 1629 cm
-1 are attributed to the stretching and
bending vibration of OH groups of water molecules adsorbed on graphene oxide. The absorption peak at 1092 cm-1 can be
attributed to epoxy groups of GO (Fig. 7).
Fig. 7. FTIR spectra of GO-A
The absorption peaks at 1732 cm-1 and 1397 cm-1 are attributed to stretching
vibration of C=O and C‒OH deformation of
carboxylic acid and carbonyl groups presented at the edges of graphene oxide (Fig. 7). Therefore, oxygen functional groups of graphene oxide investigated by FTIR spectrum, showed that graphene oxide has strong hydrophilic property [30, 34]. TEM image of the GO-A is shown in Fig. 8. Sheets of graphene oxide are clearly shown in this image.
Fig. 8. TEM image of GO-A
4.5. Effect of temperature 550 850 1150 1450 1750 2050 2350
R am an i nten si ty
Wave number (cm-1)
1335
1581
ID/IG= 1.37
800 1200 1600 2000 2400 2800 3200 3600 4000 Inten si ty
Wave number (cm-1)
1092
1629
3425
1397 1732
43
B. Kianpour et al. / Journal of Chemical and Petroleum Engineering, 50 (2), Feb. 2017 / 37-45
minute is one of the prominent points in synthesis of graphene oxide.
5. Conclusions
In this study, the graphene oxide was prepared by oxidizing graphite powder using two methods
based on modified Hummers and Improved meth
-ods. The XRD spectra shows that interlayer spac
-ing of GO-A (d=8.6 A�) is higher than GO-B (d=7.5 A�). Therefore oxidation level of GO-A is more than GO-B. As well, diffraction peak of graphite (2θ=25.5°) was revealed for GO-B, but this peak was disappeared for GO-A. It can be concluded that GO-A is more pure than GO-B. Hence, first method
can be considered as promising method for
syn-thesis of graphene oxide. The Raman spectrum of GO-A shows that ID is higher than IG. Therefore,
a great defect has been created in aromatic
struc-ture of GO-A.
The FTIR spectrum shows that functional groups
(hydroxyl, carboxyl, epoxy, and carbonyl) have been
created in GO-A. Additionally, source of graphite is an important factor for synthesis of pure GO. Some
of graphite sources that have impurities and ashes would not allow the exfoliation and complete oxida-tion of graphite layers.
According to the preformed analysis, XRD pat
-terns and SEM images, although un-reacted graph -ite was separated by centrifugation, some of the un-reacted materials were remained in the
prod-uct. As well treating with H2O2 is an important
step. The best way for treating is adding diluted H2O2 drop wise and controlling temperature below 20°C. In this way color of GO would be bright yel
-low that shows existence of GO. While in any other
treating procedures the color of solution is
green-ish yellow that shows reduction of GO and exis
-tence of both GO and reduced GO. In addition, the
results show that temperature and mixing are two important factors for synthesis of graphene oxide.
Nomenclature
SEM Scanning electron microscopic FTIR Fourier transform infrared IGO Improved graphene oxide NMR Nuclear magnetic resonance
G-D Graphite source supplied from Daejung Com -pany
GO-D Synthesized graphene oxide from G-D
d The distance between similar atomic planes in a mineral (A�)
XRD X-ray diffraction
GO Graphene oxide
rGO Reduced graphene oxide GIC Graphite intercalate compound
G-F Graphite source supplied from Fluka Company GO-F Synthesized graphene oxide from G-F
θ Angle of diffraction (degree) 7
oxidation that it is obvious in Fig 5.
4.4. Structural characterization of GO-A
XRD analysis and SEM images clarified effective graphite source, synthesis protocol and operating conditions. Synthesized GO-A using Fluka graphite source and operating conditionswas characterized with complementary analysis such as Raman spectroscopy, FTIR, and TEM. Raman spectroscopy is widely used to characterize the structural and electronic properties of
carbon-based materials. The Raman
spectrum of GO-A is shown in Fig. 6. The main features in the Raman spectra of graphitic carbon-based materials are the G and D peaks and their overtones [30]. The G peak at 1581 cm-1, and the D peak at
1335 cm-1 are recorded (Fig. 6). The G peak
corresponds to the bond stretching of sp2 carbon pairs in both rings and chains. The D peak represents the breathing mode of aromatic rings arising due to the defect in the sample. The D peak intensity is therefore often used as a measure tool for the degree of disorder [31, 32]. Higher disorder in graphite leads to a broad D-band of higher relative intensity compound to that of the G-band [33]. The ID/IG is a
measure of disorder. As a result, ID/IG>1
shows a great disorder in aromatic structure because of attachment of functional groups on the carbon [29].
Fig. 6. Raman spectra of GO-A
FTIR spectrum has been recorded in the
wave number range of 800-4000 cm-1, to
further investigation of graphene oxide
chemical structure (Fig. 7). The broad peak at 3425 cm-1 and the sharp peak at 1629 cm -1 are attributed to the stretching and
bending vibration of OH groups of water molecules adsorbed on graphene oxide. The absorption peak at 1092 cm-1 can be attributed to epoxy groups of GO (Fig. 7).
Fig. 7. FTIR spectra of GO-A
The absorption peaks at 1732 cm-1 and
1397 cm-1 are attributed to stretching
vibration of C=O and C‒OH deformation of
carboxylic acid and carbonyl groups presented at the edges of graphene oxide (Fig. 7). Therefore, oxygen functional groups of graphene oxide investigated by FTIR spectrum, showed that graphene oxide has strong hydrophilic property [30, 34]. TEM image of the GO-A is shown in Fig. 8. Sheets of graphene oxide are clearly shown in this image.
Fig. 8. TEM image of GO-A
4.5. Effect of temperature 550 850 1150 1450 1750 2050 2350
R
am
an i
nten
si
ty
Wave number (cm-1)
1335
1581
ID/IG= 1.37
800 1200 1600 2000 2400 2800 3200 3600 4000
Inten
si
ty
Wave number (cm-1)
1092
1629
3425
1397 1732
Figure 8. TEM image of GO-A.
References
1. Moktadir, Z. (2014). “Graphene nanoelectrome-chanics (NEMS), in Graphene: properties, prepa-ration, characterisation and devices, First
edi-tion. London, GB, Woodhead , pp. 341-358.
2. Geim, A.K. and Novoselov, K.S. (2007). “The
rise of grapheme.” Nature Materials, Vol. 6, No.
3, pp. 183-191.
3. Stankovich, S., Dikin, D.A., Dommett, G. H., Kohlhaas, K.M., Zimney, E.J. (2006).
“Graphene-based composite materials.” Nature, Vol. 442,
No. 7100, pp. 282-286.
4. Geim, A.K. (2009). “Graphene: status and pros -pects.” Science, Vol. 324, No. 5934, pp.
1530-1534.
5. Novoselov, K.S., Geim, A.K., Morozov, S.V., Ji
-ang, D., Zh-ang, Y., Dubonos, S.V., Grigorieva, I.V. and Firsov, A.A. (2004). “ Electric field effect in atomically thin carbon films.” Science, Vol. 306,
44 B. Kianpour et al. / Journal of Chemical and Petroleum Engineering, 50 (2), Feb. 2017 / 37-45
6. Kim, K.S., Zhao, Y., Jang, H, Lee, S.Y., Kim, J.M.
(2009). “Large-scale pattern growth of
gra-phene films for stretchable transparent elec -trodes.” Nature, Vol. 457, No. 7230, pp. 706-710.
7. Kovtyukhova, N.I., Ollivier, P.J., Martin, B.R., Mallouk, T.E., Chizhik, S.A. (1999). “Layer-by-layer assembly of ultrathin composite films
from micron-sized graphite oxide sheets and polycations.” Chemistry of Materials, Vol. 11,
No. 3, pp. 771-778.
8. Wang, Y., Xie, L., Sha, J., Ma, Y., Han, J. (2011).
“Preparation and chemical reduction of lauryl-amine-intercalated graphite oxide.” Materials Science, Vol. 46, No. 10, pp. 3611-3621.
9. Yoon, S., and In, I. (2011). “Role of poly (N-vi -nyl-2-pyrrolidone) as stabilizer for dispersion of graphene via hydrophobic interaction.” Ma-terials Science, Vol. 46, No. 5, pp. 1316-1321.
10. Liu, J., Cui, L., and Losic, D. (2013). “Graphene
and graphene oxide as new nanocarriers for drug delivery applications.” Acta Biomateria-lia, Vol. 9, No. 12, pp. 9243-9257.
11. Dreyer, D.R., Park, S., Bielawski, C.W. and Ruoff, R.S. (2010). “The chemistry of graphene ox -ide.” Chemical Society Reviews, Vol. 39, No. 1,
pp. 228-240.
12. Marcano, D.C., Kosynkin, D.V., Berlin, J.M., Sin
-itskii, A., Sun, Z. (2010). “Improved synthesis
of graphene oxide.” ACS Nano, Vol. 4, No. 8, pp.
4806-4814.
13. Stankovich, S., Piner, R.D., Chen, X., Wu, N., Nguyen, S.T., and Ruoff, R.S. (2006). “Stable
aqueous dispersions of graphitic nanoplate-lets via the reduction of exfoliated graphite ox-ide in the presence of poly (sodium 4-styrene-sulfonate).” Journal of Materials Chemistry, Vol.
16, No. 2, pp. 155-158.
14. Brodie, B.C. (1859). “On the Atomic Weight of Graphite.” Philosophical Transactions of the Royal Society of London, Vol. 149, pp. 249-259.
15. Staudenmaier, L. (1898). “Verfahren zur Dar-stel
-lung der Graphitsaure.” Berichte der Deutschen Chemischen Gesellschaft, Vol. 31, No. 2, pp.
1481-1487.
16. Hummers, W.S. and Offeman, R.E. (1958). “Prep
-aration of Graphitic Oxide.” American Chemical Society, Vol. 80, No. 6, pp. 1339-1339.
17. Chua, C.K. and Pumera, M. (2014). “Chemical
reduction of graphene oxide: a synthetic chem-istry viewpoin.” Chemical Society Reviews, Vol.
43, No. 1, pp. 291-312.
18. Huang, X., Qi, X., Boey, F. and Zhang, H. (2012). “Graphene-based composites.” Chemical Soci-ety Reviews, Vol. 41, No. 2, pp. 666-686.
19. Lightcap, I.V. and Kamat, P.V. (2012). “Gra -phitic design: prospects of graphene-based nanocomposites for solar energy conversion, storage, and sensing.” Accounts of Chemical Re-search, Vol. 46, No. 10, pp. 2235-2243.
20. Sun, X., Liu, Z., Welsher, K., Robinson, J.T., Good
-win, A., Zaric, S. and Dai, H. (2008).
“Nano-graphene oxide for cellular imaging and drug delivery.” Nano Research, Vol. 1, No. 3, pp.
203-212.
21. Chung, C., Kim, Y.K., Shin, D., Ryoo, S.R., Hong, B.H., Min, D.H. (2013). “Biomedical applica -tions of graphene and graphene oxide.” Ac-counts of Chemical Research, Vol. 46, No. 10,
pp. 2211-2224.
22. Wang, Y., Li, Z., Wang, J., Li, J. and Lin, Y. (2011). “Graphene and graphene oxide: biofunction -alization and applications in biotechnology.”
Trends in Biotechnology, Vol. 29 , No. 5, pp.
205-212.
23. Pyun, J. (2011).”Graphene oxide as catalyst:
application of carbon materials beyond nano-technology.” Angewandte Chemie International Edition, Vol. 50, No. 1, pp. 46-48.
24. Kim, J., Cote, L. J., Kim, F., Yuan, W., Shull, K. R., and Huang, J. (2010). “Graphene oxide sheets
at interfaces.” American Chemical Society, Vol.
132, No. 23, pp. 8180-8186.
25. Cote, L.J., Kim, J., Tung, V.C., Luo, J., Kim, F., Huang, J. (2010). “Graphene oxide as surfac -tant sheets.” Pure and Applied Chemistry, Vol.
83, No. 1, pp. 95-110.
26. He, H., Riedl, T., Lerf, A. and Klinowski, J. (1996). “Solid-state NMR studies of the struc -ture of graphite oxide.” Physical Chemistry, Vol.
45
B. Kianpour et al. / Journal of Chemical and Petroleum Engineering, 50 (2), Feb. 2017 / 37-45
27. Dimiev, A.M. and Tour, J.M. (2014). “Mecha -nism of graphene oxide formation.” ACS Nano,
Vol. 8, No. 3, pp. 3060-3068.
28. Higginbotham, A., Kosynkin, D., Sinitskii, A., Sun, Z., Tour, J.M. (2010). “Lower- defect gra -phene oxide nanoribbons from multiwalled catbon nanotubes.” ACS Nano, Vol. 4, No. 4, pp.
2059-2069.
29. Shi, C., Chen, L., Xu, Z., Jiao, Y., Li, Y. (2012). “Monitoring influence of chemical prepara -tion procedure on the structure of graphene nanosheets.” Physica E: Low-dimensional Sys-tems and Nanostructures, Vol. 44, No. 7-8, pp.
1420-1424.
30. Shahriary, L. and Athawale, A.A. (2014). “Gra
-phene oxide synthesized by using modified
hummers approach.” Renew. Energy and Env. Engg, Vol. 2, No. 1, pp. 58-63.
31. Tuinstra, F. and Koenig, J.L. (1970). “Raman
spectrum of graphite.” Chemical Physics, Vol.
53, No. 3, pp. 1126-1130.
32. Ferrari, A.C. and Robertson, J. (2000). “Inter
-pretation of Raman spectra of disordered and
amorphous carbon.” Physical Review B, Vol. 61,
No. 20, pp. 14095-14107.
33. Kudin, K.N., Ozbas, B., Schniepp, H.C., Prud’Ho-mme, R.K., Aksay, I.A. and Car, R. (2008). “Ra -man spectra of graphite oxide and functional-ized graphene sheets.” Nano Letters, Vol. 8, No.
1, pp. 36-41.
34. Guo, H., Wang, X., Qian, Q., Wang, F., Xia, X. (2009). “A green approach to the synthesis of
graphene nanosheets.” ACS Nano, Vol. 3, No. 9,
![Figure 1.Fig. 1. The proposed structural model of GO [11] The proposed structural model of GO [11].](https://thumb-us.123doks.com/thumbv2/123dok_us/8948782.1858150/3.637.85.297.677.762/figure-fig-proposed-structural-model-proposed-structural-model.webp)