Turkish Journal of Fisheries and Aquatic Sciences 18: 705-716 (2018)
www.trjfas.org ISSN 1303-2712 DOI: 10.4194/1303-2712-v18_5_06
RESEARCH PAPER
© Published by Central Fisheries Research Institute (CFRI) Trabzon, Turkey in cooperation w ith Japan International Cooperation Agency (JICA), Japan
Numerical Study on the Flow Field Around a Fish Farm in Tidal Current
Introduction
China has become the b iggest exporter of aquatic product in the world owing to the rapid e xpansion in its fish production particularly fro m aquaculture (FAO, 2014). To ensure a steady supply of aquatic products, efforts must be paid to aquaculture in fish farm. The environmental conditions inside and around the fish fa rm are important for the we lfare and development of the fish. The optimal loca lity fo r fish farming should provide optimal water quality for the caged fish, ensure s ufficient water e xchange through the fish farm and minimize environ mental impacts, such as the erosion of the bottom sediment. There fore, shifting the aquaculture in fish fa rm fro m inner bay to offshore is becoming inevitable trends. When deployed in offshore, the fish farm tends to be e xposed to the tidal current instead of the constant current (Corne jo, Sepúlveda, Gut iérre z, & Olivares, 2014; Wu et al., 2014; Xu, Hou, Dong, Zhao, & Guo, 2017). Thus, the study on tidal currents through the net cages is of great importance.
Similar to other ma rine structures, the netting of the net cage in fish farm suffe rs fro m the effects of biofouling in the open sea (Figure 1). Biofouling, the accumulat ion of ma rine organis ms, is prone to lead ing
to rapid occlusion of the netting mesh (Braithwa ite, Carrascosa, & McEvoy, 2007), which may causes the following disadvantages: i) biofouling communit ies acting as disease reservoirs can increase disease risk to the farmed fish (Fitridge, De mpster, Guenther, & de Nys, 2012), ii) the hydrodynamic forces acting on the net cage are dra matica lly increased, which increases the risk of structural fa ilure and fat igue damage of the net cage (Klebert, Lader, Gansel, & Oppedal, 2013), iii) the biofouled netting is easily deformed in currents and thus causes negative effect on the effective volu me for the fa rmed fish and iv) the attenuation of currents through the net cage is increased, which decreases the water e xchange and oxygen supply inside the net cage. The water flow inside and around the fish farm is critica l fo r effic ient and sustainable aquaculture production. Thus, the investigation on flow through a fish farm in t idal current has great significance for aquaculture.
A large nu mber of researches have been worked on determining the flow fie ld inside and around the net cages. Aarsnes, Rudi, and Lø land (1990) conducted a series of physical-model e xpe riments to investigate the flow ve locity in net cages as well as the drag force and the deformation of the netting. Johansson, Juell, Oppedal, St iansen, and Ruohonen
Chun-Wei Bi
1, Tiao-Jian Xu
1,*
1
Dalian University of Technology, State Key Laboratory of Coastal and Offshore Engineering, Dalian 116024, China.
* Corresponding Author: Tel.: +86.411 84708300; Fax: +86.411 84671713; E-mail: [email protected]
Received 12 July 2017 Accepted 18 September 2017
Abstract
The netting of the fish farm, with biofouling or not, was simulated using the porous-media fluid model. The porous coefficients for both clean and biofouled netting were calculated from the drag and lift forces that acts on corresponding clean or biofouled plane net, consequently the relationship between the porous coefficients and the features of the netting as well as the biofouling is established. In this study, both constant and tidal currents through a fish farm, consisting of 2×4 full-scale net cages, were investigated numerically. Effects of cage height, incidence angle of the current and level of biofouling on the netting on the flow field in vicinity region of the fish farm were presented and discussed. Compared with constant current, tidal current produces different flow pattern downstream from the fish farm. Overall, the height of the wake region downstream from the fish farm increases with increasing cage height. The attenuation in flow velocity both inside the net cage and in the wake region increases as the level of biofouling increases. With respect to the incidence angle of the tidal current, the optimal orientation of the fish farm can be determined in certain tidal current from an ecological perspective.
706
(2007) found 33~64% attenuation in flow ve locity by fie ld measure ments at four fish farms. Harend za, Visscher, Gansel, and Pettersen (2008) conducted laboratory e xperiments with PIV (partic le image velocimetry) technique to study flow through the net-cage models at varioius inclination angles. Rasmussen, Patursson, and Simonsen (2015) studied the wake structure of a fish farm in t idal current using the acoustic doppler current profiler (ADCP) and the minimu m water e xchange velocity was found. A mong the numerical works, Shim, Klebert, and Fredheim (2009) presented the flo w fie ld inside and behind a net cage with various porosities using the porous -ju mp med ia mode l. Zhao et al. (2013) p roposed a numerical model based on a porous -media fluid model and the flow fie lds around tandem net cages were simu lated. Cornejo et al. (2014) nu merically studied the flow-ve locity distribution downstream fro m a salmon fa rm in semidiu rnal current. Chen and Christensen (2016) developed a numerica l model based on OpenFOAM to study steady current flow through plane net panels and circular fish cages.
While, the above studies relate to flow through the net cage or fish farm, there is paucity of research taking the biofouling proble m into account. Swift et al. (2006) ca rried out field measurements with 1m×1m p lane nets accumulated by various amounts of biofouling and the drag force acting on the biofouled netting was discussed. Gansel, Mc Climans, and Myrhaug (2012) conducted physical-model tests on six cy lindrical nettings using PIV technique to study the average flow fie lds around net cages with an attempt to analyze the biofouling effect. Gansel et al. (2015) measured drag forces on both clean and biofouled nettings in laboratory e xperiment and the relationship between net solidity and drag was assessed. Lader et al. (2015) performed fie ld tests to investigate the growth characteristics of hydroids growing on a net and conducted laboratory e xperiments to study the hydrodynamic drag on the fouled twines by using fabricated models of net twines with artific ia l hydroid fouling. Through the review of literature, there is paucity of dedicated and conclusive study on the flow fie ld around the biofouled netting. Hence this study aims to investigate the flow fie ld a round a fish farm consisting of 2×4 full-scale net cages. Three scenarios were considered: (i) net cages with various heights in both tidal and
constant currents; (ii) net cages with various levels of biofouling in a semi-diurnal current and (iii) biofouled net cages in various incidence angles in a semi -diurnal current.
Description of Numerical Model
In this study, a three-dimensional nu merical flu me was built ma inly based on the Navier-Stokes equations with the capacity to generate constant current, semi-diurnal and diurnal t ides. Both the clean and biofouled netting of the net cage were simu lated using the porous -media flu id model. Described by the same set of governing equations, the net-cage model and the numerical flume can be coupled.
Governing equations review
In the present numerical model, the governing equations comprises the Navier-Stokes equations coupled with the realizable k –ε model, wh ich have been described in details in our previous studies (Bi, Zhao, & Dong, 2015; Zhao et al., 2013), thus a brief review is given here. Navier-Stokes equation are
0
i iu
x
(1)
i j
ji i
i t i
j i j j i
u u u
u P u
g S
t x x x x x
(2)
where t is time; µ is the viscosity; ρ is the density of water; µt is the eddy
viscosity;
P
p
2 3
k
, where p representspressure; k represents the turbulent kinetic energy; ui
and uj are the average ve locity co mponent,
respectively; gi is the gravity acceleration; i, j=1, 2, 3
(x, y, z); and Si is an addit ional ite m for the
description of both clean and biofouled netting. The rea lizable k –ε model (Shih, Liou, Shabbir, Yang, & Zhu, 1995) is introduced to close the equations, where k equation is
( )
-
-i t
k b M k
j
i j k
ku
k k
G G Y S
t x x x
(3)
and ε equation is given by
2
1 2 1 3
( i) t
b j
i j
u
C S C C C G S
x x x k k
707
1
1 =max 0.43, , , 2 , =
5 2
j i ij ij ij
j i
u u k
C S S S S S
x x
(5)
In the equations, Gk is the turbulent kinetic
energy generated by the average velocity gradient. Gb
and YM due to buoyancy and compressibility are not
necessary when modeling inco mpressible fluid with no temperature fluctuations, hence Gb = 0 and YM = 0.
C2, C1ε and C3ε are constants; S is the modulus of the
mean rate-of-strain tensor; σk and σε a re the turbulent
Prandtl number; and Sk and Sε are user defined source
terms. The model constants are C1ε = 1.44, C2= 1.9, σk
= 1.0 and σε= 1.2 for the rea lizab le k –ε turbulence
model (Shih et al., 1995).
The governing equations are solved using comme rcia l code ANSYS FLUENT 15.0 where the fin ite volume method (FVM) is adopt for discretizat ion. The p ressure interpolation and mo mentu m equation are discretized using second -order upwind scheme. The iteration of coupling between pressure and velocity uses the SIMPLEC (Se miimp lic it Method for Pressurelin ked Equations -consistent) algorith m. In this study, the time step is set to 200 s for the time discretization.
Net-cage model considering biofouling effect A typical net cage comprises the float collar, sinkers, mooring system and the netting which forms the ma in space for aquaculture. As the most part of the float collar is above the free surface of the water and the sinkers and mooring system are re latively small-scale co mponents. Thus, only the netting is simu lated in this numerica l model and the cylin drica l netting is divided into 16 plane nets around the circu mfe rence and one bottom net (Bi et al., 2015). Both the clean and biofouled netting of the net cage were simu lated using the porous -media flu id model and the corresponding porous coeffic ients were determined fro m the hydrodynamic forces acting on the plane-net sheet which are correlated with the features of the biofouled netting (Bi et al., 2015; Zhao et al., 2013).
The porous-media fluid model is a hypothetical model that acts in the same way as the water-b locking effect fo r both clean and biofou led netting by setting the porous coefficients. Inside the porous media, Si is
calculated by the following equation:
1
2
i ij
S
C
u u
(6)where Cij is given by
0 0
0 0
0 0
n
ij t
t
C
C C
C
(7)
where Cij is porous-coefficient matrices, Cn is the
norma l-resistance coefficient, and Ct is the
tangential-resistance coefficient. The source term fo r the mo mentu m equationis ze ro outside the porous med ia. It should be noted that the unit of the porous coeffic ient is m-1. The calculat ion process of the porous coefficients for the net-cage model is listed in Appendix A.
Numerical flume and boundary conditions The coordinate system for the numerica l model is set as follows: x is positive along the flo w d irection, y is perpendicular to the flow d irection on the horizontal plane and z is upward (Figure 2). The dimensions of the numerica l flu me a re 2000 m long, 1000 m wide and 50 m depth. The computational domain is discretized with structured grid with a resolution of 1~5 m inside and in the vicinity of the fish farm.
Both the upstream and downstream boundaries of the numerical flu me are described by the velocity inlet which produce currents in opposite directions. The flow velocity o f the se mi-diurna l current is imposed using UDF (user defined function) as the following formula:
sin(2 )
m
t
u u
T
(8)
where um is the ma ximu m ve locity and T is the
708
period of the semi-diurna l current which is 12 h. The water level is modeled using zero-shear-stress wall without rise and fall, whe re two facts are considered: i) the net cage is prone to floating on the free surface and ii) the a lternating current induces limited variation in water depth with a lo w current velocity. The bottom of the nu merical model is def ined as no-slip-wa ll and the wa ll function is adopt to simu late the viscous of the fluid near the surface. The lateral boundary conditions of the numerica l flu me are described by zero-shear-stress wall boundaries.
Numerical Simulations
Tidal currents through a fish farm, co mprising 2×4 fu ll-scale circu lar net cages with a diameter (D) of 40 m and a depth (H) of 25 m, are simulated. The center-to-center spacing is 80 m (equal to 2D) between two neighboring net cages. The flow fields in the vicinity of the fish farm a re d iscussed with diffe rent cage heights, incidence angles of the current and levels of biofouling on the netting.
Numerical model description
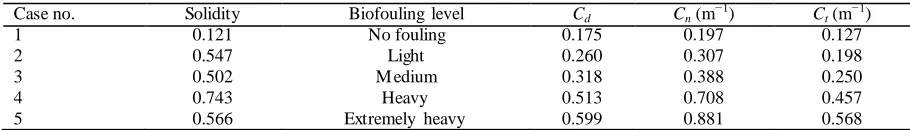
Both tidal and constant currents through the fish farm with the incidence angle of 0° was investigated numerically with diffe rent cage heights: H/h0=0.1, 0.3, 0.5, 0.7 and 0.9. Besides, tidal currents through the fish farm at 0° were modeled with different levels of biofouling. Tab le 1 shows the porous coefficients for the netting model with a thickness of 1 m corresponding to both clean and biofouled nettings. The porous coeffic ients were ma inly determined by the field measurements of Swift et al. (2006) together with the e mpirica l formu las by Aarsnes et al. (1990), which has been described in details in our previous work (Bi et al., 2015). To analyze the effect of incidence angle on the flow field, t idal currents through the fish farm at 0°, 22.5°, 45°, 67.5° and 90° were investigated numerica lly without considering the effect of biofouling. All the numerical simu lations were performed in a semi-d iurnal current for a ma ximu m velocity of 0.1 m s−1 which is considered as a low current velocity (Johansson et al., 2014). The water depth (h0) is 50 m.
Results and Discussion
Effect of Cage Height
Figure 3a presents the tidal current fie lds inside and around the fish farm with different cage heights in
the ebb tide with a free strea m velocity of 0.1 m s−1. As the net cages cover more and more water colu mn, the height of the wake reg ion downstream fro m the fish farm increases with increasing cage height. However, there is no significant variation in the length of the wake for diffe rent cage heights. In contrast, the length of wake increases and the flow-velocity-reduction region shifts downstream progressively with increasing cage height in constant current at 0.1 m s−1 (Figure 3b).
Due to the blockage of the netting, the flow velocity continuously decreases in the flow direct ion till the downstream boundary of the fish farm with diffe rent cage heights in both tidal and constant currents (Figure 4). Then, the flow veloc ity starts to increase in the wa ke of the fish farm which is attribute to the fluid recovery mechanis m. Overall, the flow velocity inside the fish farm is insensitive to the cage height in different conditions. For flo w velocity downstream fro m the fish farm, the variation trend shows no significant diffe rence for different cage heights and the ma ximu m reduction is ranging fro m 35.5% to 39.0% in tida l current. In contrast, the flow velocity decreases progressively as the cage height increases in constant current. The ma ximu m attenuation in flo w ve locity fro m 35.7% to 46.9% can be found in the wake of the fish farm. For cage height H/h0=0.1, there is noticeable fluctuation in flow velocity inside the downstream net cages wh ich may negatively impact the welfare of the fish.
The numerica l results of flow velocity through the fish farm in constant current are co mpared with the results from fo rmulas derived by Løland (Aarsnes et al., 1990) (Figure 4b ). The fo rmulas, based on theoretical work co mbined with e xper imental data, are as follows:
0 1
c n
i i
u
u
r
(9)where ri is the flow velocity reduction factor
which is given by
1.0 0.46
i d
r C (10)
where nc is the number of netting for water flo w
through and Cd is 0.175 for the netting without
biofouling as shown in Table 1. The results show a good agreement between the present model and Lø land's formu la at various positions in the fish farm.
Table 1 Drag coefficients of the nettings and corresponding porous coefficients for different numerical cases
Case no. Solidity Biofouling level Cd Cn (m−1) Ct (m−1)
1 0.121 No fouling 0.175 0.197 0.127
2 0.547 Light 0.260 0.307 0.198
3 0.502 M edium 0.318 0.388 0.250
4 0.743 Heavy 0.513 0.708 0.457
709
This provides confidence that the proposed numerica l model can simu late the flow fie ld inside and around the fish farm accurately.
Using the proposed numerica l model, this study also compares the non-dimensional flow velocity downstream fro m the fish farm in constant current, semi-diurnal and diurnal t ides with the same intensity (Table 2). The flow-velocity reduction in constant current was very large, fo llo wed by diu rnal tide, and semi-diurnal t ide had the least effect. Thus, the flow pattern around the fish farm can be diffe rent in different current conditions.
The vertica l d istributions of the tidal veloc ity are
shown in Figure 5, wh ich are strongly sensitive to the variation in cage height. As expected, there is noticeable attenuation in flow velocity inside the downstream net cages with diffe rent cage heights. Due to mass conservation, the flow velocity progressively increases along the water depth and then decreases after reaching the peak va lue. The numerical results indicate that the net cage with the height of H/h0=0.7 produces the ma ximal peak value of flow veloc ity beneath the fish farm. When the cage height reaches H/h0=0.9, the attenuation in flow velocity in the net cage is lo wer than that with other cage heights and marginally increase in flo w velocity
(a) T idal current
(b) Constant current
Figure 3. Numerical results of flow fields within and around net cages with different cage heights on the vertical plane through the cage center.
x / D
u
/
um
-4 0 4 8 12 16 20 24
0.5 0.6 0.7 0.8 0.9 1 1.1
H/h0=0.1
H/h0=0.3
H/h0=0.5
H/h0=0.7
H/h0=0.9
Netting
x / D
u
/
u0
-4 0 4 8 12 16 20 24
0.4 0.5 0.6 0.7 0.8 0.9 1
H/h0=0.1
H/h0=0.3
H/h0=0.5
H/h0=0.7
H/h0=0.9
Loland
Netting
(a) T idal current (b) Constant current
710
is observed beneath the net cage. This means that an increase in the cage height plays an important role in the flow velocity beneath the fish farm wh ich is associated with the erosion of the seabed sediment (Wu et al., 2014).
Effect of Biofouling on Fishing Net
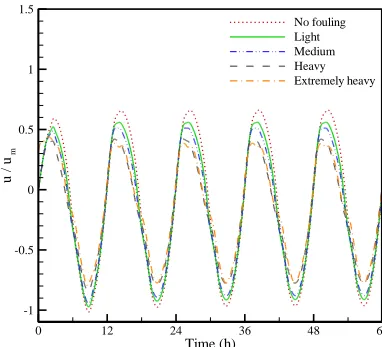
Figure 6 shows the Eule rian record of t idal velocity at the center of the most downstream net cages. In all cases, the flow velocity inside the net cage vary periodica lly corresponding to the tidal current. After the first period, the flow velocity increases marg inally in the t ime doma in, wh ich is due
to the effect of positive wa ke (i.e. a high veloc ity area upstream of the fish farm, defined by Corne jo et al. (2014)). The attenuation in flow velocity is pronounced, approximate ly 40%~60%, in the positive tidal current as water passes through seven layers of netting before reaches the monitored point. Ho wever, much less reduction is observed during the inversion of current direct ion because water passes through only one layer of netting which produces much less blockage.
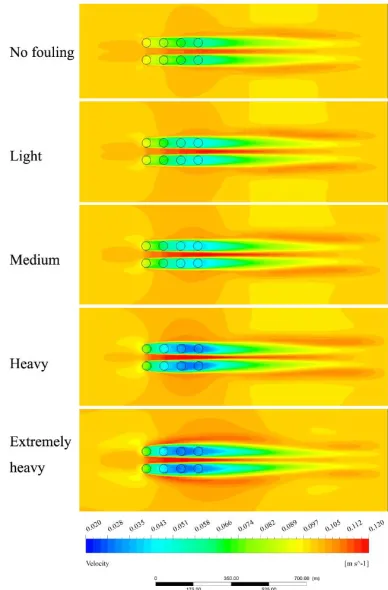
To show horizontal changes in flow field under tidal current, flow-ve locity d istributions within and around the net cages are plotted in the ebb tide with a free strea m veloc ity of 0.1 m s−1. Figure 7 shows the
Table 2 Non-dimensional flow velocity u/um downstream from the fish farm in different current conditions.
Current condition u/um
Semi-diurnal tide 0.669
Diurnal tide 0.569
Constant current 0.541
u / um
z
/
h0
0 0.2 0.4 0.6 0.8 1 1.2 -1
-0.8 -0.6 -0.4 -0.2 0
H/h0=0.1 H/h0=0.3 H/h0=0.5 H/h0=0.7 H/h0=0.9
Figure 5. Numerical results of flow velocity along the vertical centerline of the downstream net cages with different cage heights.
Time (h)
u
/
um
0 12 24 36 48 60
-1 -0.5 0 0.5 1 1.5
No fouling Light Medium Heavy Extremely heavy
711
flow field on the horizontal plane 12.5 m below the water surface which is considered to represent the flow pattern around the net cages. There are noticeable flow-velocity reductions within and downstream fro m the net cages at various levels of biofouling. Overa ll, the attenuation in flow velocity both inside the net cage and in the wa ke reg ion increases as the level of b iofouling increases. In contrast, the flow velocity increases between two rows of net cages and at the flanks due to mass conservation (Kristiansen & Falt insen, 2012), resulting fro m the presence of the net cages. The ma ximu m flow velocity could be ra ised by approximately 23% between two ro ws of net cages,
while it is appro ximate ly 13% at the flanks of the fish farm. Overa ll, the higher the amount of biofouling, the greater the effect on the flow field (Figure 8).
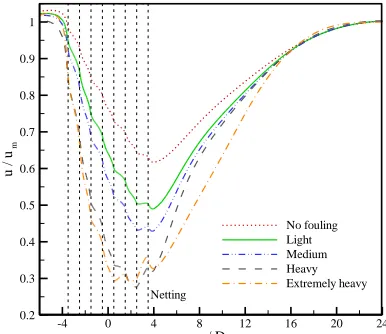
A non-dimensional flo w velocity u/um is introduced to describe the variation in tidal current fie ld which is defined as the rat io of a local flow velocity to the free-strea m ve locity. As flo w through the biofouled netting, the flow veloc ity continuously decreases in the reg ion of fish farm but then increases in the wake of the fish farm at various levels of biofouling (Figure 9). The flow-velocity reduction region (wake ) e xtends for appro ximate ly 20 t imes of cage dia meter downstream fro m the fish farm in all cases. It is intuitive that larger current velocity causes
Figure 7. Numerical results of flow fields within and around net cages with different levels of biofouling on the horizontal plane 12.5 m below the water surface.
y / D
u
/
um
0 0.5 1 1.5 2 2.5 3
0.2 0.4 0.6 0.8 1 1.2
No fouling Light Medium Heavy Extremely heavy
Netting
712
larger wa ke (Cornejo et al., 2014). Besides, the net solidity and the number of the net cage in the fish farm are a lso considered to be factors affecting wa ke formation, wh ich will be further studied in future. For the clean net cages, the ma ximu m attenuation in flow velocity is 38.3% wh ich is monitored at approximately equal to the cage d ia meter downstream fro m the center o f the downstream net cage. In contrast, as the level of biofouling increases, the ma ximu m attenuation in flo w velocity fro m 51.0% to 70.1% can be found in the v icin ity of the downstream net cage. However, the variat ion of the flow velocity
in the fish farm are very similar for cases 4 and 5. It suggests that the flow veloc ity will not consistently decrease with increasing level of biofouling. As flow through the clean net cage is a lso presented, the sole effect of the biofouling on the flo w fie ld can be derived by subtracting the effect of the clean net cage from that of a biofouled one.
Effect of Incidence Angle of the Current
The tidal current fields inside and around the fish farm in the ebb tide with a free stream ve locity of 0.1
x / D
u
/
um
-4 0 4 8 12 16 20 24
0.2 0.3 0.4 0.5 0.6 0.7 0.8 0.9 1
No fouling Light Medium Heavy Extremely heavy Netting
Figure 9. Numerical results of flow velocity along the horizontal centerline of the net cages with different levels of biofouling.
713
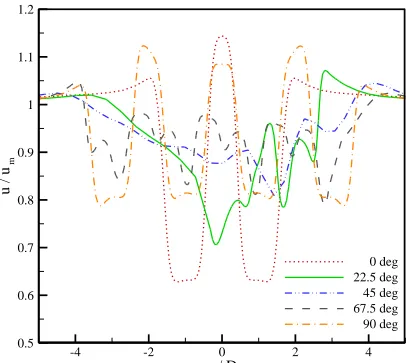
m s−1 are shown in Figure 10. The nu merica l result indicates that the incidence angle of the tidal current can affect the flow fie lds within and around the net cages significantly. As the incidence angle increases, the positive-wa ke region upstream the fish farm is prone to increase, while the attenuation in flow velocity downstream fro m the fish farm tends to decrease. Compared with the tandem net cages, the staggered ones present more noticeable blockage effect on incoming flow, wh ich results in an uniformly distributed wake downstream fro m the fish farm. When the incidence angle reaches 90°, the tidal current produce simila r flo w pattern around the fish farm with that of 0°, because the net cages become tandem again. As e xpected, the attenuation in flow velocity downstream fro m the fish farm at 90° is smaller than that at 0° because of less tandem net cage in the flo w direction (Figure 11). For 0° inc idence angle, the flo w veloc ity is attenuated by approximately 37.1% in the wake , while it is increased between two ro ws of net cages by 14.4% and at the flanks by 5.4% due to mass conservation. In contrast, the flow fie ld shows the least variation in flow velocity downstream the fish farm with the incidence angle of 45°, which indicates the min imal impact on the environment.
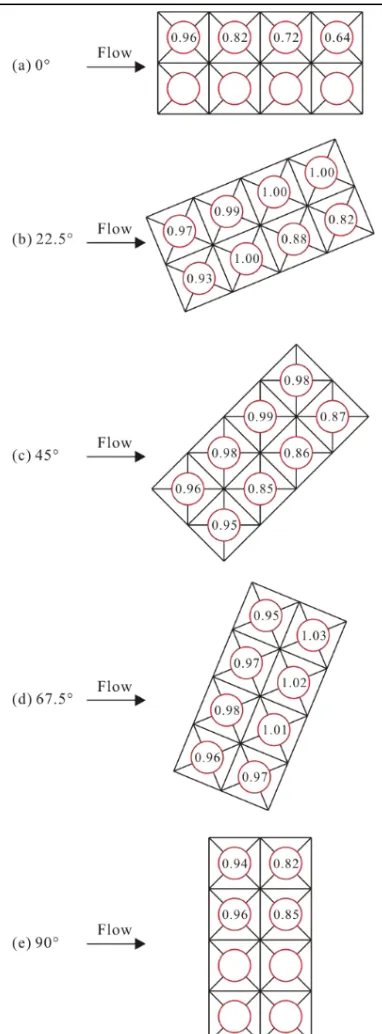
The flow ve locity at the center of the net cage is monitored to present the flo w field inside a net cage among the fish farm (Figure 12). A mong the five incidence angles, the non-dimensional flow velocity u/um inside the net cage is ranging from 0.64 to 1.03. Inside most of the net cages, noticeable attenuation in flow veloc ity e xists due to the blockage effect (or shadowing effect) of the netting. Ho wever, there is no reduction even has slightly increase in flo w velocity inside some downstrea m net cages, because of the interaction between the wa kes fro m diffe rent neighboring net cages. For the incidence angle of 67.5°, relatively larger flow velocities (0.96~1.03) are monitored inside the net cages, which is considered to
be beneficial to the water e xchange. Moreover, flow velocities are similar inside all the cages of the fish farm, which indicates that the incidence angle of 67.5° has advantage in provid ing a uniform flow environment for the caged fish. On this basis, the optima l orientation of the fish fa rm can be determined in certain tidal current from an ecological perspective. As current flows through net cages in a fish farm, especially when considering the biofouling on the net, the flow ve locity is attenuated in the vicinity region due to the shield ing effect of the netting. Thus, the hydrodynamic loads acting on and the water e xchange of the net cage will be changed correspondingly. Besides, the investigation on the flow field downstrea m fro m the fish farm has implication for integrated mu lti-trophic aquaculture (IMTA, shown in Figure 13) configurations which consist of fin fish cages, inorganic e xt ractive species (such as kelp) and organic e xtractive species (such as shellfish). The flo w fie ld downstrea m fro m the finfish cage is essential to predict the transport of dissolved nutrients and the hydrodynamic performance of IMTA.
Conclusions
The study investigated tidal current through a fish farm consisting of 2×4 full-scale net cages with numerical approach. The flow-velocity d istributions within and around the net cages are discussed with diffe rent cage heights, incidence angles of the current and levels of biofouling on the netting. Below a re the main conclusions:
(i) The height of the wake region downstream fro m the fish farm increases with increasing cage height. The net cage with the non-dimensional height of H/h0=0.7 produces the ma xima l peak value of flow velocity beneath the fish farm. Different flow patterns are observed in diffe rent current conditions. The flow -velocity reduction in constant current was very large,
y / D
u
/
um
-4 -2 0 2 4
0.5 0.6 0.7 0.8 0.9 1 1.1 1.2
0 deg 22.5 deg 45 deg 67.5 deg 90 deg
714
Figure 12. Flow-velocity distribution within the net cages with different incidence angles measured at the cage center.
715
followed by diurnal tide, and semi-d iurnal tide had the least effect.
(ii) The attenuation in flow velocity both inside the net cage and in the wake region increases as the level of biofouling increases. The ma ximu m attenuation in flo w ve locity fro m 51.0% to 70.1% can be found in the vicinity of biofouled net cages compared to 38.3% for the clean net cages.
(iii) Fo r the fish farm oriented at different incidence angles, the staggered net cages are prone to produce more uniformly distributed wake than the tandem net cages. The fish farm at 45°, by contrast, presents the least variation in flow velocity downstream fro m the net cages. While the fish farm at 67.5° has advantage in provid ing a uniform flow environment for the caged fish.
The study on flow fie ld in the vicin ity region of the fish farm is essential to the analysis of water e xchange and nutrient transportation. In addition, the variation in flo w ve locity should be taken into account in studying the hydrodynamic characteristics of a net cage or cage array; which provides more accurate results for the prediction of the mooring line loads for design of a aquaculture farm. Fro m a wider perspective, the result of this study has imp licat ion for the transportation of dissolved nutrients and the hydrodynamic performance of integrated multi -trophic aquaculture (IMTA) configurations.
Acknowledgements
This work was financially supported by the National Natura l Sc ience Foundation of China (nos. 51609035 and 51409037) and China Postdoctoral Science Foundation (nos. 2016M590224 and 2017T100176).
Appe ndi x A. The calcul ation pr ocess of the porous coefficients
The drag and lift forces, Fd and Fl, acting on a
porous medium can be calculated as follows:
1
2
d n
F
C
A u u
(A1)1
2
l t
F
C
A u u
(A2)where λ and A are the thickness and area of the porous med ia, respectively. The drag and lift forces that acts on a plane net can also be calculated from the Morison equation: 2 0 1 2 d d
F
C Au (A3)2 0
1 2
l l
F C Au (A4)
where u0 is the free stream velocity.
The norma l-resistance coefficient Cn is
calculated using the least square method by fitting the drag forces of the plane net oriented normal to the current at various flow velocit ies. The tangential-resistance coefficient Ct is calculated by Morison
equation with the empirica l formu la of lift coeffic ient proposed by Aarsnes et al. (1990):
2 3
C
l
(0.57
S
n
3.54
S
n
10.1 )sin(2 )
S
n
(A5)where Sn is the net solidity and α is the attack
angle that is defined to be the angle between the flow direction and the plane net in the horizontal plane.
Once Cn and Ct are obtained, the normal and
tangential resistance coefficients for the plane net at various attack angles can be calculated as follows:
cos(2 )
2
2
n t n t
n
C
C
C
C
C
(A6)sin(2 ) 2
n t
t
C C
C
(A7)References
Aarsnes, J., Rudi, H., & Løland, G. (1990). Current forces on cage, net deflection. Paper presented at the Engineering for offshore fish farming. Proceedings of a conference organised by the Institution of Civil Engineers, Glasgow, UK, 17-18 October 1990. Thomas Telford, pp. 137-152.
Bi, C.-w., Zhao, Y.-p., & Dong, G.-h. (2015). Numerical study on the hydrodynamic characteristics of biofouled full-scale net cage. China Ocean
Engineering, 29(3), 401-414.
https://dx.doi.org/10.1007/s13344-015-0028-9 Braithwaite, R. A., Carrascosa, M. C. C., & M cEvoy, L. A.
(2007). Biofouling of salmon cage netting and the efficacy of a typical copper-based antifoulant.
Aquaculture, 262(2), 219-226.
https://dx.doi.org/10.1016/j.aquaculture.2006.11.027 Chen, H., & Christensen, E. D. (2016). Investigations on the
porous resistance coefficients for fishing net structures. Journal of Fluids & Structures, 65, 76-107. https://dx.doi.org/10.1016/j.jfluidstructs.2016.05.005 Cornejo, P., Sepúlveda, H. H., Gutiérrez, M. H., & Olivares,
G. (2014). Numerical studies on the hydrodynamic effects of a salmon farm in an idealized environment.
Aquaculture, 430, 195-206.
https://dx.doi.org/10.1016/j.aquaculture.2014.04.015 FAO. (2014). The state of world fisheries and aquaculture:
Food and Agriculture Organization of the United Nations, Rome, Italy.
Fitridge, I., Dempster, T., Guenther, J., & de Nys, R. (2012). The impact and control of biofouling in marine aquaculture: a review. Biofouling, 28(7), 649-669.
https://dx.doi.org/10.1080/08927014.2012.700478 Gansel, L. C., M cClimans, T. A., & Myrhaug, D. (2012).
716
https://dx.doi.org/10.1115/1.4006150
Gansel, L. C., Plew, D. R., Endresen, P. C., Olsen, A. I., Misimi, E., Guenther, J., & Jensen, Ø. (2015). Drag of Clean and Fouled Net Panels - M easurements and Parameterization of Fouling. PLoS ONE, 10(7), e0131051.
https://dx.doi.org/10.1371/journal.pone.0131051 Harendza, A., Visscher, J., Gansel, L., & Pettersen, B. R.
(2008). PIV on inclined cylinder shaped fish cages in a current and the resulting flow field. ASM E 2008 27th International Conference on Offshore M echanics and Arctic Engineering, pp. 555-563.
Johansson, D., Juell, J.-E., Oppedal, F., Stiansen, J.-E., & Ruohonen, K. (2007). The influence of the pycnocline and cage resistance on current flow, oxygen flux and swimming behaviour of Atlantic salmon (Salmo salar L.) in production cages. Aquaculture, 265(1-4), 271-287.
https://dx.doi.org/10.1016/j.aquaculture.2006.12.047 Johansson, D., Laursen, F., Fernö, A., Fosseidengen, J. E.,
Klebert, P., Stien, L. H., . . . Oppedal, F. (2014). The interaction between water currents and salmon swimming behaviour in sea cages. PLoS ONE, 9(5), e97635.
https://dx.doi.org/10.1371/journal.pone.0097635 Klebert, P., Lader, P., Gansel, L., & Oppedal, F. (2013).
Hydrodynamic interactions on net panel and aquaculture fish cages: a review. Ocean Engineering,
58, 260-274.
https://dx.doi.org/10.1016/j.oceaneng.2012.11.006 Kristiansen, T., & Faltinsen, O. M . (2012). M odelling of
current loads on aquaculture net cages. Journal o f
Fluids and Structures, 34, 218-235.
https://dx.doi.org/10.1016/j.jfluidstructs.2012.04.001 Lader, P., Fredriksson, D. W., Guenther, J., Volent, Z.,
Blocher, N., Kristiansen, D., & Gansel, L. (2015). Drag on hydroid-fouled nets – An experimental
approach. China Ocean Engineering, 29(3), 369-389. https://dx.doi.org/10.1007/s13344-015-0026-y Rasmussen, H. W., Patursson, Ø., & Simonsen, K. (2015).
Visualisation of the wake behind fish farming sea cages. Aquacultural Engineering, 64, 25-31. https://dx.doi.org/10.1016/j.aquaeng.2014.12.001 Shih, T.-H., Liou, W. W., Shabbir, A., Yang, Z., & Zhu, J.
(1995). A new k-ϵ eddy viscosity model for high reynolds number turbulent flows. Computers &
Fluids, 24(3), 227-238.
https://dx.doi.org/10.1016/0045-7930(94)00032-T Shim, K., Klebert, P., & Fredheim, A. (2009). Numerical
investigation of the flow through and around a net cage. ASM E 2009 28th International Conference on Ocean, Offshore and Arctic Engineering, pp. 581-587. Swift, M . R., Fredriksson, D. W., Unrein, A., Fullerton, B., Patursson, O., & Baldwin, K. (2006). Drag force acting on biofouled net panels. Aquacultural
Engineering, 35(3), 292-299.
https://dx.doi.org/10.1016/j.aquaeng.2006.03.002 Wu, Y., Chaffey, J., Law, B., Greenberg, D. A.,
Drozdowski, A., Page, F., & Haigh, S. (2014). A three-dimensional hydrodynamic model for aquaculture: a case study in the Bay of Fundy. Aquaculture Environment Interactions, 5, 235-248. https://dx.doi.org/10.3354/aei00108
Xu, T.-J., Hou, H.-M ., Dong, G.-H., Zhao, Y.-P., & Guo, W.-J. (2017). Structural Analysis of Float Collar for M etal Fish Cage in Waves. Turkish Journal of Fisheries and Aquatic Sciences, 17(2), 257-268. https://dx.doi.org/10.4194/1303-2712-v17_2_04 Zhao, Y.-P., Bi, C.-W., Dong, G.-H., Gui, F.-K., Cui, Y., &
Xu, T.-J. (2013). Numerical simulation of the flow field inside and around gravity cages. Aquacultural
Engineering, 52, 1-13.