Biojournal of Science and Technology
Research Article
Development of a modified Britton
improved linearity in the alkaline pH region
Akio Ebihara
1, Shuhei Kawamoto
Suzuki
1, Tsutomu Nakagawa
1Faculty of Applied Biological Sciences, Gifu University, 1
2Graduate School of Applied Biological Sciences, Gifu University, 1
*Corresponding author
Tsutomu Nakagawa
Faculty of Applied Biological Sciences, Gifu University, 1-1 Yanagido, Gifu, 501-1193, Japan.
Email: [email protected]
Published: 20-02-2016
Biojournal of Science and Technology Academic Editor: Editor-in-Chief
This is an Open Access article distributed under the terms of the Creative Commons Attribution License (http://creativecommons.org/licenses/by/4.0
reproduction in any medium, provided the original work is properly cited.
Abstract
Britton-Robinson buffer is a multi-buffer system acid. Although this buffer system is known region (pH 9–12) is poor. Searching alkaline region, we found that glycine (
the pH titration curve. The pH titration formula of the improved this report. The pH-dependent activities of
electrolyte balance, were investigated using the improved buffer, and the results those measured with the typical Britton
Keywords:
Universal buffer, Britton
renin.
Biojournal of Science and Technology
Development of a modified Britton-Robinson buffer with
improved linearity in the alkaline pH region
, Shuhei Kawamoto
2, Naoya Shibata
2, Takashi Yamaguchi
Tsutomu Nakagawa
1, *Faculty of Applied Biological Sciences, Gifu University, 1-1 Yanagido, Gifu, 501-1193, Japan
Graduate School of Applied Biological Sciences, Gifu University, 1-1 Yanagido, Gifu, 501-1193, Japan
Faculty of Applied Biological Sciences, Gifu University,
Received: 28-12-2015 Biojournal of Science and Technology Vol.3:2016 Accepted: 04-02-2016 Article no: m150006
This is an Open Access article distributed under the terms of the Creative Commons Attribution License
http://creativecommons.org/licenses/by/4.0 ), which permits unrestricted use, distribution, and reproduction in any medium, provided the original work is properly cited.
buffer system that consists of citric acid, phosphate, . Although this buffer system is known to be effective from pH 2.6 to 12, the linearity of
. Searching for a weak acid additive to maintain the buffering capacity in the lkaline region, we found that glycine (pKa = 2.35 and 9.78) was effective in improving
pH titration curve. The pH titration formula of the improved Britton-Robinson buffer
dependent activities of renin, a key enzyme that regulates blood pressure and electrolyte balance, were investigated using the improved buffer, and the results found
Britton-Robinson buffer.
Universal buffer, Britton-Robinson buffer, multi-buffer system,
pH-Robinson buffer with
, Takashi Yamaguchi
2, Fumiaki
1193, Japan
5 6
This is an Open Access article distributed under the terms of the Creative Commons Attribution License ), which permits unrestricted use, distribution, and
, barbital, and boric effective from pH 2.6 to 12, the linearity of the alkaline a weak acid additive to maintain the buffering capacity in the improving the linearity of Robinson buffer is provided in renin, a key enzyme that regulates blood pressure and found were similar to
@2015, GreenNetPub Biojournal of Science and Technology P a g e | 2
INTRODUCTION
Proteins bear numerous functional groups that can undergo acid-base reactions (Voet and Voet 2004a). Because of the presence of pH-titratable groups, protein properties can change in a pH-dependent manner. For example, the initial rate of many enzymatic reactions exhibits a bell-shaped curve as a function of pH (Voet and Voet 2004b). This is a result of the effect of pH on several factors: the binding of substrates to the enzyme, the catalytic activity of the enzyme, and changes in protein structure (Voet and Voet 2004b); because of this, pH-dependent properties of proteins are measured in buffer solutions, which maintain pH of the solution within a small range.
A typical buffer is a solution of a weak acid and its conjugate base (Voet and Voet 2004a). The buffering capacity is effective only in the pH range of pKa ± 1 (Voet and Voet 2004a). To cover wide ranges of pH values, multi-buffer systems containing several weak acids in one solution are used (Johnson and Lindsey 1939, McIlvaine 1921, Newman 2004). Using multi-buffer systems, buffers may be prepared at a desired pH value without altering the chemical composition of the buffered component.
We have utilized the multi-buffer system known as the Britton-Robinson buffer, which is effective from pH 2.6 to 12 (Johnson and Lindsey 1939), to analyze the pH-dependent properties of enzymes (Ebihara et al. 2000, Iwata et al. 2007, Iwata et al. 2008, Nasir 1998). This buffer system contains four different buffering components: citric acid (pKa = 3.0, 4.6 and 5.8), phosphate (pKa = 6.9 and 11.6), barbital (pKa = 7.96), and boric acid (pKa = 9.2) (Johnson and Lindsey 1939). The respective pKa values ranging from 3.0 to 9.2 differ from one another by about 1.2 pKa units (Britton and Robinson 1931). However, the difference in pKa values between boric acid (pKa = 9.2) and phosphate (pKa = 11.6) is 2.4, leading to weak buffering capacity in the alkaline region (pH 9.2– 11.6).
In this study, we searched for another weak acid to improve the buffering capacity in the alkaline
region. For this purpose, we found that glycine (pKa = 2.35 and 9.78) is effective, and we have proposed a simple formula for the preparation of the improved Britton-Robinson buffer.
MATERIALS AND METHODS
Materials
All buffer reagents were purchased from Nacalai Tesque (Kyoto, Japan).
Searching an additive to improve an alkaline region
To prepare a typical Britton-Robinson buffer (citric acid/phosphate/barbital/boric acid system) (Johnson and Lindsey 1939), an acid mixture containing hydrochloric acid (38.1 mM, HCl), citric acid (38.1 mM), potassium dihydrogen phosphate (38.1 mM), barbital (38.1 mM), and boric acid (38.1 mM) was prepared (see below for more details). To search for another weak acid that maintains the buffering capacity in the alkaline region, glycine (pKa = 2.35 and 9.78), sodium bicarbonate (pKa = 3.80 and 10.38), and N -cyclohexyl-3-aminopropanesulfonic acid (pKa = 10.4, CAPS) were selected and added to separate acid mixtures at a final concentration of 38.1 mM. These new acid mixtures, as well as the typical Britton-Robinson acid mixture were aliquoted into 51 tubes with 150-µL volume. The aliquots were separately mixed with sodium hydroxide (50 µ L, NaOH) solution, where a different volume of 1.0 M NaOH was added in increments of 1.0 µ L. The pH values of the resulting solutions were measured at room temperature using a compact pH meter (model B-212, Horiba, Kyoto Japan).
Making a formula to prepare improved Britton-Robinson buffer
@2015, GreenNetPub Biojournal of Science and Technology P a g e | 3
a magnetic stirrer. After ensuring complete dissolution of the solids, an HCl solution (117.8 µL, Mw = 36.48; d = 1.18 g/mL) was added to this solution, which was then made up to 100 mL with pure water. To adjust the pH of the buffer to the desired value, 150-µ L aliquots of the acid mixture (38.1 mM with respect each component) were titrated with NaOH solution (50 µL). The pH titration curve obtained in this study is represented by: pH = 0.1920 × VNaOH + 2.3813, where pH is
the desired pH value of the titrated solution, and VNaOH is the volume of 1.0 M NaOH. Based on this
equation, VNaOH (µ L) as well as the remaining
volume [50 VNaOH (µL)] of pure water were
determined to prepare a buffer with the desired pH value. The pH value of titrated solution was measured at room temperature using a compact pH meter. The acid mixture and the titrated solutions were stored at room temperature in the dark before use.
Examining pH-dependent properties using the improved Britton-Robinson buffer
To examine the pH-dependence of enzymatic activity, recombinant human renin (25 pM) was incubated with recombinant ovine angiotensinogen (0.5 µM, oANG) at 37 °C for 30 min at various pH values, ranging from pH 3.5 to 10.0, using the improved Britton-Robinson buffer. In addition, the buffer contained diisopropyl fluorophosphate (8 mM), EDTA (8 mM), NaCl (100 mM), and 0.1% (w/v) heat-denatured bovine serum albumin (fraction V). The concentration of each buffering component (citric acid/phosphate/barbital/boric acid/glycine system) was 20 mM. Recombinant human renin and oANG were prepared as described previously (Ebihara et al. 2000, Nagase et al. 1997, Nasir 1998). The rate of angiotensin-I generation was determined by an enzyme-linked immunosorbent assay (ELISA) (Suzuki et al. 1990).
RESULTS
Improvement of the Britton-Robinson buffer containing a weak acid additive
To improve the buffering capacity of Britton-Robinson buffer in the alkaline region (pH 9.2 – 11.6), we prepared three kinds of Britton-Robinson buffer containing either glycine (pKa = 2.35 and 9.78), CAPS (pKa = 10.4), or sodium bicarbonate (pKa = 3.80 and 10.38). When the acid mixture was titrated with NaOH, the pH of the titrated solution was approximately proportional to the volume of NaOH (Figure 1A), which is consistent with previous observations (Britton and Robinson 1931). Compared to the standard Britton-Robinson buffer, the buffers containing either glycine or CAPS exhibited better linearity in the alkaline region (Figure 1B). In contrast, the linearity of the buffer containing sodium bicarbonate was worse above pH 9 (Figure 1A). Based on the titration data (Figure 1A), we performed a linear regression analysis to derive a pH titration equation (Table 1). Compared with the typical Britton-Robinson buffer, the buffer containing either glycine or CAPS as the additive allowed a wider pH-buffering range with good linearity (R2 = 0.999). This result indicates that each of these additives is effective in improving the buffering capacity in the alkaline region (pH 9 to 12). Because glycine is cheaper than CAPS, we used glycine as the weak acid additive to test the buffer solution.
@2015, GreenNetPub Biojournal of Science and Technology P a g e | 4
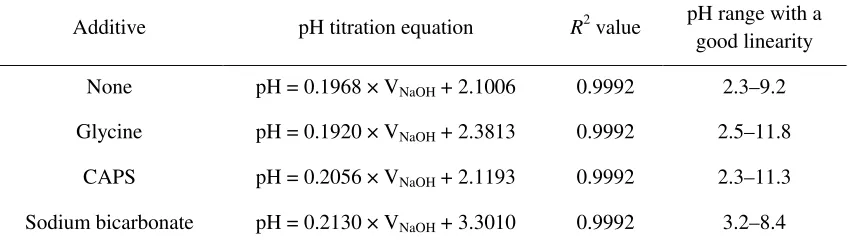
Table 1.Effect of an additive on the pH-titration of Britton-Robinson buffer
Additive pH titration equation R2 value pH range with a
good linearity
None pH = 0.1968 × VNaOH + 2.1006 0.9992 2.3–9.2
Glycine pH = 0.1920 × VNaOH + 2.3813 0.9992 2.5–11.8
CAPS pH = 0.2056 × VNaOH + 2.1193 0.9992 2.3–11.3
Sodium bicarbonate pH = 0.2130 × VNaOH + 3.3010 0.9992 3.2–8.4
The pH titration equation as well as its R2 value was obtained using linear regression in Microsoft Excel.
Figure 1. Examining a weak acid to improve the buffering capacity in the alkaline region of Britton-Robinson buffer.
(A) Comparison of pH titration curve. Fifty-one aliquots containing 150 µL acid mixture were separately mixed with 50 µL NaOH solution containing a different amount of 1.0 M NaOH. In addition to a typical acid mixture (blue), acid mixtures containing either glycine (black), CAPS (red), or sodium bicarbonate (magenta) as weak acid additives were prepared to examine their buffering capacities.
@2015, GreenNetPub Biojournal of Science and Technology P a g e | 5
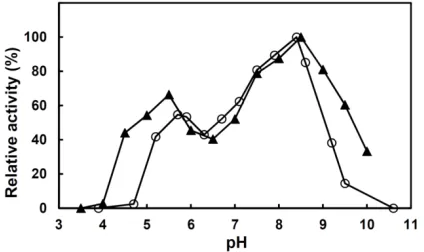
Examining pH-dependent properties of protein Using the improved Britton-Robinson buffer, we reexamined the pH-dependency of renin, a key enzyme that regulates blood pressure and electrolyte balance (Campbell 2003, Nabi et al. 2013, Voet and Voet 2004b). The pH-dependency
measured with the improved buffer was similar to that measured using the standard Britton-Robinson buffer (Figure 3). This result indicates that the improved buffer is compatible with the standard buffer and can be used to study pH-dependent protein properties.
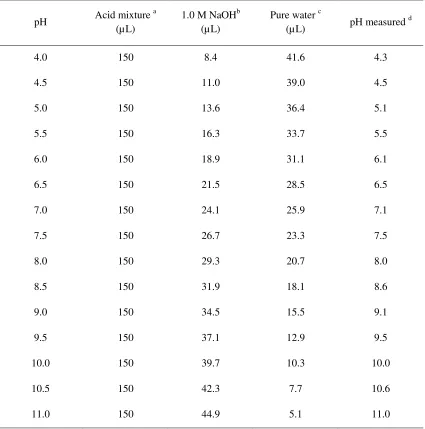
Table 2.Formula to prepare the improved Britton-Robinson buffer (pH 4.0–11.0)
pH Acid mixture
a
(µL)
1.0 M NaOHb (µL)
Pure water c
(µL) pH measured
d
4.0 150 8.4 41.6 4.3
4.5 150 11.0 39.0 4.5
5.0 150 13.6 36.4 5.1
5.5 150 16.3 33.7 5.5
6.0 150 18.9 31.1 6.1
6.5 150 21.5 28.5 6.5
7.0 150 24.1 25.9 7.1
7.5 150 26.7 23.3 7.5
8.0 150 29.3 20.7 8.0
8.5 150 31.9 18.1 8.6
9.0 150 34.5 15.5 9.1
9.5 150 37.1 12.9 9.5
10.0 150 39.7 10.3 10.0
10.5 150 42.3 7.7 10.6
11.0 150 44.9 5.1 11.0
The buffer contained HCl, citric acid, potassium dihydrogen phosphate, barbital, boric acid, and glycine.
a
38.1mM each. bThe volume is defined as VNaOH (µL). c
The volume is equal to 50 VNaOH (µL). d
@2015, GreenNetPub Biojournal of Science and Technology P a g e | 6
Figure 2. Confirmation of pH titration curve of the improved Britton-Robinson buffer developed in this study. A series of buffers between pH 4.0 and 11.0 were prepared according to the formula provided in Table 2. The pH values measured by a pH meter are shown in by triangles. The pH titration curve derived from Figure 1 (pH = 0.1920 × VNaOH + 2.3813) is shown in this figure.
Figure 3. pH-dependence of human renin with oANG analyzed using the improved Britton-Robinson buffer. The pH-dependent activities of reaction of human renin with oANG were measured at 37 °C for 30 min at various pH values from pH 3.5 to 10.0. Filled triangles indicate activities measured using improved Britton-Robinson buffer developed in this study. Activities measured using a standard Britton-Robinson buffer (Ebihara et al. 2000) are shown in by open circles.
DISCUSSION
Multi-buffer systems contains several buffering components (Newman 2004). These buffer systems allow the pH of a buffer solution to be maintained without changing the chemical
composition (Newman 2004). In this study, we improved the buffering capacity of the multi-acid Britton-Robinson buffer in the alkaline region. We found that glycine was an effective additive, improving the buffer performance in the alkaline region (Figure 1A). The glycine-added Britton-Robinson buffer had good linearity over a wide pH range (pH 2.5–11.8) (Table 1). As shown in Figure 2, the pH values of improved Britton-Robinson buffer that was prepared according to the preparation formula (Table 2) were in good agreement with the pH values predicted by the pH titration equation.
Because the pH titration equation was found to be repeatable (Figure 2), it can be used to prepare the improved Britton-Robinson buffer. Depending on the quality of reagents available, the pH titration equation can be shifted about 0.1 pH unit from our equation. Generally, several experimental plots at pH 4.0, 7.0, and 10.0 should be made to generate new pH titration equations tailored to available reagents. The preparation formula proposed in this study will prove useful for studies on pH-dependent properties of proteins.
CONFLICT OF INTEREST
The authors declare that they have no conflict of interest.
ACKNOWLEDGEMENTS
We thank all the laboratory members who have contributed to the improvement of Britton-Robinson buffer. This work was supported in part by the JSPS KAKENHI (Grant Nos. 24658092 and 15K01707).
REFERENCES
1. Britton HTS, Robinson RA. Universal buffer solutions and the dissociation constant of veronal. J. Chem. Soc. (Resumed). 1931, 1456–1462.
@2015, GreenNetPub Biojournal of Science and Technology P a g e | 7
3. Ebihara A, Kondou T, Mizuno S, Nakagawa T, Nasir UM, Inui Y, Fukamizu A, Suzuki F, Nakamura Y, Murakami K. Molecular
properties of recombinant ovine
angiotensinogen. Biomedical Research-Tokyo. 2000, 21: 247–254.
4. Iwata H, Nakagawa T, Nishiuchi K, Hiratsuka T, Satou R, Yoshioka Y, Fukui Y, Suzuki F,
Nakamura Y. Ser84 of human renin
contributes to the biphasic pH dependence of the renin-angiotensinogen reaction. Biosci. Biotechnol. Biochem. 2007, 71: 1279–1285. 5. Iwata H, Nakagawa T, Yoshioka Y, Kagei K,
Imada K, Nakane C, Fujita H, Suzuki F, Nakamura Y. The coexistence of Ser84 in renin and His13 in angiotensinogen brings a pH profile of two separate peaks to the reaction of human renin and sheep angiotensinogen. Biosci. Biotechnol. Biochem. 2008, 72: 179–185.
6. Johnson WC, Lindsey AJ. An improved universal buffer. Analyst. 1939. 64: 490–492. 7. McIlvaine TC. A buffer solution for
colorimetric comparison. J. Biol. Chem. 1921, 49: 183–186.
8. Nabi AHMN, Suzuki F, Inagami K. Renin. in Rawlings ND, Salvesen GS, eds. Handbook of Proteolytic Enzymes, vol. 1 Academic Press, Oxford. 2013. 71–82
9. Nagase M, Suzuki F, Sawai Y, Orihashi T,
Inui Y, Nakagawa T, Nakamura Y.
Purification and some properties of recombinant sheep angiotensinogen expressed in Chinese hamster ovary cells. Biomedical Research-Tokyo. 1997, 18: 439–443.
10. Nasir UM, Takahashi, K., Nagai, T., Nakagawa, T., Suzuki, F., Nakamura, Y. Two
peaks in pH dependence of
renin-angiotensinogen reaction. Biosci. Biotechnol. Biochem. 1998, 62: 338–340.
11. Newman J Novel buffer systems for macromolecular crystallization. Acta. Cryst. D. 2004, 60: 610–612.
12. Suzuki F, Yamashita S, Takahashi A, Ito M, Miyazaki S, Nagata Y, Nakamura Y. Highly sensitive microplate-ELISA for angiotensin I using 3,3',5,5'-tetramethylbenzidine. Clin. Exp. Hyper. 1990, A12: 83–95.
13. Voet D, Voet JG. Aqueous Solutions. Biochemistry. New York: John Wiley & Sons, Inc. 2004, 39–50.
14. Voet D, Voet JG. Rates of Enzymatic Reactions. Biochemistry. New York: John Wiley & Sons, Inc. 2004, 472–495.
@2015, GreenNetPub
Supplementary
Supplementary Figure 1. pH values of the improved
improved Britton-Robinson buffers adjusted from pH 4.0 to 11.0 were stored at room for 50 days. Using a compact pH meter, the pH values of the buffers were
Biojournal of Science and Technology
Supplementary Figures & Tables
pH values of the improved Britton-Robinson buffer stored for 50 days.
s adjusted from pH 4.0 to 11.0 were stored at room temperature for 50 days. Using a compact pH meter, the pH values of the buffers were measured over the
Biojournal of Science and Technology P a g e | 8
@2015, GreenNetPub Biojournal of Science and Technology P a g e | 9
Supplementary Table 1.Effect of dilution on the pH value of improved Britton-Robinson buffer
The buffer contained HCl, citric acid, potassium dihydrogen phosphate, barbital, boric acid, and glycine. The buffer solution was diluted with sodium phosphate buffer (10 mM, pH 7.2) containing NaCl (100 mM) and 0.1% (w/v) heat-denatured bovine serum albumin (fraction V). aThe volume is defined as VNaOH (µ L).
b
28.6 mM each (28.6 mM buffer:phosphate buffer = 100:0). c20.0 mM each (28.6 mM buffer:phosphate buffer = 70:30). d14.3 mM each (28.6 mM buffer:phosphate buffer = 50:50).
1.0 M NaOH a (µL)
100:0 b 70:30 c 50:50 d 1.0 M
NaOH a (µL)
100:0 b 70:30 c 50:50 d
0 2.5 2.6 2.8 26 7.5 7.5 7.5
1 2.6 2.7 2.9 27 7.7 7.6 7.6
2 2.8 2.9 3.1 28 7.9 7.9 7.8
3 2.9 3.0 3.2 29 8.1 8.0 8.0
4 3.1 3.2 3.4 30 8.2 8.2 8.2
5 3.3 3.4 3.6 31 8.4 8.3 8.3
6 3.5 3.6 3.7 32 8.7 8.6 8.6
7 3.6 3.7 3.9 33 8.9 8.8 8.7
8 3.8 3.9 4.1 34 9.1 9.0 8.9
9 4.0 4.1 4.3 35 9.2 9.2 9.1
10 4.2 4.3 4.5 36 9.4 9.3 9.2
11 4.4 4.5 4.8 37 9.5 9.4 9.3
12 4.6 4.7 5.0 38 9.6 9.6 9.5
13 4.8 4.9 5.2 39 9.8 9.8 9.6
14 5.0 5.2 5.4 40 10.0 9.9 9.8
15 5.2 5.4 5.6 41 10.2 10.1 10.0
16 5.4 5.5 5.8 42 10.4 10.3 10.2
17 5.7 5.8 6.0 43 10.6 10.6 10.3
18 5.9 6.0 6.1 44 10.8 10.7 10.6
19 6.1 6.2 6.3 45 11.1 11.0 10.7
20 6.3 6.3 6.5 46 11.2 11.1 10.9
21 6.4 6.5 6.7 47 11.4 11.3 11.1
22 6.6 6.7 6.8 48 11.6 11.5 11.3
23 6.8 6.8 6.9 49 11.7 11.5 11.4
24 7.0 7.0 7.1 50 11.8 11.6 11.5