A METHOD FOR AUTOMATED TESTING OF SOFTWARE INTERFACE
Andrej Ušaniov, Kęstutis Motiejūnas
Software Engineering Department, Kaunas University of Technology Studentų St. 50-406, LT-51368 Kaunas, Lithuania
e-mail: [email protected], [email protected]
Abstract. More than 50 % of all software development resources are consumed by testing of software. Today the majority of software has a graphical user interface. The most popular way to test software functions is to test them through a user interface. Automation allows testing costs to be reduced and more extensive testing of software to be performed, thus resulting in more bugs being found and increasing the quality of software. Automation includes automatic generation of test case, tests execution and verification of result. Most popular testing methods automate on-ly certain phases of testing. A method for automated testing of software, which covers all phases of testing, provides means for modelling end user actions, feeds test data into test model and also verifies test results, is presented in this paper.
Keywords: software testing, software interface, GUI testing, tests model, testing automation.
1. Introduction
Today the majority of software has a graphical interface. Users can access software functions through graphical user interface. Of course, the most popular way to test software is to test it through its user interface [1]. This is usually referenced as GUI (Graphical User Interface) testing. During GUI testing software is verified through its interface. Usually test-ing begins at the end of the development process. A tester enters some input data into software windows and checks if the produced result is correct.
In practice, testing process is often associated with time and budget constraints, vaguely documented requirements, misunderstandings of testing objectives, and inaccurate evaluation of a testing scope. The user interface tests are usually documented as steps in semi-formal text documents. Latter text documents are read by testers whom manually execute the docu-mented test cases. The testing result is then manually evaluated by a tester. This manual process is very labour intensive and takes more than 50% of the re-quired development effort and resources. Time and budget constraints force developers to ship incomple-tely tested software [2].
In order to reduce testing costs, tests are automated [3-7]. Automation allows testing cost to be reduced and more extensive software testing to be performed, thus resulting in more bugs found and increased qua-lity of the software [8]. The automation involves auto-matic preparation of test case, test execution and result verification.
Majority of testing methods automate only certain phases of software testing. . For example, designing test cases using conditioned slicing of activity diagram [9] just generates test case and is not suitable for full testing automation.
Other GUI testing methods are based on GUI gra-phical representation preparation methodology [10]. Often they only provide instructions how to prepare tests manually, but do not provide means to generate test cases. Therefore test cases can only be executed and results evaluated manually. For example, a me-thod which allows generating test cases from UML activity diagrams [11] cannot be used to automatically execute them. Other testing methods describe how to manually execute tests that were created automatically [12]. Some methods use program method calls, which are not the same as end user activity with GUI. Also those methods do not provide means for applying test data to the generated paths.
sequence of SUT objects method calls is similar to unit testing.
Sometimes code-based models are used [14]. However all of these models show the way a program should work, but are not suitable for modelling user’s activity. These methods can generate paths from a program model. But they do not provide means for executing these paths automatically or model how steps from these paths are related to GUI events.
Some methods use results of the first execution of tests for subsequent testing. The drawback of this approach is that expected results are not known during modelling of tests and results obtained after the first execution may not reliable [1, 12, 14]. Another auto-matic test case generation for UML activity diagrams method treats activity diagram as design specification and is oriented at comparing it with trace results of real program execution [15]. This still does not solve the testing oracle problem. The activity diagram me-thod presents a program model, but not the test model. The current state of method allows generating tests, but does not execute tests.
Constraints within model can be used as test oracles [16].
Some authors propose easier way for creating automated user interface tests than using record play-back tools [1, 17] or automatically generating user interface tests [18].
Similar research is presented in [19]. D. Barisas and E. Bareiša have proposed an automated method for software testing based on state transitions.. The aim of this method is to gather specifications from the code and automatically construct a model by com-bining collaboration diagrams and state charts. This model allows generating test paths. Test data for current iteration is passed to generated test paths ma-nually. This method is a software behaviour oriented method and the end user‘s point of view of testable system is not considered. Also application of this model is labour intensive and it does not solve the test oracle problem [19].
The test generation method based on software models and imprecise constraints was proposed by Š. Packevičius [20]. This method allows automated creation of test cases for software units with built-in oracle. The imprecise constraints within model are used for generation of the test data and act as a test oracle. This method is suitable for testing units of soft-ware. It can be described as testing software from within. While testing through GUI can be described as testing software from outside [20].
Shortcomings of manual methods of testing and in-completeness of existing GUI testing methods leads to a lack of GUI testing method which would cover all phases of automated testing and enable automated and regression testing. Such method should be based on generating tests from tests models. This approach would shift testing process to a higher level of abst-raction, which should close knowledge gaps between
development team members, as they have different levels of understanding of functional requirements and system’s behaviour. It also should provide means for modelling end user’s actions by binding test steps with events on GUI components. It is important that the method would specify how test data and built-in test oracle could be automatically verified based on test model.
A method for automated software interface testing based on tests model and experiments is presented in this paper.
2. A method for automated testing of software interface
A method for automated software interface testing is proposed in this section. The method is presented by: UML-based test model description, rules and prin-ciples for its construction, generation of executable test scripts including graph traverse algorithms, crea-tion of test oracles, the algorithm to minimize the generated test script set based on code coverage, and the GUI testing framework.
2.1. The test model
Manual testing process is very labour intensive. The graphical representation of test cases is proposed to overcome this issue and to allow testers to concentrate on testing aims by eliminating the need for creating tedious test cases and manually executing them.
A square area calculation program is used to demonstrate how test model is applied to the testing process. The square area is calculated by multiplica-tion of width and height. After the input parameters “Width” and “Height” are set and button “Calculate” is pressed the result is shown in the read-only field “Square area”. On one hand, required functionality for this system seems obvious, but on the other hand there is no detailed specification of requirements.
One of the possible ways to tests an area calcula-tion program is to input width and height and compare the calculated result against the expected result. Based on this approach a test case can be proposed. This test case will be refered to as ‘TestCase_1’. The steps for it are: “Enter width: 5”, “Enter height: 4”, “Press calcu-late”.
An example of TestCase_1 in a textual form is given in Table 1.
It is obvious that the creation, maintenance and execution of test cases even for such trivial programs is tedious and requires a lot of testing resources. Table 1. Textual form of the test case
# Step Expected result Actual result
1 Enter width: 5 Width is displayed Ok 2 Enter height: 4 Height is
displayed Ok 3 Press calculate Square area is
calculated: 20
Ok
To replace the textual form of the test case with graphical one the UML 2.0 activity diagram was used. The example of TestCase_1 in a graphical form is presented in Figurere 1.
Figure 1. A graphical form of the test case
Alternatively, more than one test case can be ref-lected with one diagram. This can be done by placing additional control flow, merge node and decision node components into TestCase_1 diagram. A sample of multiple test cases reflected within one diagram is presented in Figure 2. The visualization of multiple test cases within a single diagram turns it into a tests model. In the case when SUT consists of many func-tions the test cases for every function should be depicted graphically as tests models. All these test models are used to create the system testing diagram – the SUT’s test model, where action components are calls to test models of separate functions.
Visualtest cases are easier to create. Adding just one one transaction arrow into existing test case diag-ram results in one or more additional testing scenarios. Thus decreasing manual effort required for creating tests. Furthermore, the visualised approach simplifies maintenance of tests and makes them less change-sensitive. For example, if the functionality of a square area calculation program is being modified to volume calculation then in order to apply changes it is sufficient to place additional step “Enter depth” into a diagram.
Figure 2. Multiple test cases within a single diagram
The action components in the diagram correspond to the steps of the test case. The control flow components define the sequence of test’s steps. The data pin components are used to input data and receive results. Testing data can be generated automatically or manually. Elements of testing data are subsequently passed to the testing step. The quantity of test cases that can be generated within one test model is:
; D paths
TC (1)
where:
TC – the quantity of generated test cases,
path – the number of paths within a test model,
n
i
i
p length D
1
)
( – the number of testing
data collections, } , , , ,
{p1 p2 pn 1 pn
P – the data set of pin
parameters,
k k
i v v v v
p 1, 2,, 1, – the set of values of a data pin parameter pi,
) (pi
length – the cardinality of the set pi.
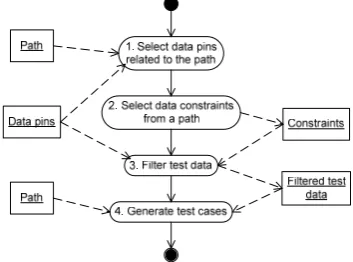
When generating test cases, it is very important how the test data is selected. A certain test data might not activate a selected path. In order to prevent void test cases from being generated the ‘dirty’ data must be filtered. An algorithm for filtering of test data is presented in Figure 3.
Figure 3. An algorithm for the selection of test data
the selected path. If the data pin parameter is never used in the path it is skipped.
2. The selected path is analysed and conditions are selected. Those conditions put constraints on the test data.
3. The values of data pin parameter are filtered by applying constraints to each of them. The result is filtered test data, which executes test paths. 4. Filtered data and selected paths are used to
gene-rate test cases.
The usage of test model makes it possible to auto-matically generate test cases. The test cases expressed via executable testing scripts can be executed automa-tically. The test model is treated as a directed graph. The test cases or sequences of test steps could be generated by traversing it. The mapping between test steps and GUI components of SUT is required to ge-nerate executable testing scripts. Also the description of each test step should provide explicit information on which action should be executed on a mapped GUI component.
Within the test model, the ‘Documentation’ property of an element of an activity diagram is used to store the mapping information and description of actions.
The keywords which describe executable action within each the ‘Documentation’ property of each test step are: process, control path, methods, properties, values, action types: (1) action, (2) assignment and (3)
assertion, variables, operators, IfVariable.
2.2. Constructing a graph
While creating a test model of SUT a tester can choose different layouts and designs. The calls to nested tests models of the functionality of the system could be used. Such calls make test models more visually explicit, more intelligent, and easier to maintain.
In the test model, the testing of the same SUT functionality can be represented in multiple ways. To evaluate the complexity of the test model the cyclo-matic complexity is used. It is important to keep the model unambiguous and easy to understand.
The cyclomatic complexity can be decreased by separating the functionality of the system into distinct test models and using calls to them from of the main test model of the system,
2.3. The graph traverse – generation of tests The test model represented as the UML 2.0 activity diagram is treated as a directed graph. The vertices (nodes) of the graph correspond to test steps of the test model. The arcs indicate the testing flow from one vertex to another. The XML format is used to store the activity diagram in the file hereafter refered to as ’XML file’. The XML file is parsed. During the parsing the vertices and edges are loaded into the adjacency matrix data structure. The adjacency matrix
is used to represent the graph. This is a matrix with rows and columns labelled by graph vertices. It shows which graph vertices are adjacent.
Once the tests model is into the adjacency matrix, traversing algorithms can be applied and test paths generated. A path in a graph is a sequence of vertices such that from each of its vertices there is an edge to the next vertex in the sequence [21].
The goal of graph traverse is to generate test paths. In case of test model a path is a sequence of test steps. Test paths can also be referred to as ‘test cases’ or ‘test scenarios’. The size of generated set of test cases de-pends on testing goals and project constraints.
The test cases set generated using all paths search, hereafter ‘all paths set’, represents all inde-pendent paths within the tests model of SUT. Thus execution of all generated test cases requires the lar-gest amount of time. The all paths search is based on the breadth-first graph search algorithm that begins at the root node and explores all the neighbouring nodes. Then for each of those adjacent nodes, it explores their unexplored neighbour nodes, and so on, until it finds the goal. List of all paths is created during the search.
The set of test cases generated using main paths search, hereafter ‘main paths set’, consists only of the minimal amount of test cases which cover only the main aspects of the software’s functionality. The main paths are determined by weights which correspond to the probability of software functions usage. The main
paths search is a modification of all paths search
algorithm with the only difference – it only selects nodes where connecting edges have higher weight or selectes several nodes if the weight of edges con-necting them is equal.
A set of test cases set generated using all nodes search, hereafter ‘all nodes set’ ensures that every defined tester’s action within the tests model will be reached at least once. This is a subset of all paths set with a smaller amount of test cases and requires less time for execution.
The all nodes search is based on sequential selec-tion of the longest path from all paths set. The longest path should have (selection criteria) a smaller number of iterative nodes and a larger number of new nodes than already chosen paths.
2.4. Generating executable test scripts
EnterPinCodeActivityTest1( InitialNode DecisionNode EnterPinCode DecisionNode Ok
ActivityFinalNode )
Figure 4. One of generated paths for the “Enter Pin Code” functionality
By supplementing test path with test data executable test cases expressed in scripting language, hereafter ‘test scripts’, being generated. Examples of generated executable test scripts are given below in Java script (Figure 5) and Visual basic (Figure 6) languages.
Function EnterPinCodeActivityTest1(pinCode, result){ PinCode=pinCode;
Sys.Process("ATM").ATM.EnterPin.enterPinTextBox.Text = PinCode;
Sys.Process("ATM").ATM.EnterPin.enterPinOkButton.ClickButto n();
result[0]="OK"; }
Figure 5. The “Enter Pin Code” test script written in JavaScript
Sub EnterPinCodeActivityTest1(pinCode, ByRef result) PinCode=pinCode
Sys.Process("ATM").ATM.EnterPin.enterPinTextBox.Text = PinCode Sys.Process("ATM").ATM.EnterPin.enterPinOkButton.ClickButton result="OK"
End Sub
Figure 6. The “Enter Pin Code” test script written in Visual Basic
Prepared test scripts are automatically executed on SUT and provide code coverage feedback for subsequent tests minimisation step.
2.5. The test oracle
In the proposed method, the problem of test oracle is solved by placing assertions within test model. In other words test model has built-in test oracles. The ’Opaque Action’ elements are used to make assump-tions. In their description the type should be defined as “Assertion”. The deployment rules within diagram are the same as for any “Opaque Action” element. Then the tests model is converted into a graph. Assertions are treated as ordinary nodes while traversing graph and generating paths. The generated path may contain more than one assertion. This is useful when verifica-tion of multiple variables is required. Verifying multiple members adds complexity to the software test and increases the possibilities of finding more defects [1]. The assertions in the test model allow for correctness evaluation of GUI components as well as verifying their existence. Further, the verification of business level variables or file verifications can be implemented.
2.6. Minimisation of tests set
The execution duration of test scripts is critical. The reduction of tests set reduction is required to reduce duration of execution. In order to increase method’s effectiveness it is reasonable to minimise tests set.
The test model represents how a user interacts with system’s functions. The test model itself does not show how tests cover SUT. Code coverage is a mea-sure used in software testing which describes the de-gree to which the source code of a program is tested. The code coverage allows to link the test model with SUT since it shows how tests cover the program.
The code coverage metric should be tracked to avoid situations where minimised tests set will be unable to access all required functionality. The gene-rated test scripts should be minimised by eliminating scripts which have no influence on code coverage. Another aspect of minimisation is to not lose the test goal. This means that for each path at least one test script should remain. An algorithm for the minimi-sation of test scripts is depicted in Figure 7.
Figure 7. The generated scripts set minimisation algorithm
The minimisation allows to significantly reduce test cases set while providing the same level of code coverage, thus reducing time required for execution.
2.7. The testing framework
A testing framework which implements a method of automated software interface testing is presented Figure 8.
The testing framework consists of the following parts:
1. A tests model – graphical representation of test ideas bound to the SUT’s GUI. By parsing the tests model, test-steps, test data and assertions are obtained. Test steps are passed to the test path generator. Test data are passed to test scripts ge-nerator. Assertions are passed to the Oracle. 2. The test paths generator – test steps received from
Figure 8. The testing framework
3. The test scripts generator – which receives test data from the tests model and generated paths from test path generator. It selects the test data which enables the execution of path and generates executable test script in chosen language such as Visual Basic or JavaScript. Generated test scripts are transferred to the test driver.
4. The test driver – which takes the SUT or its mu-tant and executes test scripts on it. At the same time it measures the execution code coverage of SUT. Execution results are transferred to the Oracle. The code coverage is transferred to the test minimisation.
5. The mutants’ generator – modifies the code of SUT and creates mutants. Mutants are transferred to the test driver.
6. The Oracle takes results produced by tests execu-tion and evaluates their correctness against asser-tions from the tests model. The test report is prepared at the end of result evaluation; if the result satisfies provided assertion the PASS record is added to the test report, otherwise the FAIL record is added.
7. Tests minimization – provided code coverage al-lows eliminating scripts which have no influence on code coverage.
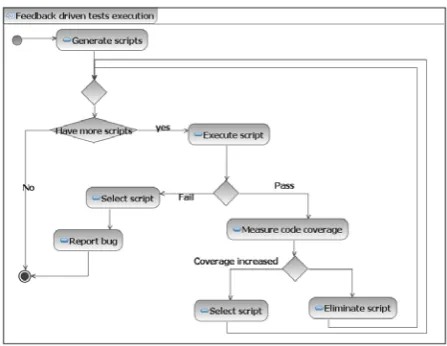
The proposed method uses a feedback driven tests execution technique. It executes until a bug is detected after which it terminates. If no bugs are detected, tests execution continues until the selected coverage crite-rion is reached. After execution of tests, the coverage change is measured, if there is no change detected, the testing ends.
3. Experiments
To evaluate the proposed method we will test these benchmark programs:
1. Square area calculator application – calculates square area by multiplying width and height. 2. Car parking application with Web-based
cell-phone’s emulator – simulates sending and receiv-ing SMS messages when payreceiv-ing for a car parkreceiv-ing. 3. Currency converter – converts amount of money
in one currency into an equivalent in another currency. The same application is used in specifi-cation-driven approach to test GUI-based prog-rams [22].
4. Automatic Teller Machine (ATM) – is an applica-tion that provides customers with access to financial transactions in a public space without the need for a cashier. Using an ATM, customers can withdraw money from their bank accounts, check balances as well as prepay cell phone cre-dit. ATM is popular benchmark used by many 5. mSeller – is open source mobile application for
merchandising. It allows managing goods and their categories, clients and orders directly from a mobile device.
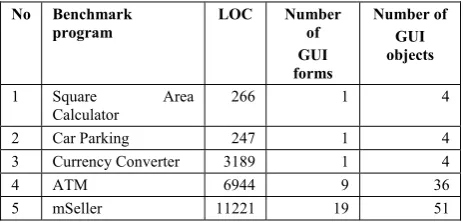
The spectrum of chosen benchmark programs consists of simple demo program, web-based cell-phone application, mobile application, and financial application. The evaluation of benchmark programs in lines of code (LOC) and number of GUI forms is presented in Table 2.
Table 2. Evaluation of benchmark programs
No Benchmark program
LOC Number of GUI forms
Number of GUI objects
1 Square Area Calculator
266 1 4
2 Car Parking 247 1 4 3 Currency Converter 3189 1 4 4 ATM 6944 9 36 5 mSeller 11221 19 51
3.1. The experiment to generate paths and test scripts
subset sizes is presented in Figure 9.The normal dis-tribution of subsets’ sizes showed that in 83 % of cases the size of subsets will make smaller than 49.5 % of “All paths set” size. In other words, usage of all nodes and/or main paths search algorithms allows decreasing tests set size by almost 50%.
34,
13%
3
4,1
3
%
15,
87%
0 0,005 0,01 0,015 0,02 0,025 0,03 0,035 0,04 0,045
0 20 40 60 80
subset size, %
di
s
tr
ib
ution
100
Figure 9. Normal distribution of tests subset sizes
The number of generated test scripts depends on the size of testing data used when selecting testing scenarios. To create the test script input values which enable execution of the path were selected. Therefore the size of test cases and test scripts were linearly depended. The correlation of test cases and test scripts sets’ sizes was 0.98 which meant that both sizes move together in same direction (Figure 10).
1 10 100 1000 10000
1 2 3 4 5 6 7 8 9 10 11 12 13 14 15
Iterations
Se
t s
ize
, q
ty
paths test scripts
Figure 10. Dependancy of paths and generated test scripts
1 10 100 1000 10000 100000 1000000 10000000
Cycles
N
u
m
b
er
of
pat
h
s
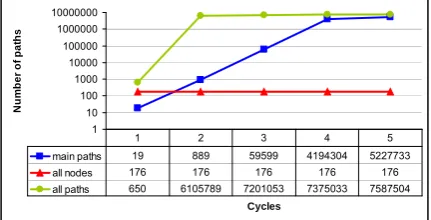
main paths 19 889 59599 4194304 5227733 all nodes 176 176 176 176 176 all paths 650 6105789 7201053 7375033 7587504
1 2 3 4 5
Figure 11. The influence of cycles count on tests‘ set size
3.2. The influence of cycles on path generating While traversing a graph it is important to manage the number of cycles or loops. A cycle is a non-empty path beginning and ending at the same vertex. A graph is acyclic when it has no cycles. In order to manage the generation of the paths g and limit their quantity the parameter “cycles count” is used in graph traversal
algorithms. The influence of cycles’ count is shown in Figure 11. The higher is the value of cycles the expo-nentially larger is the number of generated paths.
3.3. The run-time duration of tests generation To evaluate the run-time duration required for generating tests the ATM tests model was used. Tests were generated with up to 5 cycles and all traversal algorithms.
Since the number of tests increased rapidly, dura-tion of tests generadura-tion is represented via logarithmic trend lines (Figure 12).
-15000000 -10000000 -5000000 0 5000000 10000000
0,0003 0,0034 0,0286 5,4938
Generation duration, min
T
est
set
si
ze
main paths all nodes all paths Log. (main paths) Log. (all nodes) Log. (all paths)
Figure 12. Logarithmic trend lines illustrating the growth of test sets’ size
This graph shows, that:
1. Duration has no influence on the size of tests set generated by all nodes search algorithm; Further all nodes set size remains unchanged with the increase of number of cycles.
2. The all paths search algorithm generates larger amount of tests than main paths and/or all nodes search algorithms.
Generating over 7 millions of test requires around 5 minutes. Thus the time required for the tests genera-tion is short enough not become a bottleneck of the tests creation process.
3.4. The experiment for code coverage measurement
The Generated tests: ’all paths set‘, ’all nodes set‘, and ’main paths set‘ were executed on benchmark programs. During the execution the coverage of benchmark programs was measured. The average code coverage level achieved by execution of tests gene-rated by different graph traversal algorithms is presented in Table 3.
Table 3. The average code coverage achieved by traversal algorithms
Code Coverage, % Graph traversal
algorithm Symbol Branch Method
All paths search 95,77 82 82,2
All nodes search 94,98 78,6 80,6
The ’all paths set‘ provided the highest code coverage level. The ’all nodes set‘ provided slightly lower code coverage than “all path set”. The “main paths set” provided the lowest level of coverage.
None of generated test scripts sets was able to reach 100% code coverage. The analysis of the code coverage showed that the code coverage of certain automatically generated methods such as initialisation and destruction was not measured due to platform specifics. That is why method coverage was about 80%. However the symbol coverage approach covered all the code created by a programmer. The symbol coverage approach will be further applied. The average code coverage for all paths, all nodes, and main paths sets is presented below (Figure 13).
All nodes; 94,98
Main paths; 89,97 All paths;
95,77
87 88 89 90 91 92 93 94 95 96 97
Tests set
S
y
m
b
ol
cove
ra
ge
,
%
Figure 13. The average symbol code coverage by traversal algorithms
3.5. The run-time duration tests’ execution
During the execution of test scripts on benchmark programs the duration of execution was measured. Test scripts were generated with parameter “cycles count” set to 1 and with all traversal algorithms.
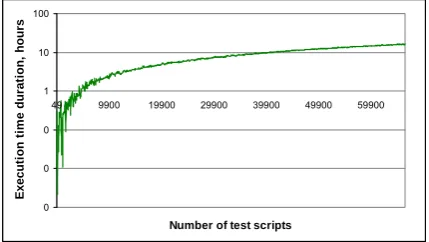
The duration of ’all nodes set’ and ’main paths set’ test scripts execution was about 10 minutes. Execution of ’all paths set’ test scripts took around half an hour. The duration of execution is linearly linked to the the number of test scripts executed. The correlation was 0,95. The larger the size of test scripts set the longer it taked to execute. In Figure 14 the logarithmic graph of duration of executions is given. For example 10 thou-sands of test scripts will take nearly 3 hours to execute.
”Main path” set requires about one minute of exe-cution and on average ensures symbol code coverage of 89.97%. The duration of execution for test scripts will increase from 2 to 40 times when ‘all path’ set is used. This would allow for increasing symbol code coverage on average up to 94.98%. The significantly longer execution would allow increasing code cove-rage by up to 5 %.
The average time taken to execute one test script is 0.879 second with standard deviation 0.378 second. This means that duration required for execution of one test script is about 1 second. In comparison with unit testing this is too long. The reason for this lies in the nature of user interface testing. The execution tool (a test driver) uses the operating system’s resources to access graphical components of SUT and to fire
events or call event-handlers. The wait-timeout para-meter defines how long the test driver can wait until the required GUI component becomes visible. The default wait timeout parameter value is 10000 milli-seconds. It was experimentally determined that it cannot be lower than 500 ms due to GUI nature: 1. The GUI components cannot be used until they
become visible. If wait-timeout value is lower than 500 ms then the test driver marks test script as failed.
2. Business logic functions that execute in the background influence the visibility of GUI component.
Such long time duration of execution of test scripts is a shortcoming of the testing process. If the execu-tion time is too large, automated testing becomes less attractive and cannot compete with manual testing. To change the situation it is necessary to reduce the size of tests set by eliminating scripts which have no influence on the code coverage, therefore leaving only essential test scripts.
0 0 0 1 10 100
49 9900 19900 29900 39900 49900 59900
Number of test scripts
E
x
ecut
ion
ti
m
e
dur
at
ion,
hour
s
Figure 14. The duration of test scripts execution
3.6. The experiment to minimise the tests set The generated testing scripts set can be reduced by eliminating test scripts which have no influence on the code coverage.
The tests set reduction is required to decrease exe-cution time. The summarised results of testing sets reduction are presented in Table 4. Since the ”All path search” algorithm generates the largest testing scripts set – ”All paths set”, it has the biggest chance of reduction equal to 4.2 times. The ”All nodes set” and ”Main paths set” can be reduced by 3.6 and 2.1 times correspondingly.
Table 4. Testing set reduction
Testing scripts set Reduction level on average
All paths set 4,2 All nodes set 3,6 Main paths set 2,1
minimisation, the code coverage by the original test will remain the same in the minimised tests set.
3.7. The mutation testing experiment to the effectiveness of the tests
Creation of tests poses the question whether the tests are correct. To evaluate the effectiveness of the generated test set the mutation testing was used. The benchmark programs were put under the mutation testing. The summarised results of mutation testing grouped by approach of tests generation are presented in Table 5.
Table 5. Mutation testing results of test generation approach
Graph traversal algorithm
Revealed,
% Killed, % Equivalent, % Survived, %
All paths
search 80,56 68,1 12,46 19,44 All nodes
search 80,25 67,79 12,46 19,76 Main paths
search 76,56 64,1 12,46 23,45
Depending on testing goals tester could choose the main path, all nodes, or all paths approaches:
1. The main path set revealed 76.56 % of mutants (killed 64.1 % + 12.46 % equivalent) with rela-tively low execution duration of about 1 minute; 2. The all nodes set revealed 80.25 % of mutants
(killed 67.79 % + 12.46 % equivalent), therefore giving 3.69 % increase of mutants killed. Run-time took up to 10 minutes;
3. The all paths set revealed 80.56 % of mutants (killed 68.1 % + 12.46 % equivalent) and gave 0.4 % increase of mutants killed, but took a relatively long time to execute - around 40 minutes;
The example shows that proposed method allows for an appropriate testing strategy to be chosen, based on the balance of testing duration and test quality required.
3.8. Enabling regression testing with method The initial tests model creation depends on the size of SUT. The average time required to create tests model for benchmark programs is about 2 hours. The test scripts generation and execution took 5 and 40 minutes accordingly (Figure 15).
model creation; 180 tests
generation; 5 tests execution;
40
Figure 15. Initial testing activity allocation
The average size tests model changes due to system modifications or model tuning require less than 15 minutes. While test scripts generation and execution run-time durations remains unchanged (Figure 16).
model creation; 15
tests generation; 5 tests execution;
40
Figure 16. Regression testing activity allocation
The proposed method for automated software in-terface testing is not change-sensitive and allows to quickly and easily adopt to the modifications of the system due to the bug fixes or changed requirements.
3.9. Summary of experiments
The summarised results of executed experiments are presented in Table 6.
Table 6. Summarised results of executed experiments
Approach Code coverage,
%
Test scripts,
%
Revealed,
% Run-time duration
All paths 95.77 100 80.56 > 30 minutes All nodes 94.,98 36 80.25 < 10 minutes Main
paths 89.97
9 76.56 < 1 minute
The ”main path” set revealed 76.56 % of mutants with relatively low execution duration of about 1 minute.
The ”all nodes” set revealed 80.25 % of mutants. This was a3.69 % increase from the ”main path” set. The run-time of all nodes took up to 10 minutes.
The ”all paths” set revealed 80.56 % of mutants. This was only 0,4 % more than ”all nodes” set re-vealed, but required significantly high execution duration of up to 40 minutes;
The use of all nodes and/or main paths approaches allowed decreasing tests set size by 50% and signi-ficantly reduced the run-time duration.
The proposed method allowed to automate all manual tests of system’s functionality performed through GUI and discovered around 80% of mutants.
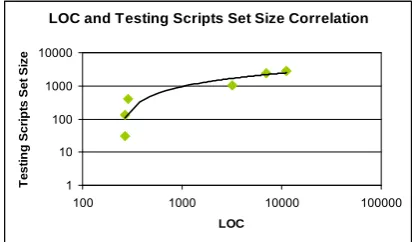
The dependency of SUT lines of code (LOC) and the amount of test scripts required is presented in Figure 17. The correlation metric was 0,975 %. The number of tests quickly increased when LOC grew.
mutants is 0,238. This supports the assumption that the achievement of 100 percents of code coverage by passing all tests does not guarantee bug free-code, since many bugs can hide from test suites [23].
LOC and Testing Scripts Set Size Correlation
1 10 100 1000 10000
100 1000 10000 100000
LOC
T
e
s
ti
ng Sc
ri
pt
s
Se
t
Si
z
e
Figure 17. Correlation of LOC and Testing Scripts Set Size
CodeCoverage and KilledMutants corellation
62 64 66 68 70 72 74 76
90 92 94 96 98 100
Code Coverage, %
K
ille
d
M
u
ta
n
ts
C
o
u
n
t,
%
Figure 18. Correlation of Code Coverage and Killed Mutants
The experiments showed, that nearly 20 % of test scripts revealed up to 60 % of mutants. And remaining 80 % of test scripts reveal up to 20 % of mutants. About 20% of mutants survived and in total 80 % of mutants are revealed.
0 10 20 30 40 50 60 70 80 90
0 20 40 60 80 100
Test scripts, %
R
eveal
e
d
m
u
ta
nt
s,
%
Figure 19. Correlation of Testing Scripts Set Size and Killed Mutants Count
4. Conclusions
1. The analysis of software testing approaches showed that there is a lack of model based testing methods, which automate all testing phases: gene-rating tests, executing them, and evaluating the test result.
2. Using the developed method for automated testing of software interface reduced testing duration and allowed automating all manual tests of the system functionality through a graphical interface.
3. Using the developed method for automated testing of software interface allowed to automatically ge-nerate tests, execute them, and verify test results. 4. The minimization of all paths tests set by 50 % for
selected benchmark programs reduced tests effect-tiveness by no more than 5 %.
5. The mutation testing with selected benchmark programs showed that effectiveness of generated tests reaches 80 %.
References
[1] Kanglin Li, Mengqi Wu. Effective GUI Test Automation: Developing an Automated GUI Testing Tool. Sybex, 2005.
[2] P. Baker, Zhen Ru Dai, J. Grabowski, O. Haugen, S. Lucio, E. Samuelsson, I. Schieferdecker, C.E. Williams. The UML 2.0 Testing Profile. Proceedings of the'8th Conference on Quality Engineering in Software Technology, Nuremberg (Germany), 2004, 181-189.
[3] F. Corno, E. Sanchez, M.S.Reorda, G. Squillero.
Automatic test program generation: a case study. Design & Test of Computers, 2004, 21(2), 102-109.
[4] R. Knowles. Automatic testing: systems and appli-cations. McGraw-Hill, 1976.
[5] N. Tracey, J. Clark, K. Mander, J. McDermid. Automated test-data generation for exception conditions. Software:Practice and Experience, 2000. 30(1), 61-79.
[6] W. Kheng, L.K. Siau Cheng, S. Yi. Automated generation of test programs from closed specifications of classes and test cases. Proceedings of the 26th International Conference on Software Engineering, 2004, 96-105.
[7] W. Xin, C. Zhi, L. Qi Shuhao. An optimized method for automatic test oracle generation from real-time specification. Proceedings of the 10th IEEE Interna-tional Conference on Engineering of Complex Com-puter Systems (ICECCS'05), 2005, 79-85.
[8] D. Elfriede. Effective Software Testing: 50 Ways to Improve Your Software Testing. 2002. Addison-Wes-ley, 240.
[9] M. Ray, S.S. Barpanda and D.P. Mohapatra. Test Case Design Using Conditioned Slicing of Activity Diagram. International Journal of Recent Trends in Engineering (IJRTE), 2009, 1(Issue on Computer Science), 117-120.
[10] A.M. Memon. A Comprehensive Framework For Tes-ting Graphical User Interfaces. PhD thesis, University of Pittsburgh, Faculty Of Arts And Sciences. 2001, 139.
[11] D. Kundu, D. Samanta. A Novel Approach to Gene-rate Test Cases from UML Activity Diagrams. Journal of Object Technology, 2009, 8, 65-83.
[13] M.A.-J. Jesus, I. Luis. Designing GUI Components for UML Use Cases. Proceedings of the 12th IEEE International Conference and Workshops on Engineering of Computer-Based Systems, 2005.
[14] L. Wang. Generating Test Cases from UML Activity Diagram based on Gray-Box Method. Proceedings of the Software Engineering Conference, 11th Asia-Pacific, 2004.
[15] M. Chen, X. Qiu, X. Li. Automatic test case gene-ration for UML activity diagrams. Proceedings of the 2006 international workshop on Automation of soft-ware test. ACM. Shanghai, China, 2006, 2-8.
[16] Š. Packevičius, A. Ušaniov, E. Bareiša. The use of model constraints as imprecise software test oracles. Information technology and control. 2007, 36(2), 246-252.
[17] G. Meszaros. Agile regression testing using record & playback. Proceedings of the Conference on Object Oriented Programming Systems Languages and Applications. Anaheim, CA, USA, 2003, 353-360.
[18] A. Memon, I. Banerjee, A. Nagarajan. What Test Oracle Should I Use for Effective GUI Testing? Pro-ceedings of the 18th IEEE International Conference on Automated Software Engineering,2003, 164-173.
[19] D. Barisas, E. Bareiša.A Software Testing Approach Based on Behavioral UML Models. Information Technology and Control, 2009, 38(2), 119-124.
[20] Š. Packevičius. Unit Tests Generation Using Software Models With Imprecise Constraints. PhD thesis, Kaunas University of Technology, Faculty of Informa-tics. 2009, 140.
[21] R. Diestel. Graph Theory. Third Edition. Springer-Verlag. 2005.
[22] S. Yanhong, L.J. Edward. Specification-driven auto-mated testing of GUI-based Java programs. Pro-ceedings of the 42nd annual Southeast regional conference. Huntsville, Alabama, USA, 2004, 140-145.
[24] R.V. Binder. Testing object-oriented systems: models, patterns, and tools. Addison-Wesley. 1999.