Patron: Her Majesty The Queen Rothamsted Research Harpenden, Herts, AL5 2JQ
Telephone: +44 (0)1582 763133 Web: http://www.rothamsted.ac.uk/
Rothamsted Research is a Company Limited by Guarantee Registered Office: as above. Registered in England No. 2393175. Registered Charity No. 802038. VAT No. 197 4201 51. Founded in 1843 by John Bennet Lawes.
Rothamsted Repository Download
A - Papers appearing in refereed journals
Senbayram, M., Dixon, E. R., Goulding, K. W. T. and Bol, R. 2008.
Long-term influence of manure and mineral nitrogen applications on plant and
soil 15N and 13C values from the Broadbalk Wheat Experiment. Rapid
Communications In Mass Spectrometry. 22 (11), pp. 1735-1740.
The publisher's version can be accessed at:
•
https://dx.doi.org/10.1002/rcm.3548
The output can be accessed at:
https://repository.rothamsted.ac.uk/item/89zq5/long-
term-influence-of-manure-and-mineral-nitrogen-applications-on-plant-and-soil-15n-and-13c-values-from-the-broadbalk-wheat-experiment
.
© 25 April 2008, Wiley.
Long-term influence of manure and mineral nitrogen
applications on plant and soil
15
N and
13
C values
from the Broadbalk Wheat Experiment
y
Mehmet Senbayram
1,3*, Liz Dixon
1, Keith W. T. Goulding
2and Roland Bol
11Cross Institute Programme for Sustainable Soil Function (SoilCIP), North Wyke Research, Okehampton EX20 2SB, UK 2Cross Institute Programme for Sustainable Soil Function (SoilCIP), Rothamsted Research, Harpenden AL5 2JK, UK 3Plant Nutrition and Soil Science Department, Kiel CAU, Olshausenstr. 40, 24118 Kiel, Germany
Received 20 March 2008; Accepted 21 March 2008
The Broadbalk Wheat Experiment at Rothamsted Research in the UK provides a unique opportunity to investigate the long-term impacts of environmental change and agronomic practices on plants and soils. We examined the influence of manure and mineral fertiliser applications on temporal trends in the stable N (15N) and C (13C) isotopes of wheat collected during 1968–1979 and 1996–2005, and of soil collected in 1966 and 2000. The soild15N values in 1966 and 2000 were higher in manure than the mineral N supplied soil; the latter had similar or higherd15N values than non-fertilised soil. The straw d15N values significantly decreased in all N treatments during 1968 to 1979, but not for 1996–2005. The strawd15N values decreased under the highest mineral N supply (192 kg N haS1 -yearS1) by 3%from 1968 to 1979. Mineral N supply significantly increased to strawd13C values in dry years, but not in wet years. Significant correlations existed between wheat strawd13C values with cumulative rainfall (March to June). The cultivarHereward(grown 1996–2005) was less affected by changes in environmental conditions (i.e. water stress and fertiliser regime) thanCappelle Desprez
(1968–1979). We conclude that, in addition to fertiliser type and application rates, water stress and, importantly, plant variety influenced plantd13C andd15N values. Hence, water stress and differential variety response should be considered in plant studies using plantd13C andd15N trends to delineate past or recent environmental or agronomic changes. Copyright#2008 John Wiley & Sons, Ltd.
Nitrogen (d15N) and carbon (d13C) stable isotopes are widely used to study the responses of plants and soils to the long-term impacts of environmental change and agricultural practices.1–3 The availability of data and samples from long-continued field experiments represents an invaluable resource for the testing and verification of such research. The Broadbalk Wheat Experiment (established in 1843) provides a unique opportunity to examine the long-term effects of animal manure and mineral nitrogen (N) fertiliser on plant and soild15N andd13C contents.4–6
Plant and soil nitrogen isotope (d15N) contents may be influenced by soil and plant biochemical processes, morpho-logical plant traits and abiotic factors. Shearer and Kohl reported that plantd15N values generally reflect the source of the plant available nitrogen.7 Various nitrogen sources applied in agricultural systems differ in their d15N values and therefore modify both soil and plant d15N values.8,9
However, the differentiald15N discrimination of several plant and soil processes complicates the interpretation of results with respect to sources.8–10 Generally the long-term appli-cation of manure, which is relatively enriched in15N, leads to higher plant and soild15N values than in unamended (no manure) control plots.2However, changes in plant and soil
d15N values are less consistent when relatively15N-depleted mineral (inorganic) N fertilisers are applied. Indeed, studies have shown that long-term applications of mineral fertiliser can decrease, increase or have no significant effect on plant and soild15N values compared with unamended (no added fertiliser N) control treatments.2,9
Plant carbon (d13C) isotope signatures may be used as an indicator of long-term transpiration efficiency and the ratio of net photosynthesis to stomatal conductance (intrinsic water use efficiency) during assimilation.11,12 Effects of nitrogen supply and drought on intrinsic water use efficiency and thus on plant d13C values have been reported.4,12 Hubick13found no nitrogen effect on (peanut) plantd13C, but increases of plantd13C under high compared with low rates of nitrogen fertiliser were observed.14–16 The effects of nitrogen on plant d13C are strongly influenced by other environmental variables.4,17 Jenkinson and co-authors reported positive effects of nitrogen supply on plant
d13C in dry but not in wet years.4 However, most of the
above-mentioned studies compared only low and high Rapid Commun. Mass Spectrom.2008;22: 1735–1740
Published online in Wiley InterScience (www.interscience.wiley.com) DOI: 10.1002/rcm.3548
*Correspondence to: M. Senbayram, Plant Nutrition and Soil
Science Department, Kiel CAU, Olshausenstr. 40, 24118 Kiel, Germany.
E-mail: [email protected] y
Presented at the annual meeting of the Stable Isotopes Mass Spectrometry Users’ Group (SIMSUG), 20–22 June, 2007, hosted by the Institute for Research on the Environment and Sustainability (IRES) and the School of Civil Engineering and Geosciences, Newcastle University, UK.
nitrogen supply. The question remains whether or not there is a consistent correlation between mineral nitrogen supply and plantd13C over a range of nitrogen application which might explain more about the relation between leaf physiology and environmental changes, especially compar-ing various plant species and cultivars (here wheat cultivars). Ecophysiological data have been used to study the responses of plants to past environmental changes.5 However, as far as we are aware, there are very few long-term data sets available which report on the responses of plant species (here wheat) to environmental changes or anthropogenic activity (such as fertiliser or manure appli-cations). Long-term climate, environmental or agronomic reconstructions using plant d13C or d15N signatures are, however, an invaluable and informative way of examining such responses.
We therefore examined the d15N and d13C values of wheat straw and grain, together with some additional soil samples, for two periods (1968–1979 and 1996–2005) with respect to the effects of: (i) a range of mineral N fertiliser application rates (0 to 192 kg N ha1year1) and manure (35 t ha1year1; containing, on average, 257 kg N ha1year1, predominantly as organic N), and (ii) two different wheat cultivars, cv.Cappelle Desprez(grown from 1968 to 1979) and cv. Hereward(grown from 1996 to 2005).
EXPERIMENTAL
The Broadbalk Wheat Experiment at Rothamsted Research in the UK occupies approximately 5 ha of land which is now divided into 10 sections to test different crop sequences, including continuous wheat. Different combinations of fertiliser and manure are applied every year; some treat-ments date back to the start of the experiment in 1843. The soil is a silty clay loam, producing good wheat yields of up to 11 t ha1. Different varieties of winter wheat, selected from the main varieties used in the UK, have been grown over the years. Wheat is generally sown in October and harvested in August. Archived soil, wheat grain and straw samples were taken from the sections of the experiment on which wheat is grown year after year. Subsamples of grain and straw from harvests were dried at 808C for 16 h before being archived in sealed glass jars or tin boxes. For detailed information about the experiment, see Poulton,18 the web pages of the
Electronic Rothamsted Archive19and Johnston and Garner.20
We analysed samples from six treatments; five were from plots receiving PKMg fertiliser and variable rates of mineral N fertiliser (0, 48, 96, 144, 192 kg N ha1) and the sixth from plots receiving manure (35 t ha1which was on average 257 kg N ha1). Two time periods were considered; 1968–1979 when cv. Cappelle Desprez was grown and 1996–2005 when cv. Hereward was grown. Weather data was taken from the Rothamsted weather station.
The plant and soild13C andd15N values were analysed at the North Wyke Research, Okehampton, UK, using a NA 1500 elemental analyser (Carlo Erba, Milan. Italy) and an automated continuous flow ANCA 20/20SL system (Europa, Crewe, UK). The natural abundance values were expressed as d values, which represent the ratios of 13C/12C or
15N/14N relative to the international VPDB and AIR
standard, respectively, defined as:
d13C¼½ðatom%13Csampleatom%13CVPDBÞ=atom%13CVPDB
1000
d15N¼½ðatom%15Nsampleatom%15NAIRÞ=atom%15NAIR
1000
The analytical precisions of the d13C and
d15N measurements were<0.1 and<0.2%, respectively. The results were analysed with analysis of variance (ANOVA) using the SPSS v.13.0 software (SPSS, Chicago, IL. USA). Pairwise comparisons between the treatments were performed by comparing treatment means with the least significant difference (LSD) procedure. The correlations between the parameters were studied by calculating Pearson’s correlation coefficient (r). Multiple comparisons between the treatment means were performed with Tukey’s HSD tests.
RESULTS AND DISCUSSION
Influence of mineral and manure N inputs on
soil
d
15N and
d
13C
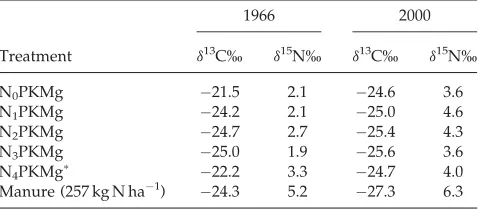
The soild15N values in 1966 and 2000 are given in Table 1. Manure-amended soil had ad15N of at least 1.9%(in 1966) and 1.7% (in 2000) higher than soils that received mineral fertiliser or no fertiliser (control). This would be expected because of the higher d15N values of manure (5.4%0.7, pooled over 6-year samples). Organic fertilisers tend to be enriched ind15N compared with the plant materials ingested by animals due to isotopic discrimination within the animal and microbial processes and NH3 volatilisation after
excretion.21Similar results have been reported by others.22–25 The mineral N-amended soil had similar or higher
d15N values than the control in both years (except N3PKMg)
(Table 1). Although soil samples were taken from different sections of the Broadbalk experiment, it remains unexpected to have (in both periods) higherd15N values in soil amended with mineral N than in the non-fertilised soil. This is surprising as mineral N fertiliser hasd15N values close to the atmospheric value (d15N¼0%) and these are generally lower than thed15N values of the soil to which it is supplied. The
d15N enrichment from 1966 to 2000 in the fertilised soils might have been due to fractionation against15N compared
Table 1. Effects of organic manure and mineral fertiliser application on soild13C andd15N values in 1966 and 2000
1966 2000
Treatment d13C% d15N% d13C% d15N%
N0PKMg 21.5 2.1 24.6 3.6
N1PKMg 24.2 2.1 25.0 4.6
N2PKMg 24.7 2.7 25.4 4.3
N3PKMg 25.0 1.9 25.6 3.6
N4PKMg 22.2 3.3 24.7 4.0
Manure (257 kg N ha1) 24.3 5.2 27.3 6.3
Note: N0–N4¼0, 48, 96, 144, 192 kg N ha1.
N4since 1968 only, previously 48 kg N ha1only.
with 14N during mineralisation, nitrification, volatilisation, and plant uptake. These processes lead to N losses which are relatively enriched in14N, especially from the active part of the organic N pool in the soil. Thus the soil pool becomes relatively enriched in15N over time.7Previous research on the Broadbalk experiment showed that losses of inorganic N increase with rates of mineral N or manure application.26 Robinson estimates the N isotope fractionations for major N cycle processes as 40–60%for NH3volatilisation, 35–60%for
nitrification, 28–33%for denitrification, and 0–19%for NO 3 and 9–18% for NHþ4 assimilation by plants.10 Therefore, increases ind15N values of soil are to be expected.10Ho¨gberg reported that use of large amounts of mineral fertiliser increased the soil d15N values in a long-term forest experiment,17because of higher N losses (relatively enriched in14N compared with15N) from the forest system and the
discrimination of light N isotopes during soil processes which lead to N losses from the system.17,27However, others have observed that long-term application of mineral fertiliser reduces the soild15N content.28–30
The soil d13C values in 1966 were similar regardless of treatment (Table 1). However, soil d13C values were clearly lower for manure-amended soils than for mineral N-amended and non-fertilised soils in 2000. This is expected because of the lower d13C values of manure (–27.0%0.6, pooled over 6-year samples). Interestingly, Gerzabek and co-authors did report that the addition of animal manure over a period of 37 years caused a small but significant decrease in soild13C contents,31but contrary results have also been reported in long-term field experiments.28
Influence of mineral and manure N inputs on
plant
d
15N and
d
13C
Wheat grown on manure-amended soil always had higher
d15N values in straw and grain than that grown on non-fertilised and mineral N-amended soil (Fig. 1). The consistently higherd15N values of manure-amended straw samples may primarily be attributed to the application of
15N-enriched N manure. Similar, positive effects of organic
material amendment on plant d15N values have been reported.23,32
Variation in thed15N values of plants is generally hard to explain, because they are affected not only by fertiliser N, but also by for example: (i) other N sources in soil, (ii) the depth of soil from which N is taken up, and (iii) the atmospheric deposition of ammonium. As can be seen in Fig. 1, straw from mineral N-amended soils had higher values ofd15N than that from non-fertilised plots, especially in the 1968 to 1979 period. Again, as stated in the previous section, this is surprising as mineral N fertiliser generally hasd15N values (0% d15N) lower than the soil to which it is supplied. This may suggest that plant d15N values do not always directly reflect thed15N signature of fertiliser N applied to the soil. Choi and co-authors reported that thed15N signature of maize grown in a glasshouse reflected the fertiliser
d15N value in the early stage of plant growth, but that in later stages the d15N values increased significantly.32 They hypothesised that this was because of the increase in the
d15N value of exchangeable N pool in the soil, linked to the N losses, which discriminated against the heavier
15N compared with 14N.27,32 Results from the long-term
experiment of Meints and co-authors also agreed with our findings and showed the positive effects of higher mineral N supply on leafd15N values of maize.9Another explanation
for the results in the present study could be that at higher rates of fertiliser N application, increasing amounts of fertiliser N exchange with soil organic N, which has a higher
d15N.9Interestingly, the pronounced effect of higher mineral N applications on thed15N values of straw and grain was much clearer in the period 1968–1979 than in 1996–2005 (Fig. 2). This may be related to the different fertiliser source used in each period; N was applied as ammonium nitrate after 1986, but as calcium ammonium nitrate in 1968–1979. Figure 1. Effects of mineral N fertiliser and manure supply on straw and grain d15N values during the 1968–1979 and 1996–2005 periods.
Figure 2. Relationship between mean of strawd15N values and N treatments. Data pooled for each time period in each treatment. Error bars show the standard error of each treatment.
Unfortunately, there are no fertiliser samples available for analysis to check this hypothesis.
Grain samples also showed the same response as straw to organic and mineral N fertiliser amendment; however, grain
d15N values were always higher than straw d15N values (Fig. 1). This may be explained by discrimination within the plant during N uptake, translocation into leaves and stem and later remobilisation into the grain. Another explanation could be that graind15N values reflects thed15N values of soil exchangeable N values during the grain filling period which might increase over time (see previous paragraph).
The straw and grain samples decreased in their
d15N contents from 1968 to 1979 in all treatments, but the decreases were mainly significant for the straw samples (Fig. 1). Strawd15N depletion was larger in the medium and high mineral N treatments than in the manure-amended and the non-fertilised treatments. The straw d15N values decreased by more then 3% from 1968 to 1979 on plots receiving the largest amount of mineral nitrogen (192 kg N ha1year1), but by less than 2%in the manure-amended and the control treatments with regards to the fitted line. There was no significant trend found in straw and grain d15N values during the 1996–2005 period (Fig. 1). Comparing soil and strawd15N values, the strawd15N values were much closer to the soil d15N value in the period 1968–1979 than in 1996–2005. Both the straw and the grain
d15N values were less than the soil d15N values in the 1996–2005 period. This partly agrees with the report by Meints and co-authors that corn and soybean leafd15N values were considerably lower than soild15N values.9
We observed that the wheat straw was depleted in
d13C compared with grain in both periods (Fig. 3). This was ascribed to a higher content of 13C-depleted compounds (cellulose and lignin) in the straw and of 13C-enriched proteins and starch in the grains.30Similar findings were also reported by Zhao and co-authors5 and Farquhar and Richards.33
Carbon isotope discrimination reflects the time-integrated intercellular concentration of CO2, and the positive effect of
N supply ond13C has been widely observed (see Introduc-tion). Higherd13C values in crops receiving mineral N than in
non-fertilised crops indicate a higher photosynthetic capacity.34,35Jenkinson and co-authors reported that there was a large difference between d13C in N-fertilised and non-fertilised plants, but they only compared low and high N supply, whilst we compared four mineral nitrogen rates (plus a zero N and a manure treatment).4Our results agreed with those studies in which it was reported that N supply had a positive effect on thed13C values of straw (Fig. 4).14–16
However, the difference was only observed between no N and N treatments; there were no differences between the different rates of N, as observed in previous study.36We did not see any significant effects of manure on strawd13C values (Fig. 4), in line with our earlier research which had reported that only mineral N and not manure increasedd13C in barley grain.28
Cumulative rainfall, wheat variety and plant
d
13C and
d
15N
The differences between non-fertilised and mineral N treatments varied greatly from year to year depending on water availability, with larger differences in strawd13C in dry years than in wet years. The correlation between Figure 3. Relationship between mean of straw and grain d13C values (pooled over all
treatments) and cumulative rainfall (March to end of June) in the periods from 1968–1979 (cv.Cappelle Desprez) and 1996–2003 (cv.Hereward).
Figure 4. Relationship between mean of strawd13C values and N treatments. Data pooled for each time period in each treatment. Error bars show the standard error of each treatment.
Dd13C (Dd13C¼difference ind13C between the soils receiving no N and mineral N) and cumulative rainfall (March to June) increased with the increasing rate of mineral N fertiliser applied. The R values from the correlation of Dd13C and cumulative rainfall were 0.23, 0.52, 0.49, 0.76 in 1968–1979 and0.23,0.30,0.32,0.56 in 1996–2003 for N1, N2, N3, N4 (indicates significance at 0.001 level). Clay and co-authors reported that positive effects of N nutrition ond13C values resulted from a combination of factors.36First, adding N to N-deficient plants increases the machinery of photosynthesis, which in turn increases thed13C of carbox-ylation because of less discrimination. Secondly, adding N to N-deficient plants tends to increase biomass production, which increases water requirements, so stomatal closure occurs because of water stress.36Our results agree with these
proposed mechanisms, especially with the second sugges-tion by Clay and co-authors, because the N effect ond13C that we observed was more pronounced in dry years. There was also a significant negative correlation between straw
d13C values and the cumulative rainfall from March to June in the period 1968–1979 (cv. Cappelle Desprez), but no significant relation was found in 1996–2003 (cv. Hereward) (Fig. 3). The differences in response to rainfall between the two periods were also observed for the control and manure treatments. Clearly, comparing the two varieties, the newer cultivar,Hereward, had a lower response to rainfall than the older cultivar Cappelle Desprez, independent of fertiliser treatment (Fig. 3). However, straw d15N values increased when the wheat harvest was delayed, especially for a very late harvest in September, 1977, which induced much higher
d15N values. The pronounced influence of harvest dates was not found for graind13C values.
Mineral N application increased the straw d13C and
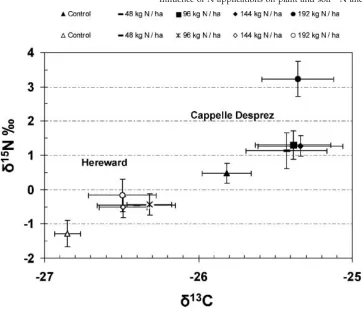
d15N values (Fig. 5) in both periods, but there were clear differences in strawd13C andd15N between the two periods and varieties (Fig. 5). Rebetzke and co-authors reported that
d13C is genetically correlated with yield for wheat grown in water-limited environments, and different varieties may differ ind13C signature.37Our findings agree, as we found clear differences ind13C values in straw when comparing the two sampling periods and different varieties for all treatments (Fig. 5). The pronounced difference in
d13C values, even for non-fertilised plots, means that the newer variety Hereward has lower (more negative)
d13C values relative to the fitted line in Fig. 3, which might be due to a higher time-integrated stomatal conductance.
Changes in plantd13C signatures may reflect the changes in atmospheric CO2concentrations over the last two centuries.5
For archived grain and straw samples from unfertilised plots on Broadbalk, Zhao and co-authors found that
d13C decreased by 2.5–2.8% from the mid-1960s to 1997. This was partly attributed to the dilution of atmospheric
13CO
2by the release of13C-depleted CO2from global losses
of soil organic matter, burning of plant biomass and the use of fossil energy. We concluded from our study that water stress and, also importantly, plant variety influence the plant
d13C andd15N values (Fig. 5). Hence, this differential variety response should be considered in any studies using plant
d13C and d15N to reconstruct or assess past or recent environmental or agronomic changes.
Figure 5. Thed15N andd13C values of straw for two time periods under different rates of mineral N supply (kg N ha1) (black shapes: 1968–1979; open shapes: 1996–2003).
Acknowledgements
This work was partly funded by a grant awarded to M. Senbayram by IGER North Wyke. IGER and Rothamsted Research are grant-aided by the Biotechnology and Bio-logical Science Research Council (BBSRC). We thank Dan Dhanoa for his statistical advice. We also acknowledge Paul Poulton, Klaus Dittert and two anonymous reviewers for their constructive comments.
REFERENCES
1. Bol R, Moering J, Kuzyakov Y, Amelung W.Rapid Commun.
Mass Spectrom.2003;17: 2585.
2. Lobe I, Bol R, Du Preez CC, Amelung W.Soil Biol. Biochem. 2005;37: 1898.
3. O’Brien BJ, Stout JD.Soil Biol. Biochem.1978;10: 309. 4. Jenkinson DS, Coleman K, Harkness DD.Plant Soil1995;171:
365.
5. Zhao FJ, Spiro B, McGrath SP.Oecologia2001;128: 336. 6. Jenkinson DS, Harkness DD, Vance ED, Adams DE,
Harri-son AF.Soil Biol. Biochem.1992;24: 295.
7. Shearer G, Kohl DH.Aust. J. Plant Phys.1986;13: 699. 8. Ho¨gberg P, Johannisson C.Plant Soil1993;157: 147. 9. Meints VW, Boone LV, Kurtz LT.J. Environ. Quality1975;4:
486.
10. Robinson D.Trends in TREE Ecology & Evolution2001;16: 153. 11. Farquhar GD, Ehleringer JR, Hubick KT.Annu. Rev. Plant
Physiol. Plant Mol. Biol.1989;40: 503.
12. Condon AG, Richards RA, Farquhar GD.Aust. J. Agric. Res. 1992;43: 935.
13. Hubick KT.Aust. J. Plant Phys.1990;17: 413.
14. Livingston NJ, Guy RD, Sun ZJ, Ethier GJ.Plant Cell Environ. 1999;22: 282.
15. Ripullone F, Lauteri M, Grassi G, Amato M, Borghetti M. Tree Physiol.2004;24: 671.
16. Bru¨ck H, Jureit C, Hermann M, Schulz A, Sattelmacher B. Plant Biol.2001;3: 326.
17. Ho¨gberg P, Johannisson C.Plant Soil1993;157: 147. 18. Poulton PR.Guide to the Classical and Other Long-term
Exper-iments, Datasets and Sample Archive, Lawes Agricultural Trust
Co. Ltd., 2006; 51.
19. Available: http://www.res.bbsrc.ac.uk/era/.
20. Johnston AE, Garner HV.Broadbalk Historical Introduction.
Rothamsted Experimental Station. Report for 1968, part 2; 1.
21. Kerley SJ, Jarvis SC.Plant Soil1996;178: 287.
22. Zhao BZ, Maeda M, Ozaki Y.Soil Sci. Plant Nutr.2002;48: 555.
23. Choi WJ, Ro HM, Hobbie EA. Soil Biol. Biochem.2003;35: 1493.
24. Choi WJ, Ro HM, Lee SM.Soil Biol. Biochem.2003;35: 1289. 25. Watzka M, Buchgraber K, Wanek W.Soil Biol. Biochem.2006;
38: 1564.
26. Goulding KWT, Poulton PR, Webster CP, Howe MT.S.U.M. 2000; 244.
27. Ho¨gberg P.Oecologia1990;84: 229.
28. Bol R, Eriksen J, Smith P, Garnett MH, Coleman K, Chris-tensen BT.Rapid Commun. Mass Spectrom.2005;19: 3216. 29. Riga A, van Praag HJ, Brigode N.Geoderma1971;6: 213. 30. Gerzabek MH, Haberhauer G, Kirchmann H.Soil Sci. Am. J.
2001;65: 352.
31. Gerzabek MH, Pichlmayer F, Kirchmann H, Haberhauer G. Eur. J. Soil Sci.1997;48: 273.
32. Choi W, Lee SM, Ro HM, Kim KC, Yoo SH.Plant Soil2001;
245: 223.
33. Farquhar GD, Richards RA.Aust. J. Plant Physiol.1984;11: 539.
34. Bru¨ck H, Jureit C, Hermann M, Schulz A, Sattelmacher B. Plant Biol.2001;3: 326.
35. Asch F, Dingkuhn M, Dorffling K.Plant Soil2000;218: 1. 36. Clay DE, Engel DS, Long DS, Liu Z.Soil Sci. Soc. Am. J.2001;
65: 1823.
37. Rebetzke GT, Richards RA, Condon AG, Farquhar GD. Euphytica2006;150: 97.