http://www.sciencepublishinggroup.com/j/ajset doi: 10.11648/j.ajset.20170204.14
Application of Distribution System Automatic Capacitor
Banks for Power Factor Improvement (132/66/33 kV, 90 MVA
Aung Chan Thar (Monywa) Substation in Myanmar)
Soe Win Naing
Department of Electrical Power Engineering, Technological University, Monywa, Myanmar
Email address:
To cite this article:
Soe Win Naing. Application of Distribution System Automatic Capacitor Banks for Power Factor Improvement (132/66/33 kV, 90 MVA Aung Chan Thar (Monywa) Substation in Myanmar). American Journal of Science, Engineering and Technology.
Vol. 2, No. 4, 2017, pp. 120-131. doi: 10.11648/j.ajset.20170204.14
Received: November 4, 2017; Accepted: November 20, 2017; Published: December 14, 2017
Abstract:
Various inductive loads used in all industries deals with the problem of power factor improvement. Capacitor bank connected in shunt helps in maintaining the power factor closer to unity. They improve the electrical supply quality and increase the efficiency of the system. Also the line losses are also reduced. Shunt capacitor banks are less costly and can be installed anywhere. This paper deals with shunt capacitor bank designing for power factor improvement considering overvoltage for substation installation. The main reason of installing a capacitor bank is to reduce electricity costs. This inappropriate installation without enough study gives rise to a great variety of technical problems. Therefore, the fact that capacitor banks are designed for long-term use should be considered. A capacitor consists of two conducting plates separated by a layer of insulating material called the dielectric. A capacitor may be thought of as a battery that stores and releases current to improve the power factor.Keywords:
Shunt Capacitor Bank, Overvoltage Consideration, Power Factor Improvement, Efficiency, Electricity Costs1. Introduction
Most ac electric machines draw apparent power in terms of kilovolt-amperes (kVA) which is in excess of the useful power, measured in kilowatts (kW), required by the machine. The ratio of these quantities (kW/kVA) is called the power factor and is dependent on the type of machine in use. A large proportion of the electric machinery used in industry has an inherently low power factor, which means that the supply authorities have to generate much more current than is theoretically required. In addition, the transformers and cables have to carry this high current. When the overall power factor of a generating station’s load is low, the system is inefficient and the cost of electricity corresponding high [2]. To overcome this, and at the same time ensure that the generators and cables are not loaded with the wattless current, the supply authorities often impulse penalties for low power factor [3] [4]. Some of the machinery or equipments with low power factor are listed below:
1. induction motors of all types 2. power thyristor installations
3. welding machines
4. electric arc and induction furnaces 5. choke coils and induction furnaces 6. neon signs and fluorescent lighting
The method employed to improve the power factor involves introducing reactive (kVAR) into the system in phase opposition to the wattless or reactive current. Standard practice is to connect power capacitors in the power system at appropriate places to compensate the inductive nature of the load.
2. Power Factor Improvement and Its
Benefits
power factor, equipment drawing kVAR of approximately the same magnitude as the load kVAR, but in phase opposition (leading), is connected in parallel with the load.
The resultant kVA is now smaller and the new power factor is increased in Figure 1 and Figure 2, is controlled by the magnitude of the kVAR added. Thus any desired power factor can be obtained by varying the leading kVAR. A typical arrangement of shunt capacitor connected in parallel with a load is shown in Figure 3.
Figure 1. Phasor Diagram of a Plant Operation at Lagging Power Factor.
(kVA) ower Apparent P
(kW) Power Useful )
cosφ ( factor
Power = (1)
Figure 2. Power Factor Correction by adding Leading kVAR.
Figure 3. Capacitor connected in parallel with load.
The benefits that can be achieved by applying the correct power factor correction are:
1. reduction of power consumption due to improved energy efficiency. Reduced power consumption means less greenhouse gas emissions and fossil fuel depletion by power stations.
2. reduction of electricity bills
3. extra kVA available from the existing supply
4. reduction of I2R losses in transformers and distribution equipment
5. reduction of voltage drops in long cables.
6. reduced electrical burden on cables and electrical
components.
3. Methods of Capacitor Banks
Installation
We need to choose the optimum type, size and number of capacitors for the substation. There are four methods of capacitor installations:
3.1. Method 1: Capacitor at Load
Installed a single capacitor at each sizeable motor and energize it whenever the motor is in operation. This method usually offer the greatest advantage of all and the capacitors could be connected either in location (A) as (B) in Figure 4 below.
Figure 4. Location of the capacitor connections.
1. Location A - normally used for most motor applications.
2. Location B - used when motors are jogged, plugged, revered: for multi-speed motors, as reduced voltage start motors.
3.2. Method 2: Fixed Capacitor Bank
Installed a fixed quality of kVAR electrically connected at one or more locations in the plant’s electrical distribution systems, and energized at all times. This method is often used when the facility has few motors of any sizeable horsepower to which capacitors can economically be added. When the system is lightly loaded, and the amount of kVAR energized is too large, the voltage can be so great that motors, lamps, and controls can burn out. It is a important fact to remember that kVAR equal to 20% of the transformer kVA is the maximum size of a fixed kVAR bank. Valued greater than this can result in a large resonant current, which is potentially harmful to the system.
3.3. Method 3: Automatic Capacitor Bank
It is installed at the motor control centre at the service entrance. This bank will closely maintain a preselected value of power factor. This is accomplished by taming a controller switch steps of kVAR on, as off, as needed. Automatic switching ensures exact amount of power factor correction, eliminates over capacitance and resulting over voltages.
3.4. Method 4: Combination of Methods
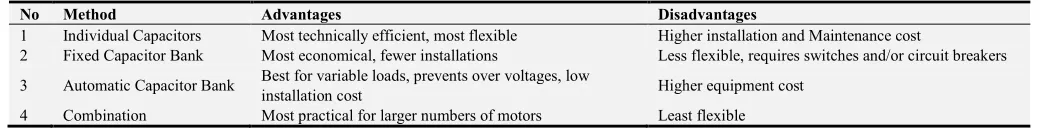
Table 1. Summary of Advantages and Disadvantages.
No Method Advantages Disadvantages
1 Individual Capacitors Most technically efficient, most flexible Higher installation and Maintenance cost
2 Fixed Capacitor Bank Most economical, fewer installations Less flexible, requires switches and/or circuit breakers
3 Automatic Capacitor Bank Best for variable loads, prevents over voltages, low
installation cost Higher equipment cost 4 Combination Most practical for larger numbers of motors Least flexible
4. Automatic Capacitor Bank Installation
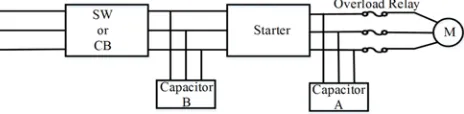
Figure 5. Standard Power Factor Correction.
It is installed at the control center at the service entrance. This bank will closely maintain a pre-selected value of power factor. This is accomplished by having a controller switch steps of kVAR on, or off, as needed. This type of bank eliminates the concern of having too much kVAR energized at light load periods. Automatic switching also ensures exact amount of power factor correction. Standard power factor correction using automatic capacitor bank is shown in Figure 5. This type would seem to have much appeal, but it also has a real disadvantage. Since it is usually located near the incoming service, like the fixed bank this automatic bank does nothing to reduce the conductor losses (and thus billed kilowatt-hours).
5. Load Data and Field Data
5.1. Analysis of Load Data with Power Factor Changes Aung Chan Thar (Monywa) substation is connected 132 kV to the 66 kV distribution network which applied 45 MVA transformer from 132 kV step down to 66 kV and 132 kV to the 33 kV distribution network which applied 45 MVA transformer from 132 kV step down to 33 kV. These lines are radial lines system.
Table 2. 66 kV Main 45 MVA No (1) Log Sheet Data.
Time kV A MVA MW PF
1:00 67 50 5.8 5.2 0.8966
2:00 67 47 5.4 4.8 0.8889
3:00 66 46 5.3 4.7 0.8868
4:00 66 48 5.5 5.0 0.9091
5:00 64 62 6.9 6.2 0.8986
6:00 65.5 73 8.5 7.8 0.9176
7:00 65.5 75 8.5 7.7 0.9059
8:00 65.5 74 8.5 7.7 0.9059
9:00 63 78 8.5 7.6 0.8941
10:00 63 78 8.5 7.6 0.8941
11:00 63 78 8.5 7.6 0.8941
12:00 65 79 8.9 7.5 0.8427
13:00 64 85 9.4 8.5 0.9043
14:00 63 87 9.5 8.7 0.9158
15:00 63 87 9.5 8.7 0.9158
16:00 63 86 9.4 8.6 0.9149
17:00 63 90 9.8 9.0 0.9184
18:00 64 102 11.3 10.0 0.8850 19:00 64.4 87 9.7 8.9 0.9175 20:00 69.7 93.3 11.3 10.0 0.8850
21:00 65 96 10.8 9.6 0.8889
22:00 66 86 9.8 8.6 0.8776
23:00 67 80 9.3 8.0 0.8602
24:00 67 75 8.7 7.5 0.8621
kVA kW
PF= (2)
1000 E I 1.73
kVA= × × (3)
1000 PF E I 1.73
kW= × × × (or)
η 0.746 HP
kW= × (4)
Where, I = Full load current E = Voltage
PF = Power factor HP = Rated horse power
η = Rated efficiency
Table 2 is to illustrate some variables obtained from power factor changes at 66 kV bus bar and Table 3 is to illustrate some variables obtained from power factor changes at 33 kV bus bar. Capacitor rating added to improve power factor can be determined. Capacitor rating is the difference between MVAR ratings of original power factor and desired power factor.
Table 3. 33 kV Main 45 MVA No (2) Log Sheet Data.
Time kV A MVA MW PF
1:00 33.0 340 19.4 18 0.9278
2:00 32.9 325 18.5 17.1 0.9243
3:00 32.9 323 18.4 16 0.8696
4:00 32.8 343 19.5 18 0.9231
5:00 31.5 466 25.4 23 0.9055
6:00 31.9 605 33.4 29 0.8683
7:00 31.2 512 27.6 25 0.9058
8:00 30.9 571 30.5 28 0.9180
9:00 30.7 539.3 28.6 26 0.9091
10:00 30.9 539.3 28.8 26 0.9028
11:00 30.9 501.4 26.8 24 0.8955
12:00 30.9 501.4 26.8 24 0.8955
13:00 31.3 483.0 26.2 23 0.8778
14:00 31.0 510.5 27.4 25 0.9124
15:00 31.2 498.6 26.9 24 0.8923
16:00 30.7 552.2 29.3 26 0.8873
17:00 30.8 553.6 29.5 27 0.9153
18:00 31.4 516 28.0 25 0.8929
19:00 31.4 535 29.1 26 0.8935
20:00 31.4 598 32.5 28 0.8615
21:00 31.8 566 31.1 28 0.9003
22:00 32.4 540 30.3 26 0.8581
23:00 32.9 426 24.3 21.3 0.8765
24:00 32.9 432 24.6 21.6 0.8781
5.2. Field Data of Aung Chan Thar (Monywa) Substation
The following data are obtained from Aung Chan Thar (Monywa) Substation to design capacitor bank for power factor correction.
5.2.1. 45 MVA Main Power Transformer No (1) at 66 kV Bus Bar
Table 4. 66 kV Main 45 MVA No (1).
Parameters Value Units
Transformer rating 45 MVA
Transformer reactance 15 %
Voltage 66 kV
Present maximum load 10 MW
Present maximum MVA 11.3 MVA
Power factor (maximum load) 88.5 %
Desired power factor 95 %
Present minimum load 4.7 MW
Present minimum MVA 5.3 MVA
Power factor (minimum load) 88.68 %
5.2.2. 45 MVA Main Power Transformer No (2) at 33 kV Bus Bar
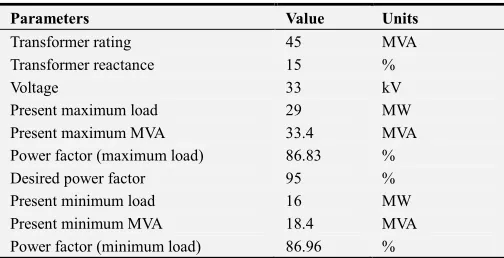
Table 5. 33 kV Main 45 MVA No (2).
Parameters Value Units
Transformer rating 45 MVA
Transformer reactance 15 %
Voltage 33 kV
Present maximum load 29 MW
Present maximum MVA 33.4 MVA Power factor (maximum load) 86.83 %
Desired power factor 95 %
Present minimum load 16 MW
Present minimum MVA 18.4 MVA Power factor (minimum load) 86.96 %
6. Design Calculation of Capacitor Banks
Size
6.1. For 45 MVA Main No (1) at 66 kV Bus Bar
Present load (maximum) = 10 MW
Present power factor (maximum) = 88.5%
Present MVA Demand =
factor power Present load Present (5) MVA 11.30 0.885 10 = =
If the power factor is raised to 95%,
Desired MVA Demand =
factor power Desired load Present (6) MVA 10.53 0.95 10 = =
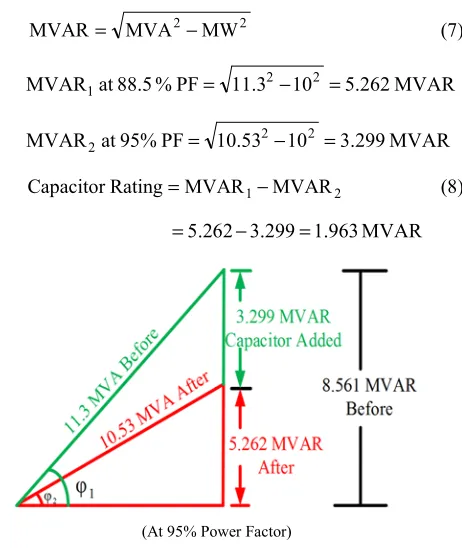
2 2 MW MVA
MVAR= − (7)
MVAR 5.262 10 11.3 PF % 88.5 at
MVAR1 = 2− 2 =
MVAR 3.299 10 10.53 PF 95% at
MVAR2 = 2− 2 =
2 1 MVAR
MVAR Rating
Capacitor = − (8)
MVAR 1.963 3.299
5.262− =
=
(At 95% Power Factor)
Figure 6. Required apparent power before and after adding capacitors.
This power triangle shows apparent power demand on a system before and after adding capacitors. In Figure 6, by installing power capacitors and increasing power factor to 95%, apparent power is reduced from 11.3 MVA to 10.53 MVA (reduction of 6.81%). Theoretically, capacitors could provide 100% of needed reactive power. In practical usage, however, power factor correction to approximately 95% provides maximum benefit.
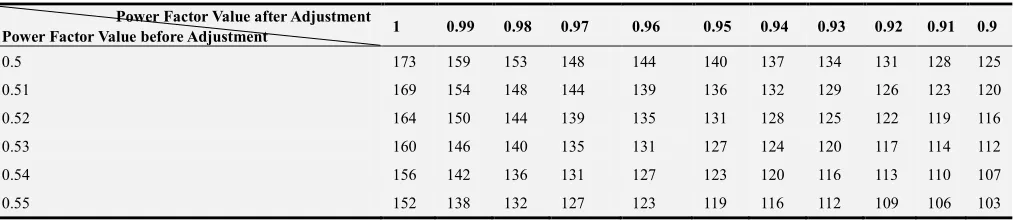
From Table A (Calculation table for capacitor selection) in Appendix,
Multiplying factor =
100 table the from Value (9) 21 . 0 100 21 = =
Capacitor Rating = Mutiplying Factor×MW Demand (10)
MVAR 3 2.1 10
0.21× = ≈
=
95% is a good economic power factor for industrial purposes. In this paper, this power factor is corrected from 88.5%. Therefore the installation of 3 MVAR capacitor bank is determined for achieving power factor of 95% while providing the same productive power of 10 MW.
6.2. For 45 MVA Main No (2) at 33 kV Bus Bar
Present load (maximum) = 29 MW
Present power factor (maximum) = 86.83%
MVA 33.4 0.8683 29 Present PF load Present Demand A
Present MV = = =
If the power factor is raised to 95%,
MVA 30.53 0.95 29 PF Desired load Present Demand MVA
Desired = = =
The size of the capacitor required to accomplish this is determined from the MVAR at the two values of power factor as follows:
2 2
MW MVA
MVAR= −
MVAR 16.57 29 33.4 PF 86.83% at
MVAR1 = 2− 2 =
MVAR 9.54 29 30.53 PF 95% at
MVAR2 = 2− 2 =
2 1 MVAR
MVAR Rating
Capacitor = −
MVAR 7.03 9.54
16.57− =
=
(At 95% Power Factor)
Figure 7. Required apparent power before and after adding capacitors.
In Figure 7, by installing power capacitors and increasing power factor to 95%, apparent power is reduced from 33.4 MVA to 30.53 MVA (reduction of 8.59%).
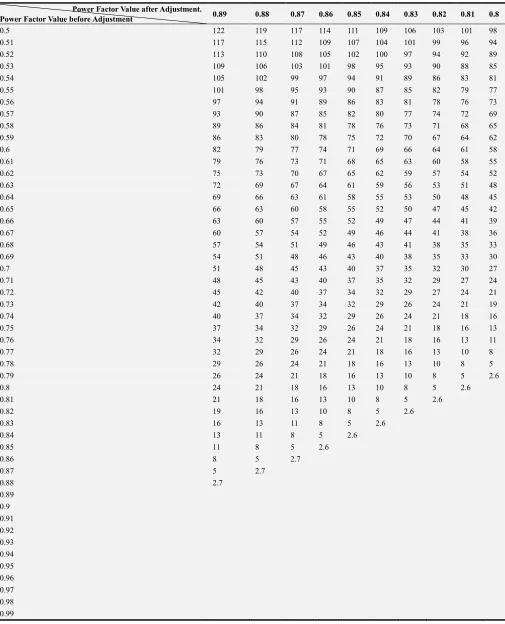
Multiplying factor = 0.26 100
26
=
Capacitor Rating = Mutiplying Factor×MW Demand
MVAR 8 7.54 29
0.26× = ≈
=
95% is a good economic power factor for industrial purposes. In this paper, this power factor is corrected from 86.83%. Therefore the installation of 8 MVAR capacitor bank is determined for achieving power factor of 95% while providing the same productive power of 29 MW.
7. Check Calculation for After
Installation of Capacitor Banks
7.1. For 45 MVA Main No (1) at 66 kV Bus Bar
MVAR 2.45 4.7 5.3 MW MVA
MVAR1= 2− 2 = 2− 2 = MVAR2=MVAR1−Capacitor Rating=2.45-3=-0.55 MVAR
MVAR 7321 . 4 4.7 (-0.55) MW MVAR
MVA2= 2+ 2 = 2+ 2 =
0.99 4.7321
4.7 or
Power Fact = =
2) For Maximum Load Condition
MVAR 5.262 10 11.3 MW MVA
MVAR1= 2− 2 = 2− 2 =
MVAR 2.262 3 -5.262 Rating Capacitor MVAR
MVAR2= 1− = =
MVAR 10.253 2 10 2 2.262 2 MW 2 MVAR
MVA2= + = + =
0.98 10.253
10 or
Power Fact = =
7.2. For 45 MVA Main No (2) at 33 kV Bus Bar
1) For Minimum Load Condition
MVAR 9.09 16 18.4 MW MVA
MVAR1= 2− 2 = 2− 2 = MVAR2=MVAR1−Capacitor Rating=9.09-8=1.09 MVAR
MVAR 16.04 2 16 2 1.09 2 MW 2 MVAR
MVA2= + = + = 0.99
16.04 16 or
Power Fact = =
2) For Maximum Load Condition
MVAR 16.57 29 33.4 MW MVA
MVAR1= 2− 2 = 2− 2 = MVAR2=MVAR1−Capacitor Rating=16.57-8=8.57 MVAR
MVAR 30.24 2 29 2 8.57 2 MW 2 MVAR
MVA2 = + = + = 0.959
30.24 29 or
Power Fact = =
8. Voltage Rise
8.1. For 45 MVA Main No (1) at 66 kV Bus Bar
The approximate voltage change due to capacitors at a transformer secondary bus is determined by using the following equation: r MVA Transforme e r Reactanc Transforme % MVAR Capacitor Rise Voltage
% = × (11)
Capacitor Rating = 3 MVAR
Transformer Reactance = 15%
Transformer MVA = 45 MVA
% Voltage Rise = × =
45 15 3
1%
8.2. For 45 MVA Main No (2) at 33 kV Bus Bar
Capacitor Rating = 8 MVAR
Transformer Reactance = 15%
Transformer MVA = 45 MVA
% Voltage Rise = × =
45 15 8
2.67%
The voltage regulation of a system from no-load to full-load is practically unaffected by the amount of capacitors, unless the capacitors are switch. However, the addition of capacitors can raise the voltage level. The voltage rise due to capacitors in most industrial plants with modern power distribution system and a single transformation is rarely more than a few percent.
9. Line Current and Lower Losses
9.1. Line current Reduction
9.1.1. For 45 MVA Main No (1) at 66 kV Bus Bar
The percent line current reduction may be approximated from this equation.
− × = PF Improved Present PF 1 100 duction Current Re Line
% (12)
% 6.84 0.95 0.885 1
100 =
9.1.2. For 45 MVA Main No (2) at 33 kV Bus Bar
% Line current reduction 8.6%
0.95 0.8683 1
100 =
− × =
9.2. Lower Losses
An estimate of reduction of power losses can be made using following equations.
− × = 2 tor Power Fac Improved wer Factor Present Po 1 100 Reduction Loss
% (13)
9.2.1. For 45 MVA Main No (1) at 66 kV Bus Bar
% 22 . 13 2 95 . 0 885 . 0 1 100 Reduction Loss % = − × =
9.2.2. For 45 MVA Main No (2) at 33 kV Bus Bar
% 46 . 16 2 95 . 0 8683 . 0 1 100 Reduction Loss % = − × =
There is 13.22% reduction in power losses for No (1) and 16.46% reduction in power losses for No (2).
10. Result Data
After installing 3 MVAR and 8 MVAR capacitor banks for the entire substation power factor improvement, the following results are obtained. These results are benefits of this installation.
Table 6. Result Data after Power factor Improvement.
Load Data Value
45 MVA Main No (1) at 66 kV Bus Bar 45 MVA Main No (2) at 33 kV Bus Bar
MW Demand 10 MW 29 MW
Power Factor 95% 95%
Voltage Rise 1% 2.67%
Line Current Reduction 6.84% 8.6%
Power Loss Reduction 13.22% 16.46%
Figure 8. Voltage chart before and after installation 3 MVAR capacitor bank at 66 kV bus.
After installation 3 MVAR capacitor bank at 66 kV bus bar, the lowest power factor 0.8602% becomes 0.9302% and the highest power factor 0.9158% becomes 0.9886%. It is shown in Figure 10.
Figure 10. Power factor chart before and after installation 3 MVAR capacitor bank at 66 kV bus bar.
After installation 8 MVAR capacitor bank at 33 kV bus bar, the lowest power factor 0.8581% becomes 0.9386% and the highest power factor 0.9278% becomes unity power factor. It is shown in Figure 11.
Figure 11. Power factor chart before and after installation 3 MVAR capacitor bank at 33 kV bus bar.
Acknowledgements
The author is grateful to express his gratitude to all persons who were directly or indirectly involved towards the successful completion of this paper.
Appendix
Table A. Calculation Table for Capacitor Selection.
Power Factor Value after Adjustment
Power Factor Value before Adjustment 1 0.99 0.98 0.97 0.96 0.95 0.94 0.93 0.92 0.91 0.9
0.5 173 159 153 148 144 140 137 134 131 128 125
0.51 169 154 148 144 139 136 132 129 126 123 120
0.52 164 150 144 139 135 131 128 125 122 119 116
0.53 160 146 140 135 131 127 124 120 117 114 112
0.54 156 142 136 131 127 123 120 116 113 110 107
Power Factor Value after Adjustment
Power Factor Value before Adjustment 1 0.99 0.98 0.97 0.96 0.95 0.94 0.93 0.92 0.91 0.9
0.56 148 134 128 123 119 115 112 108 105 102 100
0.57 144 130 124 119 115 111 108 105 102 99 96
0.58 140 126 120 115 111 108 104 101 98 95 92
0.59 137 123 117 112 108 104 101 97 94 91 88
0.6 133 119 113 108 104 100 97 94 91 88 85
0.61 130 116 110 105 101 97 94 90 87 84 81
0.62 127 112 106 101 97 94 90 87 84 81 78
0.63 123 109 103 98 94 90 87 84 81 78 75
0.64 120 106 100 95 91 87 84 81 77 74 72
0.65 117 103 97 92 88 84 81 77 74 71 68
0.66 114 100 94 89 85 81 78 74 71 68 65
0.67 111 97 90 86 82 78 75 71 68 65 62
0.68 108 94 88 83 79 75 72 68 65 62 59
0.69 105 91 85 80 76 72 69 65 62 59 56
0.7 102 88 82 77 73 69 66 62 59 56 54
0.71 99 85 79 74 70 66 63 60 57 54 51
0.72 96 82 76 71 67 64 60 57 54 51 48
0.73 94 79 73 69 64 61 57 54 51 48 45
0.74 91 77 71 66 62 58 55 51 48 45 42
0.75 88 74 68 63 59 55 52 49 46 43 40
0.76 86 71 65 60 56 53 49 46 43 40 37
0.77 83 69 63 58 54 50 47 43 40 37 34
0.78 80 66 60 55 51 47 44 41 38 35 32
0.79 78 63 57 53 48 45 41 38 35 32 29
0.8 75 61 55 50 46 42 39 35 32 29 27
0.81 72 58 52 47 43 40 36 33 30 27 24
0.82 70 56 49 45 41 37 34 30 27 24 21
0.83 67 53 47 42 38 34 31 28 25 22 19
0.84 65 50 44 40 35 32 28 25 22 19 16
0.85 62 48 42 37 33 29 26 22 19 16 14
0.86 59 45 39 34 30 26 23 20 17 14 11
0.87 57 42 36 32 28 24 20 17 14 11 8
0.88 54 40 34 29 25 21 18 14 11 8 6
0.89 51 37 31 26 22 18 15 12 9 6 2.8
0.9 48 34 28 23 19 16 12 9 6 2.9
0.91 46 31 25 20 16 13 9 6 3
0.92 43 28 22 18 13 10 6 3.1
0.93 40 25 19 14 10 7 3.2
0.94 36 22 16 11 7 3.4
0.95 33 19 13 8 3.7
0.96 29 15 9 4.1
0.97 25 11 4.8
0.98 20 6
Table A. Continued.
Power Factor Value after Adjustment.
Power Factor Value before Adjustment 0.89 0.88 0.87 0.86 0.85 0.84 0.83 0.82 0.81 0.8
0.5 122 119 117 114 111 109 106 103 101 98
0.51 117 115 112 109 107 104 101 99 96 94
0.52 113 110 108 105 102 100 97 94 92 89
0.53 109 106 103 101 98 95 93 90 88 85
0.54 105 102 99 97 94 91 89 86 83 81
0.55 101 98 95 93 90 87 85 82 79 77
0.56 97 94 91 89 86 83 81 78 76 73
0.57 93 90 87 85 82 80 77 74 72 69
0.58 89 86 84 81 78 76 73 71 68 65
0.59 86 83 80 78 75 72 70 67 64 62
0.6 82 79 77 74 71 69 66 64 61 58
0.61 79 76 73 71 68 65 63 60 58 55
0.62 75 73 70 67 65 62 59 57 54 52
0.63 72 69 67 64 61 59 56 53 51 48
0.64 69 66 63 61 58 55 53 50 48 45
0.65 66 63 60 58 55 52 50 47 45 42
0.66 63 60 57 55 52 49 47 44 41 39
0.67 60 57 54 52 49 46 44 41 38 36
0.68 57 54 51 49 46 43 41 38 35 33
0.69 54 51 48 46 43 40 38 35 33 30
0.7 51 48 45 43 40 37 35 32 30 27
0.71 48 45 43 40 37 35 32 29 27 24
0.72 45 42 40 37 34 32 29 27 24 21
0.73 42 40 37 34 32 29 26 24 21 19
0.74 40 37 34 32 29 26 24 21 18 16
0.75 37 34 32 29 26 24 21 18 16 13
0.76 34 32 29 26 24 21 18 16 13 11
0.77 32 29 26 24 21 18 16 13 10 8
0.78 29 26 24 21 18 16 13 10 8 5
0.79 26 24 21 18 16 13 10 8 5 2.6
0.8 24 21 18 16 13 10 8 5 2.6
0.81 21 18 16 13 10 8 5 2.6
0.82 19 16 13 10 8 5 2.6
0.83 16 13 11 8 5 2.6
0.84 13 11 8 5 2.6
0.85 11 8 5 2.6
0.86 8 5 2.7
0.87 5 2.7
0.88 2.7
0.89
0.9
0.91
0.92
0.93
0.94
0.95
0.96
0.97
0.98
References
[1] Cuttino, W. H., “Extending the Use of Shunt Capacitors by means of Automatic Switching”, AIEE Summer Meeting, St. Louis, Missouri, June 26-30, (1944).
[2] Juan Dixon (SM), “Reactive Power Compensation Technologies” State-of-the-Art Review (Invited Paper), (1957).
[3] Miller T. J. E., “Reactive Power Control in Electrical System”, Corporate research and development center, General Electric Company, Schemectamy, New York., John Wiley & sons Press, (1982).
[4] Samiran Choudhuri, S. P. Choudhury, R. K. Mukhopashyay and T. Choudhury, 1990., “Reactive Power Compensation in
Industrial power Distribution System”, Power System for the Year 2000 and Beyond, Bombay, India.
[5] Juan Dixon (SM), Luis Moran (F), Jose Rodriguez (SM), and Ricardo Domke, “Reactive Power Compensation Technologies”, State-of-the-Art Review, (2000).
[6] Nagrath I. J., “Power System Engineering”, Tata Mc Graw-Hill Publishing Company Limited, (2000).
[7] G. Brunello, B. Kasztenny, C. Wester, “Shunt Capacitor Bank Fundamentals and Protection” Conference for Protective Relay Engineers -Texas A&M University, (2003).
[8] Technical Information, “Power Factor Correction”, Emerson Climate Technologies, Copeland, Application Engineering Europe, April (2004).