Vol.7 (2017) No. 2
ISSN: 2088-5334
Modelling Effect of Aggregate Gradation and Bitumen Content on
Marshall Properties of Asphalt Concrete
Arief Setiawan
#, Latif Budi Suparma
#, Agus Taufik Mulyono
# #Department of Civil and Environmental Engineering, Gadjah Mada University, Jalan Grafika No. 2, Yogyakarta, 55281, Indonesia E-mail: [email protected], [email protected], [email protected]
Abstract— Current selection of aggregate gradation fails to explain completely the position of the aggregate gradation on a continuous
scale. This study proposes a gradation index (GI) as a new parameter to determine the position of the aggregate gradation of the asphalt mixture on the continuous scale. The GI was used to develop a model of the Marshall properties. The aim of this study was to develop a model between the GI and bitumen content of the Marshall properties that includes density, voids in the mix (VIM), voids in mineral aggregate (VMA), voids filled with asphalt (VFA), stability, and flow. The materials used were unmodified Asphalt Cement 60/70 with bitumen content variation of 4.5% to 8.0% of the mix and five variations of the aggregate gradation. Curve fitting method is used to find partial correlation factor of the aggregate gradation and the bitumen content of the Marshall properties. Multiple Polynomial Regression (MPR) models were specified to find the relationship between the GI and bitumen content of the Marshall properties. The visualization of the relationship between the GI, bitumen content and Marshall properties used contour charts. The results showed that the MPR determines the model of the relationship between the GI and bitumen content of the density, VIM, VMA, VFA, stability, and flow that have a very strong relationship (R2 > 0.9). Therefore, the model can be used to predict the
Marshall properties.
Keywords— gradation index; asphalt concrete; Marshall properties; multiple polynomial regression
I. INTRODUCTION
Aggregate gradation strongly influences the characteristics of asphalt mixture, namely stiffness, stability, durability, permeability, workability, fatigue resistance, skid resistance, and resistance to moisture damage [1], [2]. The aggregate gradation is assigned to the mid-range as the target of the gradation with the assumption that the value of the center is the gradation that gives the best performance.
Some researchers have conducted studies related to the aggregate gradation. Twelve mixtures were evaluated with several combinations of parameters to examine the relationship between the aggregate gradation with moisture damage and rutting [3]. The combination of the parameters includes the three types of the aggregate gradation (upper limit, mid range, and lower limit), the two types of asphalt (conventional and modified asphalt), and the two types of mixtures (bituminous concrete and dense bituminous macadam). Gradation ratio was formulated to predict rutting and moisture damage of the asphalt mixture. The results showed that the ratio of the gradation could be used to predict the rutting and moisture damage. The formulation ratio of the gradation only specifies certain sieve diameter that does not represent the overall sieve in determining the aggregate gradation.
Band specification is divided into several segments as the upper limit of the range variation has upper variation, the mid range has mid-variation, and the lower limit has lower variation [4]. The results showed that the changes of the aggregate gradation affect the Marshall properties, namely stability, flow, air voids, void in mineral aggregate, creep stiffness and permanent deformation. The range of the variation in the specification band did not quantify the aggregate gradation position, so it could not be able to show any changes in the behavior of the aggregate gradation
Encoding can be used to identify changes in the aggregate gradation [5]. Code for fine aggregate gradation (upper limit) is +1, for the coarse aggregate gradation (lower limit) is -1, and for the middle of aggregate gradation is between 0 and +1 and 0 and -1. This encoding does not indicate the actual position of the aggregate gradation by the argument that it interprets the behaviour of the asphalt mixture. Thus, a quantitative classification with continuous scale is needed[6].
that can pass on the aggregate in a certain amount. Determining the size of a particular sieve diameter does not represent the whole sieving. A shape factor determines the shape of the gradation by the fuller equation. But not all the boundaries of the gradations in the specification have a specific shape factor value unless the aggregate gradation has certain shape factor and determination coefficient (R2) above 0.9. Rated G/S showed that the greater it is, the coarser aggregate gradation is or vice versa. The aggregate gradation in the gravel and sand can not be defined precisely if the gradation does not have the specific shape factor.
Gradation index (GI) was proposed in this study to quantify actual position of the aggregate gradation. The GI can also be used to determine if the aggregate gradation is finer or coarser. Thus, the purpose of this study was to determine the GI and bitumen content effect on the Marshall properties. The model with the GI and bitumen content as independent variables were expected to be used to predict the Marshall properties of the asphalt mixture as the dependent variable.
II. MATERIAL AND METHOD
A. Material Selection
Unmodified asphalt cement (AC) 60/70 ex. Pertamina was used as a binder. The asphalt AC 60/70 is recommended by the Indonesian Directorate General of Highways according to the tropical climate in Indonesia [9]. The bitumen test results meet the requirements of Indonesian Highway Specification [9].
The aggregate obtained from the Tinalah River, Kulon Progo, Yogyakarta Indonesia is one of the quarries to the construction of roads and buildings in Yogyakarta and surrounding areas. The aggregate test results have complied the requirements of the Indonesian Highway Specification [9]. The selection of the aggregate gradation was based the 2010 Indonesian Highway Specification of the third revised edition for asphalt concrete wearing course [9] by five types of the aggregate gradations, namely (1) upper limit or UL; (2) The middle of the lower limit and the mid-range or UM; (3) mid-range or MR; (4) middle of mid-range and upper limit or ML; and (5) lower limit or LL as seen in Fig. 1.
Fig. 1 Types of aggregate gradation
B. Mix Design
Marshall method is used for designing mixture and determining the stability, flow, void in the mix (VIM), voids filled with asphalt (VFA), and voids in mineral aggregate (VMA) of each gradation type of mixture. Fifteen specimens were prepared for each gradation with bitumen content variation of 4.5% to 6.5% of the mix, interval 0.5% for UM, MR, and ML gradation; UL gradation using bitumen content variation 5% to 7% at intervals of 0.5%; and gradation LL variation bitumen content of 6% to 8% with intervals of 0.5%. Mixing and compaction temperatures were measured at the viscosity of 0.2 Pa.s and 0.4 Pa.s [9], respectively. The test results showed that the mixing and compaction temperatures are 157 °C and 143 °C, respectively.
C. Gradation Index (GI)
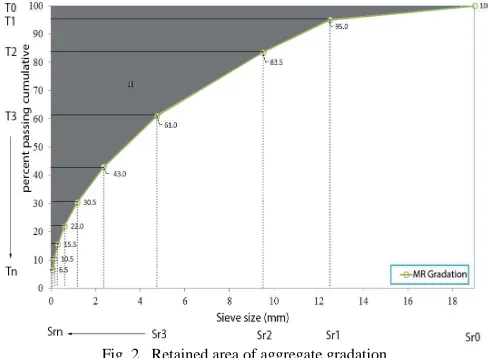
The gradation index (GI) proposed in this study was to quantify the actual position of the aggregate gradation, the relationship that constantly determines the effect of the treatment on the aggregate gradation and determines if the gradation is coarser or finer. The GI is defined as the ratio of the area of the retained area curve and the total area of the aggregate gradation curve [11]. The calculation is defined in Equation 1 and 2 with an illustration presented in Fig. 2. The advantage of the GI is to take into account all the sieve size, unlike the research [5,6,7,8] that did only on certain sieve diameter. Another advantage of the GI is a simple calculation.
GI = (a/A) 100 (1)
(
)
(
Ti Ti 1)
n 0
i 2i 1
Sr i Sr
a=∑= + + − +
(2)
where the GI is gradation index (%), a is area retained of the curve (mm2), A is total area (mm2), Sr is sieve size (mm), and T is cumulative retained aggregate [10%=10mm](mm).
Fig. 2 Retained area of aggregate gradation
D. Model Development
indicates that the independent variables are selected to explain the dependent variable for R2 [5], [10], [12]. All residuals are zero and thus R2 = 1.0, so the fit is perfect [12]. The relationship between the bitumen content and the Marshall properties used by quadratic polynomial regression models is shown in Equation 3, while the relationship between the GI and bitumen content using multiple polynomial regression by the proposal of Montgomery [13] is shown in Equation 4.
ij ij ij ij ij
ij a X b X c
Y = 2+ +
Where aij, bij and cij are the regression coefficients, i is the
coefficient of the bitumen content and j is the coefficients of the Marshall properties (density, VFA, VIM, VMA, stability and flow).
j
i ji ij i
i ii i
i biXi b X b X X
b
Y= +∑= +∑= +∑ ∑=1 =+1 2
1 2 2
1 0
Where Y is response variables (i.e. density, VFA, VIM, VMA, stability, and flow) and b0, bi,bii,bij are constant
coefficients of intercept, linear, quadratic and interaction terms, respectively, and Xi and Xj represent the two
independent.
III.RESULTS AND DISCUSSION
A. Effect of Bitumen on Marshall Properties
The results of the Marshall test on the five aggregate gradations and the Marshall properties are shown in Table 1.
TABLEI
MARSHALL PROPERTIES OF THE ASPHALT MIXTURE
1. UL aggregate gradation
Properties Bitumen contents
4.5* 5.0 5.5 6.0 6.5 7.0 7.5* 8.0*
Density 2.30 2.33 2.35 2.36 2.37 2.38 2.38 2.38
VFA 49.54 59.24 67.93 75.89 82.88 88.90 94.09 98.36
VIM 8.46 6.72 5.18 3.86 2.75 1.81 1.12 0.60
VMA 17.00 16.49 16.14 16.01 16.08 16.29 16.73 17.34
Stability 1563.14 1798.74 1890.50 1978.30 1944.78 1791.21 1586.84 1284.80
Flow 2.81 2.80 3.00 3.20 3.45 4.00 4.52 5.18
2. UM aggregate gradation
Properties Bitumen contents
4.5 5.0 5.5 6.0 6.5 7.0* 7.5* 8.0*
Density 2.29 2.33 2.35 2.38 2.39 2.39 2.39 2.37
VFA 47.98 59.13 68.54 77.64 85.56 92.49 98.48 103.50
VIM 8.96 6.58 4.98 3.45 2.22 1.44 0.96 0.82
VMA 17.23 16.10 15.71 15.39 15.36 15.75 16.43 17.44
Stability 1535.73 1655.73 1781.25 1823.01 1901.74 1926.09 1932.86 1915.87
Flow 3.00 3.07 3.23 3.43 3.57 3.79 4.03 4.28
3. MR aggregate gradation
Properties Bitumen contents
4.5 5.0 5.5 6.0 6.5 7.0* 7.5* 8.0*
Density 2.30 2.34 2.36 2.37 2.38 2.38 2.37 2.35
VFA 53.07 64.23 73.31 81.74 88.89 94.66 99.24 102.58
VIM 7.80 5.61 4.10 2.78 1.72 1.12 0.84 0.90
VMA 16.60 15.66 15.35 15.22 15.33 15.88 16.72 17.89
Stability 1520.93 1700.82 1753.58 1790.30 1770.40 1676.3 1527.4 1319.1
Flow 3.07 3.03 3.17 3.47 3.73 4.20 4.76 5.43
4. ML aggregate gradation
Properties Bitumen contents
4.5 5.0 5.5 6 6.5 7.0* 7.5* 8.0*
Density 2.28 2.32 2.34 2.35 2.36 2.36 2.36 2.35
VFA 53.96 64.16 72.14 80.84 87.37 93.44 98.48 102.57
VIM 7.79 5.78 4.45 3.01 2.01 1.25 0.77 0.55
VMA 16.91 16.13 15.96 15.73 15.87 16.27 16.92 17.82
Stability 1397.55 1534.03 1590.37 1556.10 1469.49 1291.17 1039.38 710.92
Flow 3.10 3.30 3.50 3.80 4.07 4.40 4.76 5.16
5. LL aggregate gradation
Properties Bitumen contents
4.5* 5.0* 5.5* 6.0 6.5 7.0 7.5 8.0
Density 2.20 2.24 2.26 2.29 2.31 2.32 2.33 2.34
VFA 34.52 44.25 53.31 61.74 69.34 76.25 83.00 88.30
VIM 12.24 10.29 8.50 6.88 5.43 4.19 3.00 2.10
VMA 19.68 18.96 18.38 17.97 17.70 17.63 17.62 17.86
Stability 811.59 985.60 1119.87 1204.67 1287.02 1288.95 1235.31 1206.33
Flow 4.57 4.53 4.52 4.53 4.57 4.60 4.73 4.80
* calculated by the model
(3)
The density and volumetric data are obtained from the average measurement result of the Marshall specimens. The average value of the stability and flow was obtained from the Marshall test.
Table 2 shows the results of the modelling the relationship between the Marshall properties and bitumen content variation with a quadratic polynomial model. The R2 of the models are above 0.9. The density, the higher of the bitumen content raises the density value served as an adhesive, but after reaching the peak, increasing bitumen content will lower density because of the bitumen changes to the lubricant. Consequently, it is difficult to compact the aggregate. VFA, adding the bitumen content, will increase the bitumen that fills the voids between the aggregate, so the higher bitumen will raise VFA. VIM has the opposite trend with the VFA. The higher bitumen will lower the VIM because the bitumen will reduce air void in the mix. VMA is the air void plus the volume of the bitumen as a binder. The addition of the bitumen content will reduce the VMA to the minimum value and then it will rise. The increasing of VMA after it reaches the minimum caused by increasing the bitumen content and the density decrease.
TABLEII
QUADRATIC POLYNOMIAL OF MARSHALL PROPERTIES ON BITUMEN
CONTENTS
Properties Equations R2
1. UL or GI = 18.65
Density y = -0.0103x2 + 0.1511x + 1.8275 0.9998 VFA y = -1.8028x2 + 36.484x - 78.131 0.9999 VIM y = 0.4029x2 - 7.2844x + 33.064 0.9999 VMA y = 0.3763x2 - 4.606x + 30.105 0.9961 Stability y = -174.85x2 + 2106.1x - 4373.6 0.9456 Flow y = 0.2143x2 - 2.0014x +7.4771 0.9889 2. UM or GI = 21.53
Density y = -0.0175x2 + 0.2423x + 1.5532 0.9965 VFA y = -1.9311x2 + 39.975x - 92.712 0.9999 VIM y = 0.6774x2 - 10.777x + 43.682 0.9987 VMA y = 0.6464x2 - 8.0033x + 40.098 0.9872 Stability y = -47.518x2 + 702.55x - 663.38 0.9913 Flow y = 0.0476x2 - 0.2238x + 3.0267 0.9878 3. MR or GI = 24.41
Density y = -0.0177x2 + 0.2361x + 1.5963 0.9968 VFA y = -2.4789x2 + 45.099x - 99.567 0.9998 VIM y = 0.6953x2 - 10.647x + 41.579 0.9990 VMA y = 0.6516x2 - 7.764x + 38.298 0.9844 Stability y = -118.74x2 + 1423.9x - 2472.7 0.9827 Flow y = 0.219x2 - 2.0562x + 7.8667 0.9873 4. ML or GI = 27.29
Density y = -0.0138x2 + 0.1897x + 1.7112 0.9952
VFA y = -1.8917x2 + 37.511x - 76.447 0.9993 VIM y = 0.5409x2 - 8.8161x + 36.462 0.9985 VMA y = 0.5101x2 - 6.1042x + 34.009 0.9713 Stability y = -153.37x2 + 1720.3x - 3235.8 0.9953 Flow y = 0.0667x2 - 0.2467x + 2.86 0.9985 5. LL or GI = 30.17
Density y = -0.0084x2 + 0.1447x + 1.7218 0.9991 VFA y = -1.36x2 + 32.395x - 83.721 0.9998 VIM y = 0.3336x2 - 7.07x + 37.296 0.9998 VMA y = 0.3095x2 - 4.3938x + 33.188 0.9784 Stability y = -79.492x2 + 1103.2x - 2543.1 0.8339 Flow y = 0.0476x2 - 0.5267x + 5.9762 0.9722
B. Effect of Gradation Index (GI) on Marshall Properties
Table 3 shows that quadratic polynomial is suitable for modelling of the GI and Marshall properties (i.e. density, VFA, VIM, VMA, stability, and flow).
TABLEIII
QUADRATIC POLYNOMIAL OF GI AND MARSHALL PROPERTIES
Bitumen
contents Equations R
2
1. Gradation Index versus Density
4.5 y = -0.0014x2 + 0.0634x + 1.6074 0.8735 5.0 y = -0.0017x2 + 0.0782x + 1.4654 0.9374 5.5 y = -0.0016x2 + 0.0706x + 1.5758 0.9639 6.0 y = -0.0015x2 + 0.069x + 1.6095 0.9760 6.5 y = -0.0014x2 + 0.0611x + 1.7092 0.9927 7.0 y = -0.001x2 + 0.043x + 1.9226 0.9965 7.5 y = -0.0005x2 + 0.0197x + 2.1864 0.9878 8.0+ y = 9E-05x2 - 0.008x + 2.4965 0.9622 2. Gradation Index versus VFA
4.5 y = -0.3439x2 + 15.954x - 130.97 0.7017 5.0 y = -0.3852x2 + 17.937x - 143.73 0.7654
5.5 y = -0.3856x2 + 17.934x - 134.56 0.8144 6.0 y = -0.4019x2 + 18.75x - 135.94 0.8367 6.5 y = -0.3983x2 + 18.567x - 126.47 0.8786 7.0 y = -0.3869x2 + 18.039x - 114.26 0.8995
7.5 y = -0.355x2 + 16.558x - 92.128 0.9160 8.0+ y = -0.3262x2 + 15.191x - 71.998 0.9143 3. Gradation Index versus VIM
4.5 y = 0.0778x2 - 3.5769x + 48.705 0.7248 5.0 y = 0.0898x2 - 4.1651x + 53.654 0.8141 5.5 y = 0.0837x2 - 3.8713x + 48.706 0.8443 6.0 y = 0.0815x2 - 3.7838x + 46.442 0.8608
6.5 y = 0.0749x2 - 3.4804x + 41.881 0.8901 7.0 y = 0.0608x2 - 2.809x + 33.295 0.8752 7.5 y = 0.0416x2 - 1.9061x + 22.397 0.8345 8.0+ y = 0.0191x2 - 0.8398x + 9.77 0.6813 4. Gradation Index versus VMA
4.5 y = 0.0518x2 - 2.3536x + 43.208 0.8227 5.0 y = 0.0632x2 - 2.9149x + 49.09 0.9145 5.5 y = 0.0575x2 - 2.6404x + 45.57 0.9477 6.0 y = 0.0551x2 - 2.5432x + 44.386 0.9649 6.5 y = 0.0488x2 - 2.2504x + 41.132 0.9885 7.0 y = 0.035x2 - 1.5971x + 33.92 0.9886 7.5 y = 0.0163x2 - 0.7154x + 24.385 0.9709 8.0+ y = -0.0055x2 + 0.319x + 13.268 0.8614 5. Gradation Index versus Stability
4.5 y = -10.548x2 + 457.94x - 3352.4 0.9416
5.0 y = -8.8013x2 + 368.96x - 2081.2 0.9197 5.5 y = -7.3842x2 + 300.34x - 1181.8 0.9588 6.0 y = -5.1099x2 + 186.47x + 248.15 0.9776
6.5 y = -3.8591x2 + 127.72x + 920.46 0.9809 7.0 y = -3.5251x2 + 115.17x + 942.21 0.8240 7.5 y = -3.2943x2 + 105.4x + 909.09 0.5628 8.0+ y = -2.4338x2 + 71.533x + 1031.7 0.2602
6. Gradation Index versus Flow
Almost all R2s are more than 0.9. The density at the same bitumen content, higher GI will increase the density until it reaches the peak and then it decreases. Additionally, it also shows that the aggregate gradation that is close to the upper limit is a denser gradation. The denser aggregate gradation means that more bitumen fills voids (VFA). As a result, the air void (VIM) and VMA are getting low. The stability at close to upper limit is higher than others because the aggregate gradation is denser. The higher GI at the same bitumen content will raise the flow because the bitumen contents are not enough to make asphalt mixture stiffer. Thus, it has a higher flow value. The higher flow decreases the deformation resistance. However, The higher flow has no problem if stability Marshall flow ratio or Marshall quotient is increased. Specification requirement for the Marshall quotient is more than 250 kg/mm [14].
The bitumen content of 8.0 (% of mix) will be eliminated from the modelling because it has a different trend line with another bitumen contents (4.5% to 7.5%). Besides that, the relationship between the GI, stability, and flow has the lowest coefficient of determination (R2). Table 3 shows that the GI could show the behaviour of the asphalt mixture.
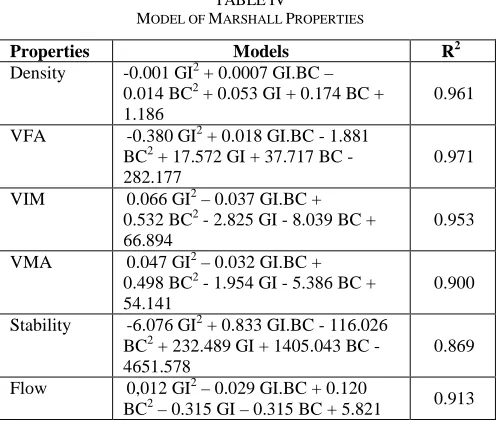
C. Model Development of Gradation Index (GI) and Bitumen Content on Marshall Properties
Based on the results presented in Table 2 and Table 3, the modelling of the GI and bitumen content could be developed with multiple polynomial regressions to get the equation to predict the value of the Marshall properties as the response variable. The models are shown in Table 4, where the GI is the gradation index, and BC is the bitumen content.
TABLEIV
MODEL OF MARSHALL PROPERTIES
Properties Models R2
Density -0.001 GI2 + 0.0007 GI.BC – 0.014 BC2 + 0.053 GI + 0.174 BC + 1.186
0.961
VFA -0.380 GI2 + 0.018 GI.BC - 1.881 BC2 + 17.572 GI + 37.717 BC -
282.177
0.971
VIM 0.066 GI2 – 0.037 GI.BC + 0.532 BC2 - 2.825 GI - 8.039 BC + 66.894
0.953
VMA 0.047 GI2 – 0.032 GI.BC + 0.498 BC2 - 1.954 GI - 5.386 BC + 54.141
0.900
Stability -6.076 GI2 + 0.833 GI.BC - 116.026 BC2 + 232.489 GI + 1405.043 BC -
4651.578
0.869
Flow 0,012 GI2 – 0.029 GI.BC + 0.120
BC2 – 0.315 GI – 0.315 BC + 5.821 0.913
The graphs in Fig. 3 to Fig. 8 can be used to look at the overall trend and predict the value of the Marshall properties resulting from the changes in the bitumen content and GI. The graphs created for visualization models in Table 4 are the contour types. The selection of the types of the graphs is that they are very easy to use and fast in predicting the Marshall properties.
Fig. 3 Contour plot of density versus bitumen content and gradation index
Fig. 4 Contour plot of VFA versus bitumen content and gradation index
Fig. 5 Contour plot of VIM versus bitumen content and gradation index
Fig. 7 Contour plot of stability versus bitumen content and gradation index
Fig. 8 Contour plot of flow versus bitumen content and gradation index
The modelling methods used in this study were also able to be applied in the gradation changes for other aggregates. Thus, they produced a new equation. The new equation with a factor of change in the gradation by the GI gives choices of the gradation because it is not only a factor of the bitumen content that is just to reach a certain performance of the asphalt mixtures, but it also looks at the aggregate gradation changes.
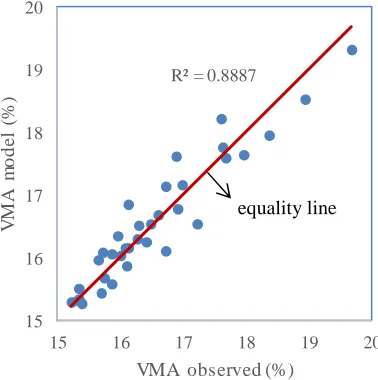
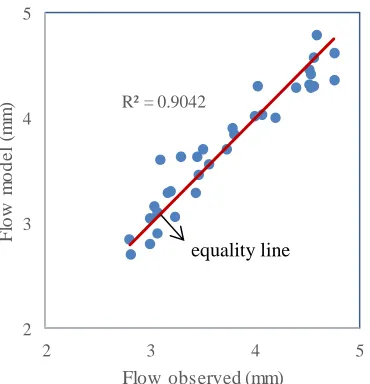
Fig. 9 to Fig. 13 shows the correlation of Marshall characteristics between the model and the observed. The equality line shows the position of the model and the observed at the same value. The coefficient of determination (R2) showed that the relationship between the model and the observed are strong with the R2s more than 0.8.
Fig. 9 Correlation of density between the experimental result and the model
Fig. 10 Correlation of VFA between the experimental result and the model
R² = 0.9529
0 2 4 6 8 10 12 14
0 2 4 6 8 10 12 14
V
IM
m
o
d
e
l
(%
)
VIM observed (%)
Fig. 11 Correlation of VIM between the experimental result and the model
R² = 0.8887
15 16 17 18 19 20
15 16 17 18 19 20
V
M
A
m
o
d
e
l
(%
)
VMA observed (%)
Fig. 12 Correlation of VMA between the experimental result and the model
R² = 0.9578
2.20 2.25 2.30 2.35 2.40
2.20 2.25 2.30 2.35 2.40
d
en
si
ty
m
o
d
el
(
g
/c
m
^3
)
density observed (g/cm^3)
equality
R² = 0.9701
30 40 50 60 70 80 90 100 110
30 40 50 60 70 80 90 100 110
V
F
A
m
o
d
e
l
(%
)
VFA observed (%)
equality line
equality line
R² = 0.8494
500 1000 1500 2000
500 1000 1500 2000
S
ta
b
il
it
y
m
o
d
e
l
(k
g
)
Stability observed (kg)
Fig. 13 Correlation of Stability between the experimental result and the model
R² = 0.9042
2 3 4 5
2 3 4 5
F
lo
w
m
o
d
e
l
(m
m
)
Flow observed (mm)
Fig. 14 Correlation of flow between the experimental result and the model
IV.CONCLUSIONS
This study was conducted to determine the gradation effect index and bitumen content on the Marshall properties in a model. The following conclusions were made based on the experimental results:
• Multiple polynomial regression is suitable to develop the model of the Marshall properties with the aggregate gradation and bitumen content as independent variables.
• The coefficients of the determination of the model are more than 0.9. Therefore, the model can be used to predict the Marshall properties on the bitumen content and certain aggregate gradation.
• The GI can show the behaviour of the Marshall properties.
• The estimation of the optimum bitumen content comply with the specification by entering the GI and bitumen content will provide many options for designers asphalt mixture to meet the specification criteria.
REFERENCES
[1] F. L. Roberts, P. S. Kandhal, E. R. Brown, D.-Y. Lee, T. W. Kennedy, Hot Mix Asphalt Materials, Mixture Design, and Construction, First Ed., United States of America: NAPA Education Foundation 5100 Forbes Blvd. Lanham, Maryland 20706-4413, 1991.
[2] P. G. Lavin, Asphalt Pavements, London: Spon Press, 2003.
[3] H. Habeeb, S. Chandra, and Y. Nashaat, “Estimation of moisture damage and permanent deformation in asphalt mixture from aggregate gradation,” Korean Society of Civil Engineers (KSCE) Journal of Civil Engineering, vol. 18, no. 6, pp. 1655–1663, July 2014.
[4] A. Golalipour, E. Jamshidi, Y. Niazi, Z. Afsharikia, and M. Khadem, “Effect of Aggregate Gradation on Rutting of Asphalt Pavements,” Procedia Social Behavioral Sciences, 2012, vol.53, pp. 440–449. [5] A. Khodaii, H. F. Haghshenas, and H. Kazemi Tehrani, “Effect of
grading and lime content on HMA stripping using statistical methodology,” Construction Building Material, vol. 34, pp. 131–135, Sept. 2012.
[6] F. J. Sánchez-leal, “Gradation Chart for Asphalt Mixes: Development,” Journal of Materials in Civil Engineering, American Society of Civil Engineers (ASCE), vol. 19, no. 2, pp. 185–197, February 1, 2007. [7] E. Sangsefidi, H. Ziari, and M. Sangsefidi, “The effect of aggregate
gradation on creep and moisture susceptibility performance of warm mix asphalt,” Korean Society of Civil Engineers (KSCE) Journal of Civil Engineering, vol. 20, no. 1, pp. 385–392, 2016.
[8] M. Wahyudi, “Evaluasi teknik pemadatan dan faktor-faktor yang berpengaruh terhadap karakteristik campuran aspal berbatuan besar,” Prosiding Simposium III Forum Studi Transportasi antar Perguruan Tinggi, 2000.
[9] Ditjend Bina Marga, Divisi 6: Perkerasan Beraspal, Spesifikasi Umum, Revisi 3, Edisi 2010, pp. 1-89, 2014.
[10] S. P. Hadiwardoyo, E. S. Sinaga, and H. Fikri, “The influence of Buton asphalt additive on skid resistance based on penetration index and temperature,” Construction Building Material, vol. 42, pp. 100-108, 2013.
[11] A. Setiawan, L.B. Suparma, and A. T. Mulyono, “The Effect of Aggregate gradation on Workability of Asphalt Concrete,” International Journal of Engineering and Technology (IJET), vol. 8, no. 4, pp. 1750-1757, Aug-Sept. 2016.
[12] R. E. Walpole, R. H. Myers, and S. L. Myers, K. Ye. Probability & Statistics for Engineers Scientists, 8th Edition, Pearson Education International, 2007.
[13] D. C. Montgomery, Design and Analysis of Experiments, 5th Edition, United States of America: John Wiley and Sons, 2001.
[14] Ditjend Bina Marga, Divisi 6: Perkerasan Beraspal, Spesifikasi Umum, Revisi 2, Edisi 2010, pp. 1-87, 2013.
equality line