Vol.7 (2017) No. 1
ISSN: 2088-5334
Accelerator-Based Human Activity Recognition Using Voting
Technique with NBTree and MLP Classifiers
Muhammad Sufyian Mohd Azmi
#and Md Nasir Sulaiman
* #College of Computer Science and Technology, Universiti Tenaga Nasional, Kajang, 43000, Malaysia E-mail: [email protected]
* Faculty of Computer Science and Technology, Universiti Putra Malaysia, Kajang, 43000, Malaysia E-mail: [email protected]
Abstract— In evolution and ubiquitous computing systems, accelerometer-based human activity recognition has huge potential in a
large number of application domains. Accelerometer-based human activity recognition aims to identify physical activities performed by human using accelerometer; a sensor device attached to the body and returns an actual valued estimate of acceleration along the x, y- and z-axes from which the sensor location can be estimated. In this study, an accelerator-based activity recognition model using voting technique was proposed. Two machine learning classifiers, Naïve Bayes Tree (NBTree) and Multilayer Perceptron (MLP), were used as ensemble classifiers in the voting technique. To evaluate the proposed voting technique, the performance of selected individual classifiers and existing voting technique was first examined, followed by the experiment to determine the performance of the proposed model. All of the experiments were performed using a standard dataset called Wireless Sensor Data Mining involving six physical human activities; jogging, walking, walking towards upstairs, walking towards downstairs, sitting and stand still. Results showed that the proposed voting technique with NBTree and MLP ensemble classifiers outperformed other individual classifiers and another previously suggested voting technique for accelerometer-based human activity recognition.
Keywords— ensemble classifier; human activity recognition; machine learning; voting model.
I. INTRODUCTION
Human activity recognition is an important yet challenging research area with many applications in healthcare, smart environments, and homeland security. One of the important areas in machine learning research is human activity recognition (HAR). This is due to its significant assistance in human-centred study that the objective is to improve people’s life quality. Nowadays, many applications where HAR systems are used, for instance, the continuous monitoring of patients with motor problems to provide health diagnosis and medication tailoring [1], and the auto-mated surveillance of public places for crime prevention [2].
Data play an important role in human activity recognition. Data will give us the pattern to be use for prediction of human activity. There are two approaches of data collection for activity recognition that comprehensively researched. First method is based on environmental sensors such as closed-circuit television cam-era to trace location, interaction of the object and motion movement. Meanwhile, for second method uses human attached sensors (wearable sensors) to track the acceleration of specific part of the
human body and also the body as a whole. These two approaches have showed remarkable achievements in a constrained of laboratory settings [3]. Environmental and wearable sensors recently actively use for HAR [4]. Digital video cameras, microphones, global positioning system (GPS) and sensors for measuring of similarity or dissimilarity, body motion and vital signs are just a few examples.
The environmental sensors are generally bigger in size and more expensive. Additionally, user’s privacy is a critical issue as the use of camera will be limited in selected location. Furthermore, they must also be physically connected via wired and have their batteries maintained. These require huge costs in setting up and maintaining the system. Wearable sensors on the other hand require two and more device and need user effort to wear and maintain the device or otherwise the sensor cannot be use for collecting the required data. Fortunately, recent developments in wearable sensing technologies such as inertial and vital sign sensors are offering minimal invasive as alternatives for HAR [5].
sensors, light sensors, inertial sensors (accelerometers and gyroscopes), and direction sensors (compass). An accelerometer sensor is a sensor used to measure acceleration forces. Such forces may be static, like the continuous force of gravity or, as is the case with many mobile devices, dynamic to sense movement or vibrations as shown in Fig. 1.
These accelerometers are capable of detecting the orientation of the device (helped by the fact that they can detect the direction of Earth’s gravity), which can provide useful information for activity recognition. Accelerometers were initially included in these devices to support advanced game play and to enable automatic screen rotation but they clearly have many other applications. In fact, there are many useful applications that can be built if accelerometers can be used to recognize a user’s activity. For example, we can automatically monitor a user’s activity level and generate daily, weekly, and monthly activity reports, which could be automatically emailed to the user. These reports would indicate an overall activity level, which could be used to gauge if the user is getting an adequate amount of exercise and estimate the number of daily calories expended. These reports could be used to encourage healthy practices and might alert some users to how sedentary they or their children actually are. The activity information can also be used to automatically customize the behaviour of the mobile phone. For example, music could automatically be selected to match the activity (e.g., “upbeat” music when the user is running) or send calls directly to voicemail when the user is exercising. There are undoubtedly numerous other instances where it would be helpful to modify the behaviour of the phone based on the user activity and we expect that many such applications will become available over the next decade.
In this research, we explored the use of smart phone accelerometer in recognizing six identified activities through the development of an accelerator-based human activity recognition model using voting technique with two ensemble classifiers; NBTree classifier and MLP classifier. Although many techniques were discovered for activity recognition in previous research, but still, there was no claim which technique is the best because normally researchers used their own experiment datasets instead of publically datasets. Our research objective is to do the accuracy comparison be-tween our model performance with the accuracy from the previous study done by [6]. The result of the comparison is significant because we applied our model on the standard the public dataset used by [6] and we repeat the same experiment to obtain their claimed accuracy.
Our aim was to produce the best model with the model suggested in [6] and therefore, we made experiments and do the comparison with their result. For the purpose of evaluation, wireless sensor data mining (WISDM) [7], a publically available dataset was used. Results obtained showed that the accuracy achieved outperformed from the previous voting technique. Currently, there have been many human activity recognition approaches proposed in the literature. Many machine learning techniques or model used to recognize the human activities for example, Support Vector Machines, Decision Trees, Hidden Markov Models, K-Nearest Neighbour, Conditional Random Fields, were
widely used in human activity recognition studies [3][8][9][10][11].
Some of the activity recognition work focused on the use of more than one accelerometer sensor and possibly combine with other sensors. For example, in [12] developed an automatic physical activities recognition system in a controlled environment using accelerometers and microphones. Another example, method to classify an activity of wavelet that using one or more accelerometers sensor was proposed by [13] where the dynamic motion component was separated from the gravity components that managed to achieved 98.4% accuracy. Meanwhile, in [14] used five (5) accelerometers sensor to collect data from 31 subjects and built a hierarchical classification model to identify different body postures and movements.
Human daily activities can also be monitored by wearable device sensor and have proven to be another an effective sensor for HAR. An experiment done by [15] used five biaxial accelerometers to recognize twenty different activities ranging from walking to folding laundry to strength training. These accelerometers placed on the left bicep, right wrist, left quadriceps, right ankle, and right hip. Their results showed that the correct location of accelerometer device placed will obtain accurate body motion. In [16], reported the use of wearable device sensor for collecting acceleration data for human activity recognition obtained 94% accuracy.
Apart of that, studies on the use of smart phone devices to collect data for activity recognition were also discovered. As mentioned earlier, current generation of smart phone is the best wearable sensor as it comprised with a variability of sensors. In [17], used an Android operating system based smart phone for recognizing basic activities such as walk, jog, climb up and walk down the stairs, sit and stand still. Meanwhile, in [18] proposed a subject dependent real time activity recognition system by using the Nokia N95 smart phone. Human activities can be divided into simple and complex activity based on the complexity of the recognition task [19]. Using data collected from smart phone device, in [19] claimed that by using MLP classifier, they managed to achieve 93% accuracy for simple human activities recognition but for complex activities human recognition, they achieved only 50% of the accuracy.
An activity which involves one person and lasts only within a few seconds can be categorized as simple activity. Some examples of simple activities are running, walking, and jogging, which do not contain much outlier noise or variations of combination activity. Meanwhile, for complex activities are not as repetitive as simple activities and may involve various movements such as talking while cooking, typing while sitting, smoking and giving a talk. Complex human activity recognition can provide the data to build automated recognition systems for preventing, curing, and improving wellness and health conditions of older adults. Finding from [3] shows that a smart phone can be used to recognize simple activities as well as complex activities, but extra sensors should be considered for better prediction results in complex activities.
Fig.1 Accelerometer Sensor.
Research shows combination of two or more machine learning model can achieved high accuracy in recognizing human activities. In [19], showed several experiments with four users that performed six complex activities such as slow walk, fast walk, run, walk up-stairs, walk down-stairs and dancing were conducted, their recognition model managed to achieve 91.15% accuracy. In that experiment, three classifiers were combined, MLP, SVM and LogicBoost, and located in-pocket phone position and the result showed combination of MLP, Random Forest (RF) and Simple Logistic classifiers performed best for in-pocket phone position. They reported that the suitable combination rule for combination technique was not majority voting but average of probabilities. Meanwhile, according to [6], they proposed a model by using ensemble techniques with combination three classification algorithms, namely Decision Tree (C4.5) classifier, Multi-Layer Perceptrons (MLP) classifier and Logistic Regression classifier with the average of probabilities combination rule. The result showed that the performance of the proposed combination provides better performance than the previous MLP-based recognition approach. The dataset includes information from thirty-six users and 43 features were used during the experiments. Therefore, we aimed to compare our result with the performance reported in [6].
Voting or vote classifier used to ensembles of more than one classifier. The approach is based on plurality or majority voting, where each single classifier contributes a single vote [20]. The aggregation prediction is decided by the majority of the votes, i.e., the class with the most votes is the final prediction. The final prediction is decided by total up all votes and then class with the highest aggregate will be chosen. The advantage of voting is that it is unlikely that all classifiers will make the same mistake, as long as every error is made by a minority of the classifiers, an optimal classification can be achieved. The rest of this paper is organized as follows. Section 2 described the methods used in this study and section 3 presents and discusses the results.
II. MATERIAL AND METHOD
In this section, we first describe our proposed voting technique that uses NBTree and MLP classifiers followed by the description on the design of our experiments to evaluate the performance of our proposed voting technique with regard to its ability in performing activity recognition using smart phone. Through a quite numbers of experiments using Weka, we managed to produce our proposed model. Weka is a collection of machine learning algorithms for data mining tasks where the algorithms can either be applied directly to a dataset or called from Java code. A detail comparison of machine learning tools that are appropriate for prediction was presented in [21], and as a result, Weka tool was found to be the best in terms of computational perspective, wider range of algorithms, better data preparation tools and support for very large data sets. It also supports several standard data mining tasks, more specifically, data pre-processing, clustering, classification, regression, visualization, and feature selection. Therefore, in this research, all of the experiments and tests were performed using Weka.
In order to collect data for our supervised learning task, it was necessary to have a large number of users carry an Android-based smart phone while performing certain everyday activities. As mentioned earlier, data required to perform the experiments were obtained from a publicly available dataset, Wireless Sensor Data Mining (WISDM). There are 29 users whose activities information were recorded in this dataset using smart phone accelerometers, which makes this dataset suitable for benchmarking studies. The dataset comprises 1,098,207 and 5,424 examples of raw data and transformed data respectively, which are distributed according to the six activities identified earlier. These activities were walking, jogging, walking upstairs, walking downstairs, sitting, and standing. These activities were chosen they are commonly performed in our daily life. For each activity, acceleration was plotted in three different axes; x, y and z axis. X-axis represents horizontal movement of the participant leg, y-axis represents up-ward and downward motion and z-axis represents forward movement. The statistics of the dataset is shown in Table 1.
According to WISDM, the data involved a large number of users carry an Android-based smart phone while performing certain everyday activities. Before collecting this data, they obtained approval from the Fordham University IRB (Institutional Review Board) since the study involved “experimenting” on human subjects and there was some risk of harm (e.g., the subject could trip while jogging or climbing stairs). They managed to get help from twenty-nine volunteer subjects to carry a smart phone while performing a specific set of activities. These subjects carried the Android phone in their front pants leg pocket and were asked to walk, jog, ascend stairs, descend stairs, sit, and stand for specific periods of time.
therefore they had 20 samples per second. The data collection was supervised by one of their WISDM team members to ensure the quality of the data.
Feature creation is a critical step in the development of any classifier. An activity recognition system does not solve the classification task directly on raw acceleration data. Generally, the classification is performed after an informative data representation is created in terms of feature vectors. To accomplish this, the dataset was prepared by the raw data series divided to 10 seconds segments and the features were created based on 200 readings in each segment. Six basic feature type, were first identified for 200 readings in each 10-s segment. The six feature types are: Average, Standard Deviation (SD), Average Absolute Difference (AAD), Average Resultant Acceleration (ARA), Time Between Peaks (TBP), Binned Distribution (BD). The meaning of AAD is the difference between each value in 200 readings and the mean of the 200 values. Meanwhile, ARA is computed by the average of square root of the squared values sum for each axis. TBP represents the time between the peaks and BD is calculated by the range of values divided into 10 bins and re-cording the fraction of 200 values which fall within each bin.
The “time between peaks” feature requires further explanation. The repetitive activities, like walking, tend to generate repeating waves for each axis and this feature tries to measure the time between successive peaks. To estimate this value, for each example we first identify all of the peaks in the wave using a heuristic method and then identify the highest peak for each axis. A threshold based on a percentage of this value is set and find the other peaks that met or exceed this threshold; if no peaks meet this criterion then the threshold is lowered until we find at least three peaks and then the time was measure between successive peaks and calculate the average. For samples where at least three peaks could not be found, the time between peaks is marked as unknown. This method was able to accurately find the time between peaks for the activities that had a clear repetitive pattern, like walking and jogging. Certainly more sophisticated schemes will be tried in the future. Therefore, in this dataset there are about total of 43 features, which are the variations of six feature types. By using a classifier, hypothesis can be build and a testing activity can be predicted based on these 43 features.
Classification is a tree based structure which is a concept of data mining (machine learning) technique. It used to predict data instances through attributes. Classification is a method where one can classify future data into known classes. In general, this approach uses a training data set to build a model and test data set to validate it. One of the classification technique is ensemble methods. Ensemble methods are techniques that create multiple models and then combine them to produce improved results. Ensemble methods usually produces more accurate solutions than a single model would. Voting and averaging are two of the easiest ensemble methods. They are both easy to understand and implement. Voting is used for classification and
averaging is used for regression. As shown in Fig. 2, from the data, it will generate a set of classification or prediction models, M1, M2,...Mk, then voting strategies are used to combine the predictions for a given unknown tuple.
Fig.2 Ensemble Method Architecture.
The main objective of this research was to identify the performance of voting technique that uses combination of NBTree and MLP classifiers. The reason of choosing NBTree is because, NBTree is a hybrid approach of Naive Bayesian and Decision Tree that is suitable in learning scenarios when many attributes are likely to be relevant for a classification task. It induces highly accurate classifiers in practice, significantly improving upon both its constituents in many cases. MLP on the other hand is a well-known machine learning classifier which maps inputs on to outputs. MLP model has three layers which are input layer, hidden layer and output layer as the basic building blocks and at the same time, MLP use back-propagation algorithm as learning technique for training.
A. Individual Classifiers
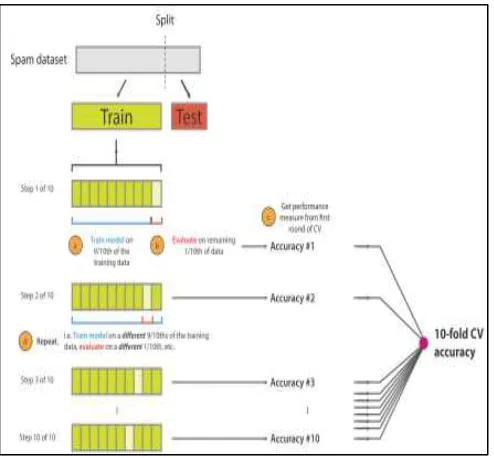
To begin with, and for the purpose of comparison later, we evaluated the performance of the following individual classifiers, all available in the Weka toolkit: NBTree and MLP. These classifiers were trained and tested using a 10-fold cross validation method on the set of extracted features. Cross-validation is a technique to evaluate predictive models by partitioning the original sample into a training set to train the model, and a test set to evaluate it.
Fig.3 10-Fold Cross Validation Process
B. Combination of Classifiers
Then, the previous voting technique in [6] that used J48, LR and MLP was applied on the same dataset for comparison. Finally, the experiment was repeated on our proposed voting technique that uses the combination of NBTree and MLP as an ensemble classifier. We used an average of probabilities combination rule instead of majority voting to integrate into our model for the decision step and in the experiment as well we used ten-fold cross validation approach. The reason of average of probabilities was chosen because as mentioned by [19], that the suitable combination rule for combination technique was not majority voting but average of probabilities. After each experiment, confusion matrix for each technique were calculated. To compare the performance of each technique, a comparison table was produced where the details performance results of each were populated.
TABLEI WISDMDATASET STATISTICS
Origin Data Transformed Data
No. of data: 1,098,207 No. of data: 5,424
No. of attributes: 6 No. of attributes: 6
Missing attributes: None Missing attributes: None
Class distribution: Class distribution:
Walk: 424,400 (38.6%) Walk: 2,082 (38.4%)
Jog: 342,177 (31.2%) Jog: 1,626 (30%)
Walk Upstairs: 122,869 (11.2%) Walk Upstairs:633 (11.7%)
Walk Downstairs: 10,0427 (9.1%)
Walk Downstairs:529 (9.8%)
Sit: 59,939 (5.5%) Sit:307 (5.7%)
Stand: 48,395 (4.4%) Stand:247 (4.6%)
III.RESULTS AND DISCUSSION
In this section, we discuss the results obtained from the experiments. Table 2 to Table 4 present the confusion matrices for NBTree, MLP and voting technique in [6] respectively. Table 5 presents solely the confusion matrices for our model. As can be seen from the results presented on the tables, combination of NBTree and MLP classifiers in a voting technique gave us the best overall accuracy among other classifiers and voting technique. Based on the results in Fig. 4, it shows that a simple combination of NBTree and MLP achieved the best accuracy on the chosen dataset and has outperformed the previously defined voting technique. The most important activities to analyse are the climbing-up and climbing-down stair activities, since these were the only activities that that were difficult to recognize.
Apart of that, the results show that with the correct classifier combination and the right combination rule will produce high performance. We have used voting technique with the combination of NBTree classifier and MLP classifier and an average of probabilities as the combination rule. After an intensive number of experiments, we believe the factor that lead with high accuracy is the suitable combination of the classifier with the right combination rule. Similar to previous work in [6], our proposed model also achieved the highest accuracy for walking and jogging activities due to the number of available samples for these activities.
Our proposed model has therefore overcome the weakness found in [6] and other classifiers for their bad performance to predict walking upstairs and walking downstairs activities, where our voting technique achieved 93.35% for walking upstairs and 90.15% for walking downstairs activities.
TABLEII
CONFUSION MATRIX OF NBTREE CLASSIFIER
Walk Jog Upstairs Downstairs Sit Stand Accuracy
2030 8 15 24 1 3 97.5
15 1577 22 9 1 1 97
21 9 496 102 2 2 78.5
23 6 95 395 5 4 74.8
7 1 3 2 287 6 93.8
7 6 14 6 5 208 84.6
TABLEIII
CONFUSION MATRIX OF MLP CLASSIFIER
Walk Jog Upstairs Downstairs Sit Stand Accuracy
1980 9 57 34 0 1 95.15
18 1603 1 2 0 1 98.65
177 6 317 128 4 0 50.16
129 2 203 190 3 1 35.98
0 0 5 5 288 8 94.12
TABLEIV
CONFUSION MATRIX OF VOTING TECHNIQUE (J48,LR&MLP)
Walk Jog Upstairs Downstairs Sit Stand Accuracy
2054 8 10 8 0 1 98.7
14 1598 9 4 0 0 98.34
3 4 538 85 2 0 85.13
9 5 129 384 1 0 72.73
1 0 3 0 300 2 98.04
2 1 3 2 0 238 96.75
TABLEV
CONFUSION MATRIX OF OUR MODEL (NBTREE &MLP)
Walk Jog Upstairs Downstairs Sit Stand Accuracy
2065 6 10 0 0 0 99.23
9 1612 1 2 0 1 98.6
9 3 590 27 3 0 93.35
15 3 30 476 3 1 90.15
0 0 3 0 301 2 98.37
0 0 2 0 2 242 98.37
Fig.4 Accuracy Model Comparison.
IV.CONCLUSIONS
In this paper, an accelerator-based human activity recognition model was proposed using voting technique that combines NBTree and MLP as ensemble classifiers. The classifiers were combined based on average probabilities combination rule. Number of experiments performed to do the comparison and evaluate the performance of the pro-posed model used publicly available dataset on selected human activities from WISDM. Results of the experiments showed that the proposed human activity recognition model was able to achieve better performance in terms of accuracy comparted to single classifier model and also outperformed a previous voting technique. Combining the two best classifiers using the average of probabilities rules turned out to be the best classifier for activity recognition, outperforming all individual classifiers. For future, we plan to produce more comprehensive voting technique to handle complex activity recognition.
REFERENCES
[1] Avci, A., Bosch, S., Marin-Perianu, M., Marin-Perianu, R., Havinga, P. (2010). Activity recognition using inertial sensing for health care, well being and sports applications. A survey in International Conference on Architecture of Computing Systems.
[2] Lin, W., Sun, M., Poovandran, R., & Zhang, Z. (2008). Human activity recognition for video surveillance. 2008 IEEE International
Symposium on Circuits and Systems.
doi:10.1109/iscas.2008.4542023.
[3] Dernbach, S., Das, B., Krishnan, N. C., Thomas, B. L., & Cook, D. J. (2012). Simple and Complex Activity Recognition through Smart Phones. 2012 Eighth International Conference on Intelligent Environments. doi:10.1109/ie.2012.39.
[4] Chen, L., Hoey, J., Nugent, C. D., Cook, D. J., & Yu, Z. (2012). Sensor-Based Activity Recognition. IEEE Transactions on Systems, Man, and Cybernetics, Part C (Applications and Reviews) IEEE Trans. Syst., Man, Cybern. C, 42(6), 790-808. doi:10.1109/tsmcc.2012.2198883.
[5] Townsend, D., Knoefel, F., & Goubran, R. (2011). Privacy versus autonomy: A tradeoff model for smart home monitoring technologies. 2011 Annual International Conference of the IEEE Engineering in Medicine and Biology Society. doi:10.1109/iembs.2011.6091176. [6] Catal, C., Tufekci, S., Pirmit, E., & Kocabag, G. (2015). On the use
of ensemble of classifiers for accelerometer-based activity recognition. Applied Soft Computing, 37, 1018-1022. doi:10.1016/j.asoc.2015.01.025.
[7] WISDM Dataset. (n.d.). Retrieved June 27, 2016, from http://www.cis.fordham.edu/wisdm/dataset.php.
[8] Lee, Y., & Cho, S. (2011). Activity Recognition Using Hierarchical Hidden Markov Models on a Smartphone with 3D Accelerometer. Lecture Notes in Computer Science Hybrid Artificial Intelligent Systems, 460-467. doi:10.1007/978-3-642-21219-2_58.
[9] Phan, T. (2014). Improving activity recognition via automatic decision tree pruning. Proceedings of the 2014 ACM International Joint Conference on Pervasive and Ubiquitous Computing Adjunct Publication - UbiComp '14 Adjunct. doi:10.1145/2638728.2641310. [10] Anguita, D., Ghio, A., Oneto, L., Parra, X., & Reyes-Ortiz, J. L.
(2012). Human Activity Recognition on Smartphones Using a Multiclass Hardware-Friendly Support Vector Machine. Lecture Notes in Computer Science Ambient Assisted Living and Home Care, 216-223. doi:10.1007/978-3-642-35395-6_30.
[11] Vail, D. L., Veloso, M. M., & Lafferty, J. D. (2007). Conditional random fields for activity recognition. Proceedings of the 6th International Joint Conference on Autonomous Agents and Multiagent Systems - AAMAS '07. doi:10.1145/1329125.1329409. [12] Lester, J., Choudhury, T., & Borriello, G. (2006). A Practical
Approach to Recognizing Physical Activities. Lecture Notes in Computer Science Pervasive Computing, 1-16. doi:10.1007/11748625_1.
[13] Mannini, A., & Sabatini, A. M. (2010). Machine Learning Methods for Classifying Human Physical Activity from On-Body Accelerometers. Sensors, 10(2), 1154-1175. doi:10.3390/s100201154. [14] Foerster, F., & Fahrenberg, J. (2000). Motion pattern and posture:
Correctly assessed by calibrated accelerometers. Behavior Research Methods, Instruments, & Computers, 32(3), 450-457. doi:10.3758/bf03200815
[15] Bao, L., & Intille, S. S. (2004). Activity Recognition from User-Annotated Acceleration Data. Lecture Notes in Computer Science Pervasive Computing, 1-17. doi:10.1007/978-3-540-24646-6_1. [16] Casale, P., Pujol, O., & Radeva, P. (2011). Human Activity
Recognition from Accelerometer Data Using a Wearable Device. Pattern Recognition and Image Analysis Lecture Notes in Computer Science, 289-296. doi:10.1007/978-3-642-21257-4_36.
[17] Kwapisz, J. R., Weiss, G. M., & Moore, S. A. (2011). Activity recognition using cell phone accelerometers. SIGKDD Explor. Newsl. ACM SIGKDD Explorations Newsletter, 12(2), 74. doi:10.1145/1964897.1964918
[18] Brezmes, T., Gorricho, J.L., & Cotrina, J. (2009) Activity Recognition from accelerometer data on mobile phones (pp.796-799). In IWANN Proceedings of the 10th International Conference on Artificial Neural Networks.
[20] Azmi, M. S., & Paris, I. H. (2011). Academic performance prediction based on voting technique. 2011 IEEE 3rd International Conference on Communication Software and Networks. doi:10.1109/iccsn.2011.6014841.