& Calhoon, 2013; Hills, Mokhtar, & Byrne, 2014; Van Hoye, Nicaise, & Sarrazin, 2014), but accelerometers alone are unable to link PA to specific environments. For that reason, recent studies have concurrently assessed spatial location (McCrorie, Fenton, & Ella-way, 2014) using Global Navigation Satellite System (GNSS) – most commonly using Global Positioning System (GPS) devices. These record time-stamped posi-tion and can accurately show the route and the speed of a person (James et al., 2016). Novel approaches to pro-cess and combine these data with geographic informa-tion systems (GIS) allow for spatial analysis and visu-alization of PA within specific environments (Demant Klinker, Schipperijn, Toftager, Kerr, & Troelsen, 2015). However, using GPS devices also presents several issues, such as differences in accuracy and precision for different devices, unstable signal acquisition in more dense urban areas, and difficulties with data processing (Meseck et al., 2016; Shen & Stopher, 2014).
When using GPS devices in scientific research, it is important to have knowledge on the accuracy and pre-cision of the data obtained. Early work tested devices in a static position (i.e., not moving), where the spatial
Introduction
Physical activity (PA) plays an important role in the physical and mental health of youth (Bouchard, Blair, & Haskell, 2012; Janssen & LeBlanc, 2010; Reiner, Niermann, Jekauc, & Woll, 2013). Lack of PA is associated with numerous health problems and com-plications (Janssen & LeBlanc, 2010; World Health Organization, 2010) and its worldwide decline is well documented (Hallal et al., 2012; Knuth & Hallal, 2009). The ecological model of health behavior sug-gests that environmental and policy variables are deter-minants of PA and behavior change (Sallis & Owen, 2015). The built environment has been identified in many studies across the globe as a significant factor influencing PA (Sallis et al., 2016).
Objectively monitoring PA behavior using acceler-ometers is common (Cain, Sallis, Conway, Van Dyck,
* Address for correspondence: Michal Vorlíček, Institute of Ac-tive Lifestyle, Faculty of Physical Culture, Palacký University Olomouc, třída Míru 117, 711 11 Olomouc, Czech Republic. E-mail: [email protected]
The comparison of Holux and Qstarz GPS receivers in free living conditions:
Dynamic accuracy in different active transport modes
Michal Vorlíček
1,*, Tom Stewart
2, Jan Dygrýn
1, Lukáš Rubín
1, Josef Mitáš
1, and Jasper Schipperijn
3 1Faculty of Physical Culture, Palacký University Olomouc, Olomouc, Czech Republic; 2School of Sport and Recreation,Auckland University of Technology, Auckland, New Zealand; and 3Department of Sport Science and Clinical
Biomechan-ics, University of Southern Denmark, Odense, Denmark
Copyright: © 2019 M. Vorlíček et al. This is an open access article licensed under the Creative Commons Attribution License
(https://creativecommons.org/licenses/by/4.0/).
Background: Physical activity (PA) is one of the major factors influencing human health. An important group of determinants are elements forming the built environment. For a proper understanding of relationships between the built environment and PA, we need to measure PA in space. Objective: This study aims to verify the accuracy of the Holux RCV-3000 GPS logger, which has not yet been validated in relation with PA. Methods: Two GPS receivers (Holux RCV-3000 and already validated Qstarz BT-Q1000XT) were tested during walking, running and cycling. A total of 1,908 GPS points were recorded by each device. For each trip, we calculated the percentage of points that fell within 1, 2.5, 5, and 10 m buffers, as well as the mean and median error. Results: Our results showed that 53.1% of all Holux and 45.1% of Qstarz GPS points fell within 2.5 m of the expected location, 90% (Holux) and 80% (Qstarz) fell within 10 m and the median error was 2.33 m and 3.15 m, respectively. Conclusions: The dynamic spatial accuracy of the tested Holux RCV-3000 was better than more expensive Qstarz device and can be considered as a valid instru-ment for assessing the spatial location of PA in future work.
inaccuracy ranged from 1.5 to 10 m (Townshend, Worringham, & Stewart, 2008). A more significant measurement error (40–50 m) occurred in an environ-ment where the signal between the satellites and the instrument was obstructed (Duncan et al., 2013). This obstruction can be caused by so-called urban canyons – high-rise buildings on both sides of the street. Another study (Rodriguez, Brown, & Troped, 2005) determined a spatial inaccuracy of 0.90 ± 0.74 m in conditions without signal obstruction. Wu et al. (2010) tested the dynamic accuracy (when the device is moving) of five GPS receivers (GlobalSat DG-100 and BT-335, Wintec WBT-201, Visiontac VGPS-900, Qstarz BT-Q1000X) and found that most of the GPS devices performed well on unobstructed freeways, but the performance was significantly reduced in highly urbanized areas.
The availability of GPS devices suitable for research is constantly changing and the cost per device is another important factor for researchers, especially for larger studies. One of the newer devices on the market, the Holux RCV-3000, is cheaper (70 USD) than the typi-cal price of the frequently used Qstarz BT-Q1000XT (100 USD). The accuracy of the Holux RCV-3000 GPS logger is rated as ± 3 m by the manufacturer. The technical parameters, a low-energy 66 channel MTK chipset and sensitivity up to –165 dBm, coincide with the Qstarz BT-Q1000XT, which is widely used among international researchers for measuring the location of PA (Andersen et al., 2017; Carlson et al., 2015; Pizarro et al., 2017; Schipperijn et al., 2014; Stewart, Schip-perijn, Snizek, & Duncan, 2017). This is because the static accuracy (Duncan et al., 2013) and dynamic accuracy (Schipperijn et al., 2014) of this device have been successfully tested. The median dynamic posi-tional error was 2.9 m and 78.7% of all recorded GPS points fell within 10 m of the true location (Schipperijn et al., 2014). However, the dynamic accuracy of the cheaper Holux has not been tested nor compared to the widely used Qstarz device.
The aim of this study was to assess the dynamic accuracy of the Holux RCV-3000 GPS device for recording spatial location under three different trans-portation modes (walking, running, and cycling), and compare it to the Qstarz BT-Q1000XT.
Methods
Procedures
Testing of the two GPS devices (worn at the same time inside the top pocket of a backpack) took place between September and November 2017 in Denmark and the research was approved by the Ethics Committee of the Faculty of Physical Culture, Palacký University
Olomouc (2/2018). A 2-km long route (Figure 1) which included various types of environment (open, half-open, covered streets) was purposefully selected. A total of 30 trips (10 walking trips (5 km/h), 10 running trips (10 km/h) and 10 cycling trips (17 km/h)) were under-taken by one researcher along this route, following the centerline of the sidewalk or bike lane on one side of the street. The measurements were deliberately carried out under different atmospheric conditions (clear sky, cloudy, rain) and at different times of the day.
GPS receivers
Two GPS devices were used for logging positional infor-mation (latitude and longitude) every 15 s. In total, 1,908 GPS points were collected by each GPS device. The Holux RCV-3000 (Holux Technology, Hsinchu, Taiwan) uses the highly sensitive MediaTek MT3329 chipset, which has 66 channels and is WAAS/EGNOS enabled. The size is 62.5 × 41 × 17.1 mm and weight is 53 g. The battery life is up to 28 hours in logging mode. The device was initialized using the Holux ezTour software (Version 2.3; Holux Technology, Hsinchu, Taiwan).
The Qstarz BT-Q1000XT (Qstarz International, Taipei, Taiwan) was treated as the reference device because it is widely used in the field and has shown high dynamic accuracy in varying environmental con-ditions and transportation modes (Schipperijn et al., 2014). This device was initialized using the QTravel software (Qstarz International Taipei, Taiwan).
GIS analysis
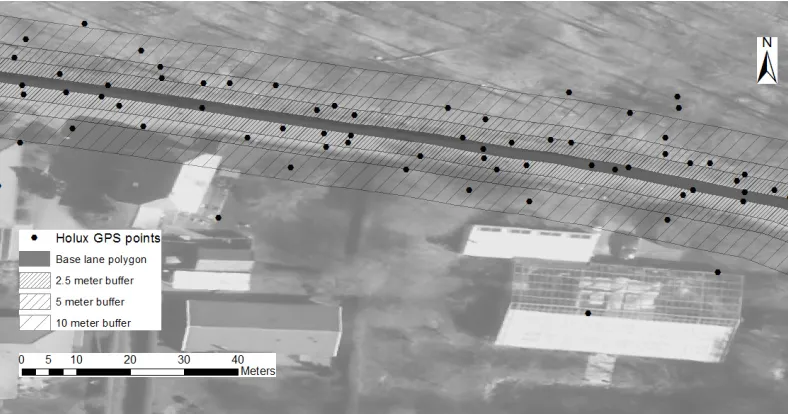
Polygons for sidewalks, bike lanes and streets were digitized in ArcGIS (Version 10.5; Esri, Redlands, CA, USA) as accurately as possible based on high resolution (15 cm) aerial photos available from the Danish Geodata Agency. These polygons were then transformed to lines (function “polygon to lines”) and collapsed to one cen-terline (“collapse dual lines to cencen-terline”). A one-meter buffer around the centerline was created to delineate the base lane polygon. Finally, three distance buffers (at 2.5, 5, and 10 m respectively) around the base lane polygon were created (Figure 2). For each transportation mode (walking, running, cycling) we calculated the proportion of GPS points that fell within the base lane polygon, and within the 2.5-, 5-, and 10-m buffers, respectively. For each GPS point, the distance from the edge of the base lane polygon was also calculated.
Statistical analysis
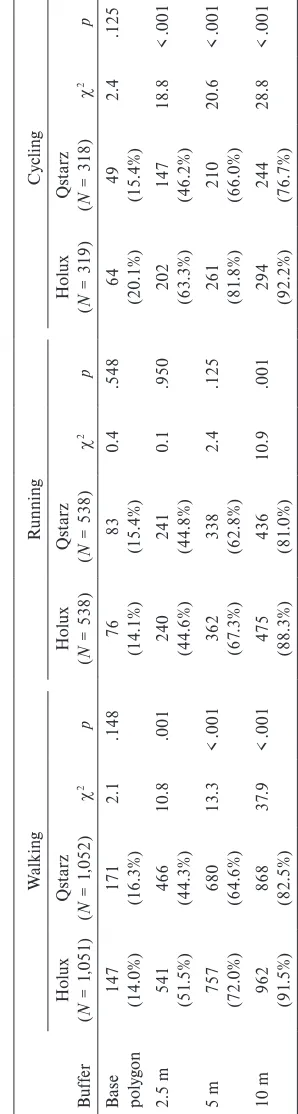
GPS points were within the base lane polygon. For all travel modes, about half of all recorded GPS points were located within 2.5 m from the base lane polygon (51.5% walking, 44.6% running, and 63.3% cycling). The proportion of points that fell within the 10-m buf-fer around the base lane polygon was 91.5% for walk-ing, 88.3% for runnwalk-ing, and 92.2% for cycling.
Qstarz BT-Q1000XT
The results for the Qstarz were similar across the three modes of transportation. The base lane polygon con-tained 15.7% of measured points (16.3% for walking, and 15.4% for running and cycling). The 2.5- and 5-m buffers contained 45.1% and 64.4% of all logged GPS were calculated using a Mann-Whitney U test. All
sta-tistical analyses were performed using the software IBM SPSS (Version 22; IBM, Armonk, NY, USA) with alpha ≤ .05.
Results
Holux RCV-3000
Table 1 shows the number and share of GPS points from each device that fell within each of the four poly-gons, for the three different transportation modes. For walking and running, 14% of the GPS points were within the base lane polygon. For cycling, 20.1% of
Figure 1. GPS points from Holux device projected on the aerial photo of Odense (Denmark).
points, respectively. For the widest buffer (10 m), the device was most accurate during walking (82.5%) and least accurate for cycling (76.7%).
In the case of walking, there was a significant differ-ence between the two devices for the number of points that were located within all three buffers (2.5, 5, and 10 m). In the case of running there was the significant
difference only in the 10-m buffer (χ2 = 10.9; p = .001). The most striking difference between the devices was recorded during cycling with the Qstarz being significantly less accurate than the Holux for the 2.5-m (χ2 = 18.8; p < .001), 5-m (χ2 = 20.6; p < .001) and 10-m (χ2 = 28.8; p < .001) buffers.
Table 2 presents the mean and median distances of all GPS points from the edge of the base lane poly-gon for both the Holux and Qstarz devices. The larg-est median distance was observed during running for the Holux (2.92 m) and walking for the Qstarz (3.22 m). Overall, the Holux had a lower median distance to the edge of the base lane polygon than the Qstarz (p < .001), and this trend was also observed for walk-ing and cyclwalk-ing travel modes.
Discussion
Our study aimed to assess the dynamic accuracy of the Holux RCV-3000 GPS device and compare it to the Qstarz BT-Q1000XT. Results showed that a 10-m buffer included 91.5% (walking), 88.3% (running), and 92.2% (cycling) of all GPS points from the Holux device, and the median dynamic positional error was 2.33 m. The Holux performed better than the Qstarz in the current study.
Available comparison studies that have evaluated the static or dynamic outdoor accuracy of different GPS units describe the Qstarz as the most accurate, with the smallest mean error values in all selected environments compared to other receivers (Duncan et al., 2013; Schip-perijn et al., 2014; Wu et al., 2010). Unfortunately, none of these studies included any Holux GPS devices in their comparisons. The Qstarz is widely used in PA research (Andersen et al., 2017; Carlson et al., 2015; Evenson, Wen, Hillier, & Cohen, 2013; Hu, Li, Li, Houston, & Wu, 2016; Pizarro et al., 2017; Schipperijn et al., 2014; Stewart et al., 2017). The Holux RCV-3000 and its predecessor (Holux M-1000C) have been used in other scientific disciplines (Borkowski, Pietrzykowski, Magaj, & Maka, 2008; Hassein, Diachuk, & Easa, 2017), but only a few studies have used these devices in the field of PA monitoring (Arifin & Axhausen, 2012; Vorlíček, Rubín, Dygrýn, Mitáš, & Voženílek, 2016).
Using the Qstarz device, Schipperijn et al. (2014) found that 77.5% of all GPS points (15 s epoch) fell inside the 10-m buffer, which is very similar to our results (80% of Qstarz points within 10 m). Schipperijn et al. (2014) also illustrated differences among travel modes, with 13.2 % (walking) and 22.3% (cycling) of GPS points located inside of the base polygon. We also observed these trends, as the Holux recorded 14% (walking) and 20.1% (cycling) of GPS points within the
Table 1 Com
par
ison of d
ynamic s
pa
tial ac
cur
ac
y of bo
th de vic es w ithin t hr ee mode
s of t
rans
por
t – number and shar
e of GP
base polygon. However, within the 2.5-m buffer, Schip-perijn et al. (2014) observed 40% (walking) and 55.1% (cycling) of all GPS points, while we observed 51.5% (walking) and 63.3% (cycling) using the Holux. Inside the 10 m buffer, Schipperijn et al. (2014) measured 73.5% and 86.8% of points for walking and cycling, respectively. Our Holux results show 91.5% (walking) and 92.2% (cycling) within this buffer. Overall, Schip-perijn et al. (2014) reported a median error of 3.9 m for walking and 2.0 m for cycling. Our results from the Holux show a median error 2.33 m for walking and 1.55 m for cycling.
It is unclear why the Holux performed better than the Qstarz in our study. Both devices are based on same low-energy 66 channel MTK chipset with a sensitivity of up to –165 dBm. Both devices have a L1 (1575.42 MHz) receiver with C/A code (1.023 million bits per second) and the same accuracy < 3 m CEP (circular error prob-ability) without SA (intentional degradation of public GPS signals implemented for national security reasons), and WAAS/EGNOS is supported. Both devices have an LED (indicates different statuses) and a built-in antenna. However, other specifications differ between devices: the Qstarz has longer battery life (up to 42 hours compared to 28 hours), the best on the market among other GPS devices (Wu et al., 2010), and higher memory capacity (up to 400,000 points compared to 250,000 points). On the other hand, the Holux GPS logger is slightly smaller and lighter, and is also less expensive.
Despite these promising findings, our study had several limitations. Firstly, despite comparing 30 individual trips across three travel modes, our study sample included only one participant. It is possible that different individuals may walk, cycle or run dif-ferently (e.g., intermittent speeds), which may affect device accuracy. Secondly, we tested only two GPS receivers (one of each model), so we were unable to determine the intra-model reliability of devices. Lastly, our testing route did not contain all possible environ-mental conditions (i.e., no urban canyons) which will likely impact results.
Conclusions
Our results show that more than half (51.5%) of all GPS points recorded by the Holux RCV-3000 GPS device were recorded within 2.5 m of the true posi-tion, and 90.7% of all GPS points were located within 10 m. The median error was 2.33 m. The Holux device performed better than the Qstarz BT-Q1000XT GPS device we used for comparison. Given the dynamic spatial accuracy of the Holux RCV-3000 demonstrated in this study, coupled with the low purchase price, this device can be considered as a valid instrument for assessing the spatial location of physical activity in future work.
Acknowledgments
This research was funded by the Internal Grant Agency of Palacký University Olomouc (grant no. IGA_FTK_2018_002).
Conflict of interest
There were no conflicts of interest.
References
Andersen, H. B., Christiansen, L. B., Klinker, C. D., Ers-bøll, A. K., Troelsen, J., Kerr, J., & Schipperijn, J. (2017). Increases in use and activity due to urban renewal: Effect
of a natural experiment. American Journal of Preventive
Medicine,53, e81–e87.
Arifin, Z. N., & Axhausen, K. W. (2012). Investigating com-mute mode and route choice variabilities in Jakarta using
multi-day GPS data. International Journal of Technology,3,
45–55.
Borkowski, P., Pietrzykowski, Z., Magaj, J., & Maka, M. (2008). Fusion of data from GPS receivers based on a
multi-sensor Kalman filter. Transport Problems,4, 5–11.
Table 2
Mean and median distance of GPS points from the edge of the base lane polygon in metres
Mode of transport
Holux Qstarz
Z p
Mean ± SD Median (IQR) Mean ± SD Median (IQR)
Walking 3.95 ± 4.77 2.33 (4.92) 6.43 ± 9.95 3.22 (6.72) 3.44 .001
Running 4.26 ± 4.46 2.92 (5.60) 6.68 ± 11.01 3.21 (6.83) 1.15 .249
Cycling 3.24 ± 5.03 1.55 (3.53) 8.60 ± 13.87 2.98 (7.33) 5.08 < .001
All 3.92 ± 4.74 2.33 (4.93) 6.86 ± 11.02 3.15 (6.85) 5.28 < .001
Bouchard, C., Blair, S. N., & Haskell, W. (Eds.). (2012). Physical activity and health (2nd ed.). Champaign, IL: Human Kinetics.
Cain, K. L., Sallis, J. F., Conway, T. L., Van Dyck, D., & Cal-hoon, L. (2013). Using accelerometers in youth physical
activity studies: A review of methods. Journal of Physical
Activity and Health,10, 437–450.
Campbell, I. (2007). Chi-squared and Fisher-Irwin tests of two-by-two tables with small sample recommendations. Statistics in Medicine,26, 3661–3675.
Carlson, J., Jankowska, M., Meseck, K., Godbole, S., Nata-rajan, L., Raab, F., … Kerr, J. (2015). Validity of PALMS GPS scoring of active and passive travel compared with
SenseCam. Medicine & Science in Sports & Exercise,47,
662–667.
Demant Klinker, C., Schipperijn, J., Toftager, M., Kerr, J., & Troelsen, J. (2015). When cities move children: Devel-opment of a new methodology to assess context-specific physical activity behaviour among children and
adoles-cents using accelerometers and GPS. Health & Place,31,
90–99.
Duncan, S., Stewart, T. I., Oliver, M., Mavoa, S., MacRae, D., Badland, H. M., & Duncan, M. J. (2013). Portable Global Positioning System receivers: Static validity and
environmental conditions. American Journal of Preventive
Medicine,44, e19–e29.
Evenson, K. R., Wen, F., Hillier, A., & Cohen, D. A. (2013). Assessing the contribution of parks to physical activity
using GPS and accelerometry. Medicine & Science in Sports
& Exercise,45, 1981–1987.
Hallal, P. C., Andersen, L. B., Bull, F. C., Guthold, R., Haskell, W., & Ekelund, U. (2012). Global physical activ-ity levels: Surveillance progress, pitfalls, and prospects. Lancet,380, 247–257.
Hassein, U., Diachuk, M., & Easa, S. (2017). Evaluation of dynamic passing gap acceptance on two-lane highways
using field data. Canadian Journal of Civil Engineering,44,
871–880.
Hills, A. P., Mokhtar, N., & Byrne, N. M. (2014). Assess-ment of physical activity and energy expenditure: An
over-view of objective measures. Frontiers in Nutrition,1, 5.
Hu, M., Li, W., Li, L., Houston, D., & Wu, J. (2016). Refin-ing time-activity classification of human subjects usRefin-ing the
Global Positioning System. PLOS ONE,11, e0148875.
James, P., Jankowska, M., Marx, C., Hart, J. E., Berrigan, D., Kerr, J., … Laden, F. (2016). “Spatial Energetics”: Inte-grating data from GPS, accelerometry, and GIS to address
obesity and inactivity. American Journal of Preventive
Medi-cine,51, 792–800.
Janssen, I., & LeBlanc, A. G. (2010). Systematic review of the health benefits of physical activity and fitness in
school-aged children and youth. International Journal of
Behavioral Nutrition and Physical Activity,7, 40.
Knuth, A. G., & Hallal, P. C. (2009). Temporal trends in
physical activity: A systematic review. Journal of Physical
Activity and Health,6, 548–559.
McCrorie, P. R., Fenton, C., & Ellaway, A. (2014). Combin-ing GPS, GIS, and accelerometry to explore the physical activity and environment relationship in children and
young people – a review. International Journal of Behavioral
Nutrition and Physical Activity,11, 93.
Meseck, K., Jankowska, M. M., Schipperijn, J., Natarajan, L., Godbole, S., Carlson, J., … Kerr, J. (2016). Is missing geographic positioning system data in accelerometry
stud-ies a problem, and is imputation the solution? Geospatial
Health,11, 157–163.
Pizarro, A. N., Schipperijn, J., Ribeiro, J. C., Figueiredo, A., Mota, J., & Santos, M. P. (2017). Gender differences in the domain-specific contributions to MVPA, accessed by
GPS. Journal of Physical Activity and Health,14, 474–478.
Reiner, M., Niermann, C., Jekauc, D., & Woll, A. (2013). Long-term health benefits of physical activity – a
system-atic review of longitudinal studies. BMC Public Health,13,
813.
Rodriguez, D. A., Brown, A. L., & Troped, P. J. (2005). Por-table global positioning units to complement
accelerome-try-based physical activity monitors. Medicine & Science in
Sports & Exercise, 37, S572–S581.
Sallis, J. F., Cerin, E., Conway, T. L., Adams, M. A., Frank, L. D., Pratt, M., … Owen, N. (2016). Physical activity in relation to urban environments in 14 cities worldwide: A
cross-sectional study. Lancet,387, 2207–2217.
Sallis, J. F., & Owen, N. (2015). Ecological models of health behavior. In K. Glanz, B. Rimer, & K. Viswanath (Eds.), Health behavior: Theory, research & practice (5th ed., pp. 43–64). San Francisco, CA: Jossey-Bass/Pfeiffer.
Schipperijn, J., Kerr, J., Duncan, S., Madsen, T., Klinker, C. D., & Troelsen, J. (2014). Dynamic accuracy of GPS receivers for use in health research: A novel method to
assess GPS accuracy in real-world settings. Frontiers in
Public Health, 2, 21.
Shen, L., & Stopher, P. R. (2014). Review of GPS travel
sur-vey and GPS data-processing methods. Transport Reviews,
34, 316–334.
Stewart, T., Schipperijn, J., Snizek, B., & Duncan, S. (2017). Adolescent school travel: Is online mapping a practical
alternative to GPS-assessed travel routes? Journal of
Trans-port and Health, 5, 113–122.
Townshend, A. D., Worringham, C. J., & Stewart, I. B. (2008). Assessment of speed and position during human
locomotion using nondifferential GPS. Medicine & Science
in Sports & Exercise,40, 124–132.
Van Hoye, A., Nicaise, V., & Sarrazin, P. (2014). Self-reported and objective physical activity measurement by
active youth. Science and Sports,29, 78–87.
Vorlíček, M., Rubín, L., Dygrýn, J., Mitáš, J., & Voženílek, V. (2016). Využití GPS přístrojů pro monitoring pohybové aktivity – potenciál a limity [The use of GPS devices to
monitor physical activity – potential and limits]. Studia
Kinanthropologica,17, 131–138.
World Health Organization. (2010). Global recommendations
on physical activity for health. Geneva, Switzerland: Author. Wu, J., Jiang, C., Liu, Z., Houston, D., Jaimes, G., & McCo-nnell, R. (2010). Performances of different Global Posi-tioning System devices for time-location tracking in air
pollution epidemiological studies. Environmental Health