Abstract
Romeo, Michael John. Multi-Dimensional Data Set Visualization in Portable Computing
En-vironments. (Under the direction of Christopher G. Healey.)
This thesis studies the issues involved with a graphical presentation of large, multi-dimensional
data sets. In particular, it will explore the display of such data sets on low cost, limited
capac-ity portable computing environments (e.g. personal digital assistants, cellular phones, portable
gaming devices). After a background discussion of the issues involved with scientific
visu-alization and large multi-dimensional data sets, a presentation of several portable computing
environments will be discussed along with graphics implementation packages for those
envi-ronments. This will be followed by a description and presentation of a working
implementa-tion, for Pocket PC handheld devices, along with a discussion of some extensions and further
Biography
Michael John Romeo was born in Denville, New Jersey in 1973, however, he lived most of his
life in northeastern Pennsylvania. Romeo graduated from Wallenpaupack Area High School in
1991. He received a Bachelor of Science in mathematics, with a minor in computer science,
in May, 2000, from Shippensburg University in Pennsylvania. Currently, he is working toward
completing the requirements for a Master of Science degree in computer science at North
Contents
List of Tables v
List of Figures vi
1 Introduction 1
2 Multi-dimensional Data Set Visualization 5
2.1 Scientific Visualization . . . 5
2.2 Multi-dimensional Visualization . . . 7
2.3 Data Set Format . . . 10
3 Portable Computing Devices 11 3.1 Why Use Portable Computing Devices? . . . 11
3.2 Platform Information . . . 13
3.2.1 Handheld Gaming Devices . . . 13
3.2.2 Mobile Phones . . . 16
3.2.3 Handheld Computing Devices . . . 18
3.3 Graphics Packages . . . 19
3.3.1 GAPI . . . 19
3.3.2 EasyCE . . . 20
3.3.3 X-Forge . . . 20
3.3.4 DieselEngine . . . 21
4 Overcoming Limitations 22 4.1 Display Limitations . . . 22
4.2 Processing Limitations . . . 24
4.3 Storage Limitations . . . 25
4.4 User Interface . . . 26
5 The Implementation 28 5.1 The BinFile Class . . . 28
5.2 The Pexel Class . . . 30
5.3 The Pexel Map . . . 33
5.4.1 Transformations . . . 38 5.4.2 Menus . . . 39
6 Practical Application 42
7 Conclusion 48
8 Topics for Further Study 51
List of Tables
List of Figures
5.1 Examples of Visual Features . . . 33
5.2 Example of a Pexel Map . . . 35
5.3 Application Menus . . . 40
5.4 Tool Menu Dialogs . . . 41
6.1 Visual feature examples of weather conditions in the southern United States for the month of August . . . 45
6.2 Visualizations using different data sets of weather conditions with the same data-feature mapping . . . 46
Chapter 1
Introduction
Over the last forty years, there have been numerous advances in the area of computing
technol-ogy. Computing machines have become more powerful and their size has decreased
dramati-cally. We have even seen the emergence of computers that are small enough to fit in the palm
of your hand, yet with more power than their bulky desktop-model ancestors from five to ten
years ago. Not only is the power of these handheld devices impressive, but their functionality
is quite diverse. Portable units that combine the functionality of a mobile telephone, pager, text
messaging system, and a handheld computer with a color display have been integrated into a
package that is small enough to fit in a shirt pocket.
At the heart of most computer applications lies the need to process data. The rapid advances
seen in computing technology might lead one to believe that the problem of processing data
efficiently has been solved. This is not the case, however. As more power is made available,
the trend seems to be towards increasing the size of data sets on which a program works, rather
that must be addressed by the computing research community. The one this thesis will focus
on is how to assist users as they attempt to understand the contents of these larger data sets.
Humans do not process information in the same way as computers. As the amount of data
increases, the programmer is charged with finding new ways to make results easier for a human
user to comprehend. One way of accomplishing this is through a graphical representation of
the data. People can process certain visual properties of an image much more readily than they
can raw numerical information (e.g. spatial, color, and texture patterns formed from visualizing
the data). The study of ways to present complex information spaces as images that allow users
to visually explore and analyze their data falls within the area of visualization.
Until recently, visualization was restricted to users with access to very expensive
graph-ics workstations. Recently, major advances in graphgraph-ics processing power have resulted in
workstation-class performance from consumer level graphics cards. This allows for a much
wider audience to take advantage of research in visualization. Pursuing this avenue further,
the recent explosion of small, low cost handheld computers (e.g. Personal Digital Assistants,
cellular phones, and portable gaming devices) offers an opportunity for an even broader
im-pact for our visualization techniques. These devices provide several advantages over desktop
systems:
These units usually provide a high degree of portability.
Handheld computing devices are normally cheaper than desktop computers, providing a greater cost effectiveness in their use.
lead to a smaller learning curve in their operation, particularly by someone not already
familiar with the use of traditional computer applications.
With the recent implementation of wireless networks, a means of ubiquitous access to data is now emerging.
The advantages of portable computing devices justify the investigation of adapting existing
vi-sualization techniques to such a device. The ability to provide vivi-sualization to a much wider
group users coupled with the ability to perform visualization remotely could have significant
impact on the field. Unfortunately, portable computing devices also have some inherent
limi-tations:
Although their computation and graphics processing is much improved over earlier sys-tems, it is still several orders of magnitude below the abilities of a current generation
desktop machine.
Data storage capacity and access times are often limited.
The physical interface of the device is usually restricted to only a few buttons and a directional keypad, significantly reducing the device’s user interface capabilities.
The display screen is physically smaller than those on typical desktop systems. Thus, the screen will either show less information at one time or display the same amount of
information at a lower resolution (and hence a lower quality).
These limitations motivate the basic question of this thesis: Is it possible to visualize data on a
its limitations? We will show that not only is it possible to visualize data on these portable
units, but that is is also a worthwhile effort. Although our focus is on a visualization
environ-ment, results from studying this question should be useful to anyone attempting to migrate a
traditional computing application to an portable computing environment.
This thesis will begin with a discussion of existing visualization techniques. Following
that will be a description of the computing devices we will focus on and how visualization
techniques extend to devices of this type. Next we describe the limitations inherent in handheld
computing devices along with ways in which they might be overcome. We present a working
visualization system for a specific handheld computing platform. Finally we offer conclusions
Chapter 2
Multi-dimensional Data Set Visualization
In this thesis we explore the graphical representation (or visualization) of multi-dimensional
data sets. Each data set is composed of a collection of one or more data elements. For our
purposes, each data element within the data set will encode values for several criteria, or
at-tributes. All elements in a given data set will be comprised of the same set of atat-tributes. Since
each element is defined by its collection of attribute values, we need to understand the concept
of dimensionality as it is applied to these data sets. The dimension of a data set is defined as
the number of attributes associated with each element. For example, if there are eight attributes
associated with each element, the dimension of the data set would be eight.
2.1
Scientific Visualization
In small amounts, raw data is not difficult for people to analyze. As computers become more
do not process information in the same way as computers, as data sets grow in size it becomes
necessary to find effective and efficient ways to assist in the exploration of data. Predominantly,
people use their sense of sight to facilitate the processing of information. Visualization is
the technique used to convert raw data into a compact visual form which is more convenient
for a person to comprehend. More formally, scientific visualization has been defined to be:
“. . . the conversion of collections of strings and numbers (or data sets as they are often called)
into images that allow users to explore, analyze, validate, and discover within their data.” [9]
Visualization is, in essence, taking raw data and turning it into a graphical form which is more
easily understandable to people.
Recently, there has been a division in the visualization community into two branches:
sci-entific visualization (sci viz) and information visualization (info viz). One main difference
between these two branches is the format of the data being processed. Visualizing data sets
with elements that have attributes representing an explicit spatial positioning is sometimes
re-ferred to as scientific visualization. If no predefined spatial positioning exists for the elements
in the data set, this is sometimes referred to as information visualization. Although the data
used for this thesis fall into the category of scientific visualization (see section 2.3), the
tech-niques discussed apply equally well to the field of information visualization. As such, we will
make no further distinction between the two areas of study unless otherwise appropriate.
Visualization techniques attempt to find ways to represent information within a data set in
ways that provide users with a clear understanding of the data’s nature. As noted previously,
each element in the data set is composed of a collection of attributes. Elements are represented
problem of visualization is determining which visual features of an image are salient to a given
user, together with a strategy to map information in the data set to these features. Much study
has been conducted to try to identify high-quality features and data-feature mappings for
dif-ferent problem domains [7, 8, 10, 11, 19, 22]. Since the target of this thesis is visualization on
portable computing devices, we will be searching for features that take advantage of a device’s
strengths without being limited by its inherent weaknesses. The specific visual features we will
use are: spatial position, color, orientation and density.
In its simplest form, visualization can be nothing more complex than graphs or charts.
These are a well known and highly efficient techniques to translate raw data into an image
that shows trends and relationships between attributes in ways that are more meaningful than
viewing the raw data alone. Visualization techniques are not always this simplistic, however.
As data sets become more complex, so too do the visualization techniques applied to the data.
Visualization is a large field which has no limitations placed on the size and format of the
data sets to be processed. The techniques used for visualization change to fit the data and the
user’s analysis needs. This thesis focuses on a specific category of data sets: those containing
a large number of multi-dimensional data elements.
2.2
Multi-dimensional Visualization
Recall from the start of this chapter, that the dimension of a data set is defined as the number
of attributes associated with each element. A high dimensionality leads to a problem when
increasingly more powerful, there is still one primary restriction: they display two-dimensional
images. Using projections, one can easily represent objects in three-dimensional space as a
two-dimensional image. However, when the dimension of the data set exceeds three for each
data element, projecting the data onto a two-dimensional device becomes significantly more
difficult.
Consider the proposed example where the data set is of dimension eight. To create a
graph-ical representation of this data set in a functional, graph-based manner of mapping an attribute
to a spatial dimension, we would need to display an image in eight dimensional hyperspace.
This would require either an eight dimensional display, or some means of converting the eight
dimensional data elements into two-dimensional (or three-dimensional) Euclidean space.
For the purposes of this thesis, multi-dimensional will refer to a data set of dimension
greater than three. The problem we need to address is the inability to map all of the attributes
to a two-dimensional display versus the necessity to maintain as much attribute information as
possible. Since each element is defined by its attribute values, the removal of certain attributes
will reduce the graphical representation of the data set to an approximation. The more attributes
that are removed, the less precise the approximation becomes.
To address this need, we represent multi-dimensional data elements on a two dimensional
screen, using an object known as a perceptual texture element, or pexel [10]. Essentially, a
pexel is a graphical glyph (or composite of glyphs) that visually encodes the attribute values
for a given element into a single entity which is rendered to the display. Since we are limited
by the number of spatial dimensions that can be mapped to an attribute (xyz coordinates are
pexel are associated with each attribute. These features can take the form of position, color,
size, density of coverage, and orientation of the glyph, among others.
There is still a difficulty in deciding exactly which attributes should be mapped to which
visual features, however. Some features are not mutually exclusive from others. This can lead
to a display that is difficult to interpret. Also, certain features are easier for people to visually
process than others [13, 21]. For instance, position is usually the most visually salient feature.
It is easier for a user to determine if two pexels are at different screen locations than it is to
distinguish between two different pexel orientations.
To be effective, the domain of each of these visual features cannot be continuous; it must
be divided into discrete classes. The primary reason for this is that it is difficult for a user
to identify very small variations in visual feature values. For instance, a user can rapidly
determine a relative change in orientation of about15 Æ
[23]. If the relative difference is less
than that, a user will need significantly more time to distinguish the values and might assume,
incorrectly, that the values are the same. Also for many glyphs (including the one we use),
pexel orientations between 0 Æ
and 180 Æ
are mirrored between 180 Æ
and 360 Æ
. This implies
there can be at most twelve distinct values in the range of the orientation feature. Other visual
features have their own limitations. for example, users can rapidly distinguish between up to
seven isoluminant (i.e. equal brightness) colors and only three to four differences in luminance.
2.3
Data Set Format
As mentioned in the Introduction, the main goal of this thesis is an investigation of methods to
visualize large, multi-dimensional data sets on portable computing device. The real-world data
set we will use to test our implementation contains average monthly weather and environmental
conditions for land based positions throughout the world.
The data is gathered from numerous weather stations, averaged, and interpolated onto a
1 2 Æ
latitude and longitude grid by the University of East Anglia Climate Research Unit (UEA
CRU) [18]. Each location holds measurements for seven different weather readings:
temper-ature, precipitation, vapor pressure, wind speed, frost frequency, cloud cover, and wet day
frequency. Along with the latitude and longitude where the measurements were taken1, this
leads to a total of nine attributes (or a data set with dimension nine). The data set is divided
into twelve logical frames, containing average monthly values calculated for each of the twelve
months of the year.
1Since the elements in this data set contain attributes representing spatial positioning, this data set falls under
Chapter 3
Portable Computing Devices
Before discussing the application of visualization methods on portable computing devices
(PCDs), we must first define this class of device. The main criterion that identifies portable
computing devices is size. We assume a computing device that is small enough to fit into a
pocket, or to be held in the hand. Portable gaming units, current generation mobile phones,
and personal digital assistants (PDAs) all fall within this classification. The use of PCDs is
becoming widespread in the consumer market which has led to many technological advances
in terms of capabilities and power. As such, there are advantages over desktop systems which
make exploring PCDs as platforms for visualization systems viable.
3.1
Why Use Portable Computing Devices?
As their name suggests, PCDs provide a user with large degree of portability. Being much
any-where. This provides a user with the functionality of a visualization system in a much more
flexible range of locations than available through the use of a desktop system. Also, the recent
emergence of wireless network technology offers a potential means of ubiquitous access to
data. There is no longer a need to be tied to bulky fixed disks or wired network connections
to have access to the data being visualized. PCDs provide a freedom for applications unlike
anything previously provided to the consumer world.
Another benefit of PCDs is their cost-effectiveness. The price of a portable computing
de-vice is usually cheaper than that of a desktop or notebook computer system. A lower priced unit
allows for the distribution of visualization systems to a larger target audience. This audience
spans consumer, academic and corporate settings. In the consumer market, the opportunity
ex-ists to introduce visualization to people who would otherwise not be exposed. Academically,
more portable units can be purchased than desktop systems. Also the use of PCDs introduces
interesting topics for discussion or study. Finally, businesses can afford to provide these types
of units to employees on a much larger scale than would be financially possible with desktop
machines.
The physical interface of a PCD is much simpler than what is normally found on desktop
computers. The keyboard and mouse associated with a computer does not exist on PCDs,
primarily due to their size. They do, however, have directional keypads and a limited number
of selection buttons. Usually, portable gaming devices and PDAs have four to five buttons;
mobile phones have at least ten buttons (the numeric keypad). Although this does cause some
reduced functionality (see section 4.4), it also provides unique circumstances for users not
of any preconceptions about how UI tasks should be performed presents an opportunity to
manage the application in new (and possibly more efficient) ways.
3.2
Platform Information
3.2.1
Handheld Gaming Devices
Our initial investigations for this thesis explored the possible use of gaming systems as a
de-velopment platform, more specifically handheld gaming systems. Handheld gaming systems
are available on a wide scale. From Nintendo’s Game Boy web site [2]:
“The Game Boy is the world’s best-selling video game system, with over 100
million units shipped.”
This is only one gaming unit from one manufacturer. Given previous portable gaming units
such as the Sega GameGear, Atari Lynx, NEC TurboGraphix Express, and Neo Geo Pocket,
plus the more recently upgraded Nintendo units (Game Boy Color, Super Game Boy, Game
Boy Advance, and Game Boy Advance SP) we expect the total number of handheld gaming
units to be much higher. This data implies handheld gaming units are “ubiquitous” and worth
investigation.
The primary device considered was the Game Boy Color from Nintendo Entertainment
Corporation (or Game Boy as we will refer to it). One reason for this choice was the number of
units Nintendo reports selling. A second reason was the fact that Game Boy units are primarily
The hardware specifications for the Game Boy are as follows [6, 15]:
An 8-bit CPU similar to the Zilog Z80 processor (which was found in the original Tandy TRS-80 computers)
8KB of main memory
8KB of dedicated video memory
a 2.6-inch color screen with a 256244 pixel resolution and 32,767 colors (the original Game Boy had a greyscale display with a resolution of 160144 and four shades of
grey)
Although development kits exist for the Game Boy [12], there were significant drawbacks to
using this system for the implementation required in this thesis. Problems occurred both in
finding a way to create and distribute a software implementation as well as in overcoming
intrinsic shortcomings in the unit’s hardware design. As noted in the specification, the Game
Boy’s hardware is limited. Although there is a dedicated video memory (which does not often
appear in other portable devices), it is small at only 8KB. Given the small amount of main
memory that is available, we anticipated a significant shortage for what is required to visualize
even a moderately sized data set.
Displaying the data set is not the only use of memory. There is also the need for data
processing prior to the generation of the data set’s pexels. Although most information (i.e. the
data set, application, and supporting files) can be stored on the ROM cartridge, there is still
only the 8KB of main memory available for this processing, insufficient for a data set of any
In addition to the hardware limitations, there are also display constraints that arise from
how games are designed for this unit. Three graphical “layers” are available on a Game Boy.
First is the background layer, a static bitmap containing the non-interactive parts of the game
world. The background layer is used to represent items like scenery, areas for score reporting,
numbers of lives remaining, and so on. This layer does not support the efficient application of
large dynamic updates. The size of the background layer is limited primarily by the available
memory in the device. The bitmaps used as backgrounds are simple in design and usually
constructed by tiling much smaller bitmap images repeatedly to save memory. This idea is
not well suited to visualizing an arbitrary data set, since this type of image normally contains
limited redundancy.
Second is the information layer. This layer is used for communication with the user through
the use of dialog boxes that interact with the user in a non-realtime fashion, for example,
entering a name or changing game settings. The information layer is not used for any graphics
rendering.
Third is the sprite layer. A sprite is a two-dimensional bitmap used to represent a realtime
or interactive item within the game (such as the main character). The sprite layer contains all
sprites currently active in the game. This might initially seem beneficial since we are interested
in drawing pexels. One approach would be to represent a pexel as a sprite. Unfortunately, no
more than forty sprites may appear on the screen at any one time, and no more than ten may
share the same scanline. This is not useful when dealing with large data sets which may have
A final point to consider is the mode of user interaction supported by a device. In this area,
the Game Boy is not much different from the other units we researched. The basic control
system consists of a four-directional keypad with four additional selection buttons. Apart from
the information layer, no hardware or software support is made available for interacting with
the user.
3.2.2
Mobile Phones
In recent years there has been an explosion in the consumer mobile phone market. It is
esti-mated that by the end of 2003, there will be approximately 151.4 million Americans who
sub-scribe to mobile phone services [3]. Along with this growing number of subsub-scribers (or perhaps
because of it) the technology behind mobile phones advanced rapidly. Most current generation
mobile phones can do much more than place and receive voice calls. Common services include
text messaging, email, Internet access, games, and even the ability to send and display pictures
and video. The inclusion of these new features (especially the need for pictures, video, and
gaming), required that the phones had to be redesigned. Standard telephone-style devices were
not sufficient for the demand of most users. In particular, specialized hardware was added to
handle the mobile phone’s changing role. Phones are now equipped with color displays and
sophisticated processing units that allow users to view images, surf the web, and play games.
Along with the upgraded hardware, recent models of mobile phones contain full-featured
op-erating systems to support these new applications. Examples include Intel’s Symbian OS,
Microsoft’s SmartPhone, and Palm OS. The combination of graphical displays, more
Table 3.1: Comparison of Current Mobile Phones
Manufacturer Model Resolution Colors Screen Size
Motorola T720 120160 pixels 4096 colors
Nokia 6200 128128 pixels 4096 colors
Sanyo SCP-8100 120144 pixels 65536 colors 1.8-inch screen
Sanyo SCP-5300 132176 pixels 65536 colors 2.1-inch screen
Samsung SPH-A600 128160 pixels 65536 colors 2.0-inch screen
Samsung VGA-1000 128160 pixels 65536 colors
Sony-Ericsson T616 128160 pixels 65536 colors
visualization.
Unfortunately, major limitations exist to providing a visualization implementation for these
devices. Although mobile phones are equipped with color displays, the physical size of most
displays is small. A common screen size is approximately 2.0-inches with a resolution of
128160 pixels. This limits the amount of information that can be displayed at any given
time without lowering the resolution.
There are also limits on the amount of memory contained in a mobile phone. Current
generation mobile phones normally contain no more than a 1 to 2MB of memory. This memory
must be shared between all applications in use by the phone. The lack of sufficient memory
represents a serious hurdle that must be overcome in order to provide a working visualization
implementation. At this time, mobile phones are not powerful enough to support a satisfactory
3.2.3
Handheld Computing Devices
The type of handheld computing device that this thesis focuses on is a personal digital assistant
(PDA). These are units with powerful computing functionality in a package small enough to be
held in the palm of the hand. As with most devices falling under the umbrella of “ubiquitous”,
trade-offs have been made in the area of processing power, memory/storage, and graphics
display. These units have sufficient resources to warrant an in-depth exploration into their use
for multi-dimensional visualization, however.
There are several different units, made by several companies, that fall within the
classi-fication of PDA. Table 3.2 lists speciclassi-fications for some recent models available from several
different companies.
Even the small sample of devices listed in Table 3.2 give an idea of the power available in a
modern PDA. For example, Pocket PC units having processors with clock speeds of 400 MHz
and 64MB of working memory appear to have sufficient functionality to meet the requirements
of a multi-dimensional visualization system. In spite of this, these devices are not perfect for
all aspects of development. Unlike desktop machines, PDAs do not have dedicated graphics
processing units (GPUs) or dedicated graphics memory.
The device we chose to use for our investigations was the Compaq iPAQ H3630. At the
time development for this thesis started, this was one of the most powerful PDAs available in
the consumer market. It features a 206 MHz Intel StrongARM 32-bit RISC processor with
32MB of user memory. Although more recent units have increased the processor speed and
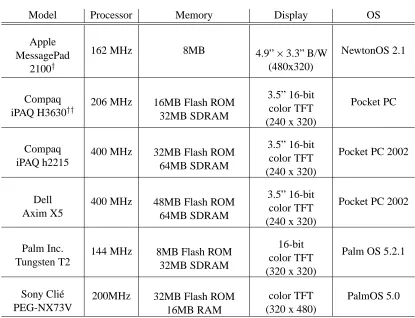
Table 3.2: Comparison of Current Handheld Computing Devices
Model Processor Memory Display OS
Apple MessagePad
2100y
162 MHz 8MB 4.9”3.3” B/W
(480x320)
NewtonOS 2.1
Compaq iPAQ H3630y y
206 MHz 16MB Flash ROM
32MB SDRAM
3.5” 16-bit color TFT (240 x 320)
Pocket PC
Compaq iPAQ h2215
400 MHz 32MB Flash ROM
64MB SDRAM
3.5” 16-bit color TFT (240 x 320)
Pocket PC 2002
Dell Axim X5
400 MHz 48MB Flash ROM
64MB SDRAM
3.5” 16-bit color TFT (240 x 320)
Pocket PC 2002
Palm Inc. Tungsten T2
144 MHz 8MB Flash ROM
32MB SDRAM
16-bit color TFT (320 x 320)
Palm OS 5.2.1
Sony Cli´e PEG-NX73V
200MHz 32MB Flash ROM
16MB RAM
color TFT (320 x 480)
PalmOS 5.0
thin film transistor (TFT) LCD display with a pixel resolution of 240320. This is the same
active matrix display technology used in notebook computers.
3.3
Graphics Packages
3.3.1
GAPI
Windows CE comes with a limited graphics library called the Games API (GAPI). The GAPI
li-brary [14] is designed to provide a programmer with direct access to the screen. Unfortunately,
pro-grammer to obtain a pointer to the screen’s memory space, then render pixels by writing values
directly to this memory block. This works well for games that have minimal screen updating
(e.g. static backgrounds with small sections that change), but it does not provide appropriate
refresh rates when the entire screen needs to be redrawn repeatedly. Since performing certain
transformations or changes to the data-feature mapping of a visualization requires a complete
redraw of the screen, GAPI alone lacks the necessary efficiency for our visualization goals.
3.3.2
EasyCE
The EasyCE package [1] is a limited front-end and a set of basic extensions to the GAPI
li-brary. EasyCE provides added functionality for drawing primitives as well as rendering sprites.
Although EasyCE has been recently revised, it is still built on the GAPI library, and therefore
does not provide sufficient power or flexibility for the type of graphics rendering we need for
scientific visualization.
3.3.3
X-Forge
X-Forge is a 3D graphics package released by Fathammer Ltd. [16], a company based in
Fin-land. X-Forge is composed of two parts: a graphics “core” (the component of interest for this
project), and a 3D game engine. The graphics core is a hardware level replacement for GAPI.
A number of commercial products are currently supported by the package, including:
Symbian OS (used by Nokia cell phones)
Microsoft Smartphones
Microsoft Pocket PC and Pocket PC 2002
Mobile Linux
This graphics package appears to be an excellent candidate for development, since it provides
high-speed rendering and compatibility across a range of portable systems. Unfortunately, due
to the late release date of the SDK to the public (late fall 2002), we were only able to test the
graphics package through the use of demo applications provided by Fathammer. We believe
X-Forge should be explored in more detail as a potential foundation for future work on building
portable computing applications.
3.3.4
DieselEngine
DieselEngine is a graphics package written and distributed by Inmar Software Ltd. [17], a
company based in Finland. The basic design of the package is modeled after Microsoft’s
DirectX SDK to provide programmers with an interface similar to a well-known desktop-based
API (it is not a DirectX clone, however). After reviewing the package, we concluded that
DieselEngine provides an acceptable blend of efficiency and functionality, when compared
with the alternatives available at the time. Even though it does make use of GAPI, there are
many internal improvements to allow for more rapid and efficient graphics rendering. This is
Chapter 4
Overcoming Limitations
As discussed previously, there are advantages to using portable computing devices for
visu-alizing data. Unfortunately, there are also limitations which need to be addressed to ensure
an efficient visualization system. They fall under the categories of: display, input interface,
storage and memory availability, and processing power. Each limitation and the steps taken to
address it are described below.
4.1
Display Limitations
The limitations of a PCD’s display can be attributed to two different factors: the screen used to
display the program output, and the graphics processing unit used to generate the output. As
PCDs become smaller, the physical size of the screen is reduced. This introduces two potential
problems:
2. Fewer pixels are available for representing each data element.
Although in certain circumstances it may be possible to trade-off one constraint against the
other (e.g. give more screen space to each pexel, at the expense of showing fewer total pexels
per screen), the small size of the display will almost always impose a significant limitation on
the amount of data we can visualize at any one time.
A goal of visualization is a graphical rendering of large data sets in a human readable
format, to allow for exploration and analysis of the data. This can take the form of comparing
individual data elements or looking for patterns within the data as a whole. Showing less
information can seriously degrade our ability to perform these types of tasks. The fewer pexels
we render, the less complete and less informative the representation becomes.
Reducing the number of pixels that are used to display each pexel will allow more pexels
to be rendered to the screen. A decrease in resolution can hamper the image’s functionality
and readability, however. As the number of pixels per pexel decreases, visual properties like
size, orientation, density, and regularity of placement become difficult to distinguish. These
(and other) visual features require a minimum resolution to be effective. When the screen
space allocated to a pexel falls below that resolution, the ability to use the feature to encode
information is lost.
This suggests that one important problem for visualization in portable computing
environ-ments is finding a proper balance between these two constraints. There is a need to maximize
the number of pexels that can be displayed while not shrinking each pexel below the point of
usefulness. For this thesis, we choose a fixed trade-off between pexel size and number of
depending on the data being displayed and the visualization tasks the user wants to perform.
One possibility would be to allow the inclusion of each visual feature only if the user is viewing
the image above the minimum resolution the feature requires. This is left as a topic for future
work.
The second display component that can limit efficiency is the type of graphics processor
used by the device (or more accurately, the lack of a graphics processor). The use of a dedicated
graphics processing unit (GPU) would allow for a more efficient and more rapid rendering
of the on-screen visualization images. A GPU often implements core graphics routines at a
hardware level. This significantly improves rendering speed relative to software-based graphics
routines. At this time, however, there are very few PCDs that contain a dedicated GPU.1
4.2
Processing Limitations
PCDs do not have the processing power found in modern desktop computers. The current
generation of desktop computers contain general-purpose processors with clock speeds of 2
to 3GHz. PDAs have processors with clock speeds of 200 to 400MHz; mobile phones and
gaming devices tend to be even slower. Having a device with a lower clock speed may seem
adequate for the visualization of large data sets, however, the processors have a greater
respon-sibility than those found in a desktop machine. This is primarily due to the lack of a graphics
processing unit. In addition to accelerating image rendering, GPUs relieve some of the burden
from the CPU. The CPU does not need to handle software level rendering routines which are
1In the final weeks of this thesis’s completion, Pocket PC units are being introduced with dedicated graphics
implemented by hardware in the GPU. This problem can be addressed, in some part, by using
a specialized graphics package (see section 3.3). These packages provide highly efficient
im-plementations of common graphics rendering routines (usually in assembly language), which
reduces some of the burden placed on the CPU.
4.3
Storage Limitations
Memory on a PCD is also limited when compared with desktop machines. Although the newest
generation of devices (such as the Pocket PC) are equipped with 64MB of memory, the majority
of PCDs are still limited to 16MB or less (some have as little as 1 to 2MB of available
stor-age). This is a significant factor when dealing with graphically intensive applications. Primary
memory must be divided between long term storage and currently running applications, since
the active applications and their respective data exist in the same memory space. This forces
us to manage memory carefully, both to achieve acceptable performance from an application,
and to allow us to visualize data sets of a reasonable size.
On a desktop workstation, the use of temporary storage does not hinder the effectiveness of
a visualization application. In fact, it is often used to support efficient rendering of a data set.
For example, a collection of pexels can be maintained to allow for incremental modifications
prior to re-rendering. With the limited storage capacity in portable computing environments,
that same set of pexels must be destroyed as they are rendered to make room for the bitmap
representing the visualization that we will display to the user. This is a critical issue for a
or motion are not feasible, since they necessitate that the display be repeatedly updated even
when the data and its data-feature mapping are static. The entire bitmap would need to be
re-constructed at each flicker and/or motion interval, a time consuming process in an environment
where intermediate results cannot be saved. Because of this, we limited our visualization to
visual features that are static in nature.
4.4
User Interface
PCDs have a limited interface to allow a user to interact with its applications. These
restric-tions exist both in hardware and in software. The keyboard and mouse combination that is
traditionally associated with a computer does not exist with handheld devices2, primarily due to their size. Also, since the operating systems must be more lightweight on PCDs, many of
the widgets that are available on standard desktop operating systems are not provided. This
simplified environment offers advantages and disadvantages to a user. On the one hand, the
simplicity allows for the introduction of visualization systems to a broader audience that may
not be familiar with traditional user interfaces. However, we are also limited by the built-in
functionality a device provides to its applications.
Desktop computers use keyboards which have in excess of fifty keys available for an
appli-cation to use (excluding meta-key combinations). Since PCDs have only a directional keypad
and a few buttons, some form of remapping must occur when adapting a visualization system.
2Some recently released PDAs are coming equipped with a miniature keypad which simulates the functionality
One option would be to reduce the functionality available in the application. This is usually
unacceptable, however, since there are operations that must exist in any visualization
applica-tion. Alternatively, the ability to dynamically remap the function of a device’s buttons can be
provided, usually through the use of menus within the program. Another hardware component
not present on PCDs is a mouse. This is an issue only when dealing with portable computing
devices other than PDAs. PDAs provide an alternate pointing device, a touch screen. Since
the primary focus of this thesis is on the Pocket PC, this is not a concern for our visualization
environment.
There are also some potential limitations in the software of the devices. PCDs do not
come with as feature-rich an operating system as desktop systems. The ways in which the
application can communicate with the user is more limited. For example, with the lack of a
keyboard attached to these devices, textual input is difficult to implement, usually requiring
several button presses to communicate a single character. Most PDAs provide specialized
interfaces such as a virtual keyboard, handwriting recognition, and graffiti tablets to interact
with the user through the touch screen. This can take up valuable screen space, however, which
may be better used for the visualization image. With a virtual keyboard that can be hidden on
demand, a touch screen, and the ability to remap the functionality of the buttons through menu
options, the Pocket PC can overcome most user interface limitations without sacrificing the
Chapter 5
The Implementation
We next discuss the application developed to implement the ideas proposed in this thesis. This
is an implementation of a two-dimensional visualization environment. At the time this thesis
was started, the support for three dimensional graphics on PCDs was not powerful enough to
handle the demands imposed by such a requirement. The application was developed to run on
the Pocket PC operating system and built using Microsoft Embedded Visual Tools [5] and the
DieselEngine graphics package [17]. Microsoft Foundation Classes were used to handle the
user interface components [4].
5.1
The BinFile Class
The BinFile applies a logical structure to the data set being visualized. The datafiles processed
by our visualization system are organized in a specific manner (see section 2.3). To recap,
values. The data set may be broken up into logical subsets, or frames. Each frame represents
a collection of elements meant to be visualized separately from elements in other frames (e.g.
a data set of monthly weather conditions could be broken up into twelve frames, one for each
month from January to December; data in each frame would be visualized separately). A bin
file consists of some number of data frames followed by footer information which describes
how the data is to be interpreted. The following information is contained in the footer of the
bin file:
The number of attributes per data element.
The number of frames in the file.
Strings providing a short name/description for each attribute.
A list of the previously applied data-feature mapping.
1
A list of the largest allowable value for each attribute.
A list of the smallest allowable value for each attribute.
A list containing the number of elements in each frame.
After reading the footer, some preprocessing must be done prior to loading the first frame of
data. Since the data sets used in our visualization system come from a third party [18], the
integrity of the data set’s structure must be maintained. This allows for a greater flexibility
in processing arbitrary data sets from sources following this structural format (which is an
1This is the only value which is modified by the visualization application. It is used to keep track of the most
accepted bin file format for some current desktop visualization implementations), without users
having to rely on files created specifically for our application. The footer, however, doesn’t
contain all the necessary information for our application to generate a visualization image.
Each particular visual feature is (usually) comprised of a discrete range of values (e.g. a
set of colors). To this end, we need to determine the minimum and maximum values of each
attribute stored in the bin file to specify the attributes’ actual ranges. The footer provides
only the minimum and maximum allowable attribute values, not the minimum and maximum
values that actually appear in the data set. The allowable minimum and maximum values are
used to determine whether an element contains valid attribute information. If an attribute’s
value is outside of these tolerances, the element is assumed to be corrupt and is discarded from
further processing. The actual minimum and maximum values stored in the bin file are used
to compute the range for each attribute. This attribute range can be mapped to the domain of
the visual feature being used to represent the attribute (as defined in the data-feature mapping).
This allows us to maximize the use of each visual feature when we visualize the data set.
5.2
The Pexel Class
Each individual element within the data set is represented graphically by a perceptual texture
element, or pexel. A pexel is a composition of glyphs that provide a visual encoding of a
multi-dimensional element in a two-multi-dimensional (or three-multi-dimensional) Euclidean space. A pexel
represents attribute values from a data element by varying its visual appearance. The
earlier we mentioned the data set used during development contained weather data taken from
various locations around the world. One possibility would be a mapping of the temperature
attribute to color. Each pexel would be assigned a particular color based on the temperature
values stored in its corresponding data element. The color used for specific temperatures would
depend on the actual minimum and maximum temperature values stored in the data set.
Tem-perature values close to the minimum value would produce dark blue pexels. TemTem-perature
values close to the maximum would produce bright pink pexels.
The pexel itself is drawn as one or more 2-D rectangular glyphs. The number of glyphs
a pexel contains is determined by the visual feature density (described below). In our
imple-mentation a pexel can encode up to five attributes. The longitude and latitude attributes are
used to position a pexel within the visualization image. The remaining three features (color,
orientation, and density) can be dynamically mapped to any three additional attributes the user
chooses. Each attribute had its minimum and maximum value calculated over the data set. This
range of values is divided into equal-width sections based on the number of different discrete
values the visual feature supports.
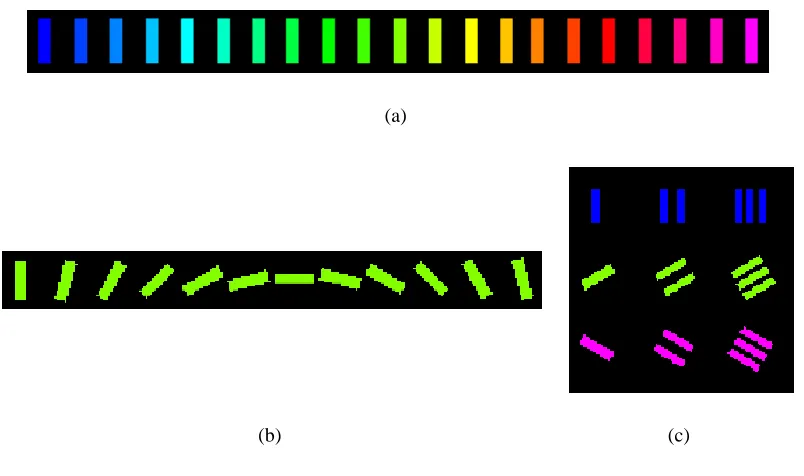
The first visual feature is color. Color has the ability to display twenty-one different values
as shown in Figure 5.1(a). The smallest attribute values are mapped to the color blue with
increasing attribute values assigned to colors in the order listed in Figure 5.1(a). The largest
values would be displayed with the color magenta. Color is the most perceptually salient visual
feature of the three we use. It is superseded only by position (see section 2.1 for a discussion
of “easily discernible features”).
rep-resents the magnitude of the attribute value being visualized. As mentioned in section 2.1,
the human eye can rapidly recognize a difference in rotation of 15 Æ
. Our application makes
use of this angular distance to separate each orientation value. Smaller orientation values
be-come hard to discern due to the size of the display. The different orientations are shown in
Figure 5.1(b).
The third visual feature we use is density. Recall that each pexel is represented by one
or more rectangular glyphs. The number of glyphs is determined by this mapping. For our
implementation, the range of actual values for the attribute mapped to density is divided into
three subranges. Elements with attribute values in the first subrange are represented by a
sin-gle glyph. Attribute values in the second subrange are represented with two glyphs. Finally,
attribute values in the third subrange are represented with three glyphs. The larger the value of
the attribute that is mapped to density, the more of a pexel’s screen space that is covered by its
glyphs. Examples are shown in Figure 5.1(c).
In addition to tracking its attribute mappings, each pexel is responsible for rendering itself
to the screen. A pexel is rendered as a 2-D surface with a visual appearance based on its
element’s attribute values and the current data-feature mapping. Since memory on the Pocket
PC is limited, to allow for large data sets to be visualized the pexel objects are not cached
once they have been rendered. This can cause problems when a user wishes to perform affine
transformations (e.g. translation, rotation, or zoom) on the visualization to explore areas of
interest in a frame. Each time a transformation is performed, all the pexels would need to be
reconstructed prior to being re-rendered. This is a time consuming process which could make
(a)
(b) (c)
Figure 5.1: Examples of Visual Features: (a) Each of the twenty-one colors used for the “color” visual feature which are mapped to values from top-to-bottom, left-to-right; (b) The twelve states of the “orientation” visual feature with angular distance between each state is15
Æ
; (c) Examples of the three classes of the “density” visual feature shown at different rotational states.
of a pexel map.
5.3
The Pexel Map
When users are visualizing data, they normally require the ability to manipulate the visual
im-age. The display found on PCDs may be too small to show an entire data frame at a resolution
which allows for visual features to be clearly understood. To this end, users may need to scroll
the image on the screen to locate portions of the visualization that seem appealing. Once
inter-esting sections of the visualization are noted, a user may want to zoom in to get a more detailed
lack of sufficient resources to rapidly re-render pexels within the visualization as the user
per-forms these tasks. A method is needed to address the issue of dynamically re-rendering each
pexel while still providing users with appropriate responsiveness to allow them to explore the
data set.
As an initial step, a two-dimensional mapping was chosen for visualizing the data set.
This allows for a more efficient means of manipulating the image once it is rendered. Although
some new PDAs have sufficient processing power to handle simple three-dimensional graphics,
the main goal of this thesis is to explore the extension of scientific visualization techniques
available on desktop systems to PCDs. Other types of PCDs such as portable gaming devices,
cell phones, and less powerful PDAs do not have the resources needed to support efficient 3-D
visualization. We therefore constrain ourselves to addressing those issues common to most
personal computing devices.
Since it is not possible to re-rendered every pexel each time the user performs a
transforma-tion on the image, an intermediate bitmap is used as a canvas on which the pexels are rendered.
This bitmap (or pexel map) contains the visual representation of all the pexels for the current
frame. This alleviates the need to store the pexels themselves, thus freeing memory to be used
for the display of larger data frames. Transformations are performed on the pexel map as a
whole rather than being applied to the individual pexel objects.
When generating the map, a data element is read from the data set and a pexel is created
to represent it. As mentioned previously, each pexel calculates and stores all the information
necessary to render itself. Instead of drawing directly to the screen, however, the pexel is
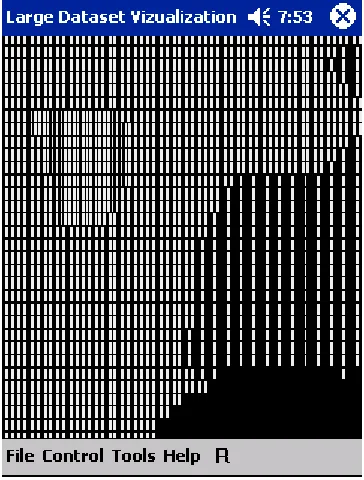
Figure 5.2: An example pexel map showing weather data in the southeastern United States for the month of January. The data-feature mapping shown is temperature!color, wind speed!orientation, and vapor pressure !density
rendered for each data element in the frame. The pexel map is then drawn to the screen (see
Figure 5.2). Any affine transformations performed by the user simply change the position of the
pexel map within the window. No re-rendering of individual pexels is required to to translate,
rotate, or zoom the current frame.
The pexel map is a static object. After it is created, the pexel objects that it displays no
longer exist. Because of this, it is not possible to use dynamic visual features within the
vi-sualization (e.g. flicker and motion). If the state of a pexel object needs to change after it
has been rendered, the entire pexel map must be recreated. Although this is not an issue for
desktop computers, the processing power of a PCD cannot support real-time completion of this
when the frame being visualized changes, or when the data-feature mapping is modified by the
user.
5.4
User Interface
Since we used the iPAQ H3630 for development, we will focus on the controls for this model of
Pocket PC. There are five selection buttons, two of which are globally mapped to system menu
functions, a four directional keypad containing an “enter” button at its center, and a 3.5-inch
touch screen.
There is one major limitation with the buttons on this particular model which has been fixed
in later generation units. The selection buttons cannot be used simultaneously with each other
or with the directional keypad. This meant that mapping functionality to these buttons:
1. Would remove the globally mapped operating system functionality.
2. Would not allow us to use the buttons as meta buttons (such as “crtl” or “alt” on a desktop
keyboard).
With such a limited number of buttons at our disposal, together with the hindrance that only
one button may be used at a time, we chose to limit the functionality we provide through the
buttons of the device.
One feature available on a Pocket PC is a virtual keyboard and character recognition system,
called a soft input panel (SIP). Such a system would provide a user with access to almost all
First, since the system is “virtual”, it must be displayed on a portion of the screen. Because the
size of the display for Pocket PC devices is limited, every pixel of space is extremely valuable.
Even though the SIP can be hidden when it is not being used, it occupies approximately
one-third of the screen when it is shown. We felt this significant use of screen space would hamper
rather than improve the useability of the application. Also, a SIP is not always available outside
of the Windows CE environment. Some PCDs may have similar mechanisms (such as graffiti
systems), but there is no guarantee that this functionality will be present. We wanted to avoid
any use of device-specific user interface tools.
The Pocket PC platforms, as well as most PDAs, offer a significant advantage over other
portable computing devices when it comes to user interaction. The mouse, traditionally found
with desktop and notebook systems, is not used. Instead the touch screen acts as a pointing
device. This provides a simple, direct method for a user to interact with the visualization
system. Most of the input for our implementation is done through this device. There are two
primary reasons for this choice. First, the touch screen allows the user to have direct interaction
with the visualization they are exploring. Instead of using an external device (such as a mouse)
to manipulate a pointer on the screen, users are able to “touch” portions of the image they find
interesting or “grab”the image and manipulate it. To a lesser extent, the touch screen was also
chosen as the primary input device because certain buttons are pre-mapped to operating system
5.4.1
Transformations
Control of the pexel map is provided through the touch screen. The user can perform three
different affine transformations on the image to define which areas of the pexel map they are
viewing and in what detail in which they view it: translation, rotation, and zoom. Translation
is performed by grabbing and dragging the image around the screen with the stylus. There is
a direct one-to-one relationship between the distance the stylus is moved and the distance the
image is translated on the screen.
Since the visualization is two-dimensional, it rotates around an axis perpendicular to the
pexel map. Rotation takes place around the center of the pexel map. The angle that the pexel
map rotates is calculated based on the distance the stylus rotates around the center of the screen.
For every2 Æ
the stylus is moved, the image is rotated by that same amount. Since the
calcula-tions involved in determining an angle of rotation are time consuming, a minimum movement
distance is imposed. This distance is approximately the smallest distance able to be
regis-tered and displayed by the device. This saves unnecessary calculations leading to a smoother
transformation of the pexel map.
The final available transformation is scaling, which can be used to to zoom in or out of
the image. Magnifying the image lets users explore areas of the visualization which they find
interesting in greater detail. The visualization can be zoomed out, to view global context, and
to search for high-level areas of interest. Each of the scaling transformations are performed
by having the user touch the particular location they wish to zoom in or out on. That location
currently selected transformation.
The use of the touch screen offers many benefits over the four way directional keypad for
performing transformations. First, the user can translate along any direction in the plane, in
contrast to limiting the motion to one of the four cardinal directions. Rotation benefits since
there is no need to define a fixed angular rotation distance for each press of the button. The
user can select a rotation angle from 2 Æ
to 90 Æ
, based on the angular distance the user drags
the stylus around the screen’s center. Finally, scaling allows areas of interest to be selected and
magnified by pointing to it. The area selected is centered prior to being scaled so the user does
not need to perform a translation before changing the magnification in order to explore the area
of interest.
5.4.2
Menus
The options available to the user are accessed through menus located within a tool bar at the
bottom of the screen. This arrangement follows the standard application model for programs
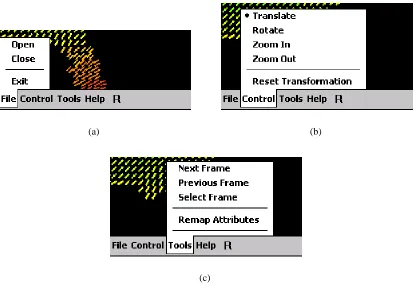
executing on the Pocket PC operating system. There are three menus available: File, Control,
and Tools (see Figure 5.3).
The File menu provides options for loading and unloading data sets. The data sets must
meet the criteria described in section 2.3 and section 5.1. This menu also includes an option to
exit the program.
The Control menu allows users to select which type of affine transformation to perform on
the data set (see section 5.4.1). The visualization can also be reset back to its original state,
(a) (b)
(c)
Figure 5.3: Application Menus: (a) The File menu allows for loading / unloading of data sets; (b) The Control menu allows for changing transformation modes; (c) The Tools menu allows for frame selection and modification of the data-feature mapping.
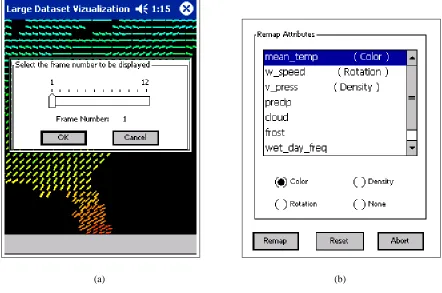
The Tools menu contains options for choosing frames and defining the data-feature
map-ping. A user can step forward and backward through the data set one frame at a time, or jump
to a specific frame (see Figure 5.4(a)). When modifying the data-feature mapping, there are
three visual features that the user has control over: color, orientation, and density. Selecting the
“Remap Attributes” option from the Tools menu opens a dialog with a list of all the attributes
in the data set along with their current mappings (see Figure 5.4(b)). The user can select which
visual features to associate with each attribute. Once this change is made, however, it is
(a) (b)
Figure 5.4: Tool Menu Dialogs: (a) Frame Selection Dialog; (b) Data-Feature Mapping Dialog
Chapter 6
Practical Application
The ideas presented in this thesis were applied to a real world data set to explore their
prac-tical feasibility. The data set we used was obtained from the University of East Anglia [18]
and contained average weather and environmental conditions across the United States. A
de-scription of the contents and format of this file were discussed in section 2.3 and section 5.1,
respectively. We used our software to visualize multiple weather conditions, simultaneously, in
a single image. The user can explore the image, using both affine transformations and changes
to the data-feature mapping, to locate interesting sections of the data set.
Our implementation supports visualization of weather data for the entire country without
any limits on performance. Further testing suggests, this is the largest data frame that we
can support on the current test platform (iPAQ 3630). Memory appears to be the primary
contributing factor to this limitation. This device has only 32MB of total RAM which must be
shared between working memory and storage. As more powerful devices become available, it
During our discussion of multidimensional visualization (Section 2.2), we talked about
cer-tain attributes being more salient than others. Excluding position, our application uses three
visual features when building the visualization image. We can use the implementation we
cre-ated to compare these visual features individually. Figures 6.1(a) 6.1(c) show a visualization
of three weather conditions in the southern United States for the month of August mapped
individually to their respective visual features:
Wind speed!density
Cloud cover!rotation
Vapor pressure!color
From these images we can compare the ease in which changes between individual values can be
discerned for each feature. Color appears to be the easiest for determining differences between
values. Figure 6.1(d) shows the full visualization using a composite of all three of the previous
mappings.
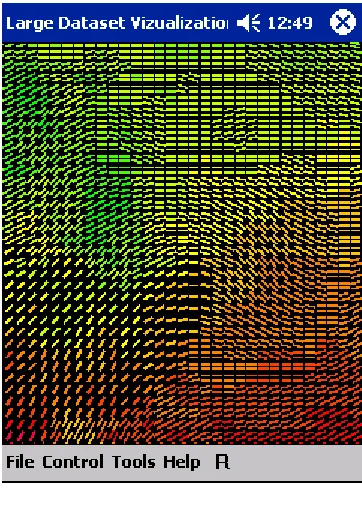
A particular visualization is dependent on the overall minimum and maximum values for
each attribute in the data set (see section 5.1). There are two data sets that we tested: weather
conditions for the entire country, and a a subset of that file containing only elements located in
the eastern half of the country. Even though the smaller file contains the same element values
for the locations copied from the larger file, the visualization can look different if the elements
containing the overall minimum and/or maximum values are not included in the subset. A
feature. Figure 6.2 gives an example of this. Two visualizations are shown, each using the
same data-feature mapping:
temperature!color
precipitation!rotation
cloud cover!density
Figure 6.2(a) is the visualization obtained when processing the smaller data set (only the eastern
United States). The visualization obtained from processing the larger data set, with element
values spanning the entire country, is shown in Figure 6.2(b).
Figure 6.3 contains two additional visualization examples provided by our application.
Fig-ure 6.3(a) is a visualization of the northwest United States for the month of November with the
data-feature mapping:
frost!color
precipitation!rotation
wet day frequency!density
Figure 6.3(b) is a visualization of the central United States for the month of October with the
data-feature mapping:
temperature!color
wind speed!rotation
(a) (b)
(c) (d)
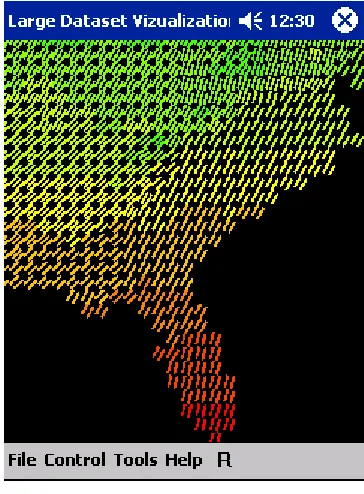
Figure 6.1: Visual feature examples of weather conditions in the southern United States for the month of August: (a c) individual visual features mapped to individual attributes; (a) wind speed!density; (b) cloud cover!
(a) (b)
Figure 6.2: Visualizations for the month of March using different data sets of weather conditions with the same data-feature mapping, temperature!color, precipitation!rotation, cloud cover!density: (a) visualization
(a) (b)
Figure 6.3: Additional visualization examples: (a) visualization of the northwestern United States for the month of November with a data-feature mapping of frost!color, precipitation!rotation, wet day frequency!density;
(b) visualization of the central United States for the month of October with the data-feature mapping temperature
Chapter 7
Conclusion
The question we set out to answer was: Is it possible to visualize data on a portable computing
device in a way that harnesses the device’s advantages, while overcoming its limitations? This
question can be addressed in two parts. The beginning of our question, Is it possible to visualize
data on a portable computing device . . . , must be answered first.
We discussed three main classifications of portable computing devices: portable gaming
systems, mobile phones, and personal digital assistants. The first two classifications are not
mature enough (from a graphics perspective) to allow a working visualization system to be
implemented. In most cases, the display size is too small to allow a visualization image to be
rendered in an effective manner. Also, these units do not have the storage or processing power
to support an efficient visualization system. Some of the next generation devices (e.g.
Nin-tendo’s Game Boy Advance, and Nokia’s N-Gage) do show promise of having the necessary
components for future exploration.